SECTION 2 Supply Demand Equilibrium DEMAND Module 5

SECTION 2: Supply, Demand & Equilibrium

DEMAND Module 5

Intro to Demand What do you think of when they hear the term supply and demand? Example: Starbucks raised coffee prices on Oct. 6, 2006 • Raised prices for the first time in 6 years – WHY? • Did they want more profit all of the sudden? Bean prices increased because coffee growers cut back production 10 years earlier due to low prices • Additionally bad weather had ruined crops
 and sellers (bean farmers) constitute a market")
Intro to Demand Coffee bean buyers (Starbucks) and sellers (bean farmers) constitute a market A market is an institution or mechanism that brings together buyers (demanders) and sellers (suppliers) of particular goods and services. • A market may be local, national, or international in scope. • Some markets are highly personal with face-to-face exchanges and flexible prices (a garage sale or estate auction) while others are impersonal and remote (global market for oil or coffee beans). In this section are concerned with competitive markets.

Competitive Markets A competitive market is a market where there are many buyers and sellers of the same good or service • No individual actions have a noticeable effect on the price of the good or service • This is not every market • Look at Coke and Pepsi – there are too few sellers • It is easier to model • Start simple and then build upon that

Competitive Markets A result of the competitive market is the Supply and Demand Model • Consists of: • Demand Curves • Supply Curves • Factors • Market Equilibrium

Demand Curve Demand is not commanding someone to do something • If I were to ask what is the demand for coffee, or the demand for i. Phones, or the demand for cars, or anything? We cannot simply multiply the number of units sold person by the number of people. • It all depends on the price at a given time • Look at coffee, prices change and people’s consumption changes • How much depends on price

Demand Curve The Demand Schedule is a table showing how much of a good or service consumers want to buy at different prices • This is used to create our demand curve

Demand Curve

Demand Curve Schedule shows how much buyers are willing and able to buy at five possible prices. • The market price depends on demand supply. Changes in price will result in change in quantity demanded – the amount consumers will consume at specific prices

Demand Curve Why?

Demand Curve This is the Law and Demand: the higher the price of a good/service, all other things being equal, will lead people to consume a smaller quantity of that good/service, and vice versa

Shifts in Demand In 2006 coffee prices were higher than in 2002, but total consumption of coffee was higher also; how does this follow the Law of Demand? The key is “all other things being equal” or in Economics Ceteris Paribus • Things were different • World population had increased • The popularity of lattes and other coffee drinks had increased

Shifts in Demand

Shifts in Demand This example shows a change in demand; a change in the quantity demanded at any given price, represented by a shift in position of the original IMPORTANT: this is different than a movement along the demand curve, which is only a change in the QUANTITY DEMANDED as a result of a price change, not as the result of a change in demand.

Change in Quantity Demanded vs. Change in Demand

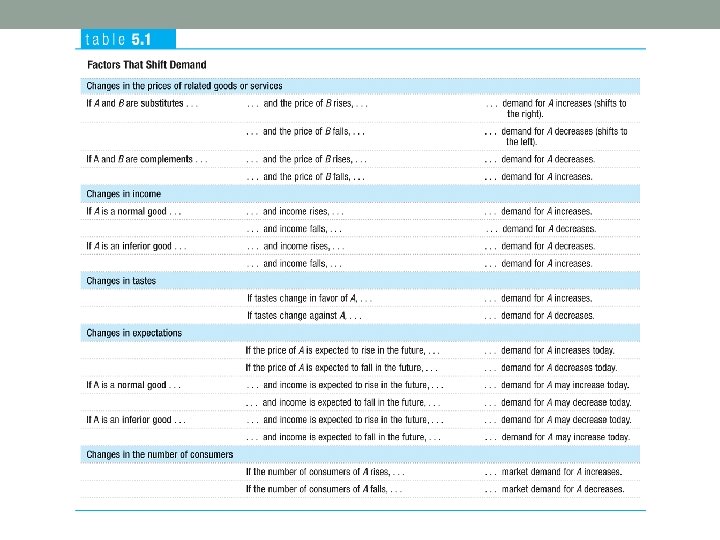
What Shifts Demand Changes is the prices of related goods and services • Substitutes: goods are considered substitutes when the rise of prices of one good makes consumers more willing to buy the other good • Examples? • Compliments: goods are considered compliments when they are consumed together. Fall in the price of one good makes consumers more willing to consume the other good • Examples? Changes in income • When income rises the NORMALLY are more likely to purchase more of a good at a given point in time • Normal Goods are when the demand for that good rises when consumer income rises, and vice versa • Inferior Goods are when the demand for decreases for that good when incomes rise, and vice versa • What are some examples of both goods?

What Shifts Demand Changes in tastes or preferences • Example the popularity of coffee in the early 2000 s offset the increased prices Changes in expectations • Consumers have expectations about future prices, product availability, and income, and these expectations can shift demand. Changes in the number of consumers • Differentiate between individual demand curves and market demand curves • Everyone have different individual curves • Market Demand Curve is the combination of all individual curves

Market Demand

Increase/Decrease in Demand

The Market for: Event Cause the ______ to ______ Gasoline SUV Prices Drop Demand to increase Salsa Study show eating tomatoes reduces risk of cancer Peach Prices rise sharply Sporks Plastic fork prices rise Insoles Running shoes prices rise

SUPPLY & EQUILIBRIUM Module 6

Supply Just as price will determine the quantity in which consumers will want to buy a good, the price will determine how much a producer will want to produce and sell • Different prices will determine the quantity supplied: the amount of a good or service producers are willing to sell at some specific price

Supply Schedule A supply schedule shows how much of a good or service a producer will supply at different prices • The schedule creates the supply curve which shows the relationship between quantity supplied and price The supply schedule shows that when the price is high, the quantity of coffee supplied is high. This relationship is known as the Law of Supply. • This is the reason the supply curve is upward sloping

Supply Schedule

Supply Schedule The Law of supply is believed to hold true for most products: • All else equal, as the price rises, quantity supplied rises. • Restated: There is a direct relationship between price and quantity supplied. • A positive relationship • Why? How does it relate to opportunity costs and marginal benefits/costs?

Shifts in Supply Why would coffee prices decrease if Vietnam became a producer of coffee beans? • What are some reasons that the supply curve would move?

Shifts in Supply A change in supply is a shift of the supply curve, which changes the quantity supplied at any given price • NOTE: a change in supply is different than a movement along the supply curve, which is called a change in quantity supplied

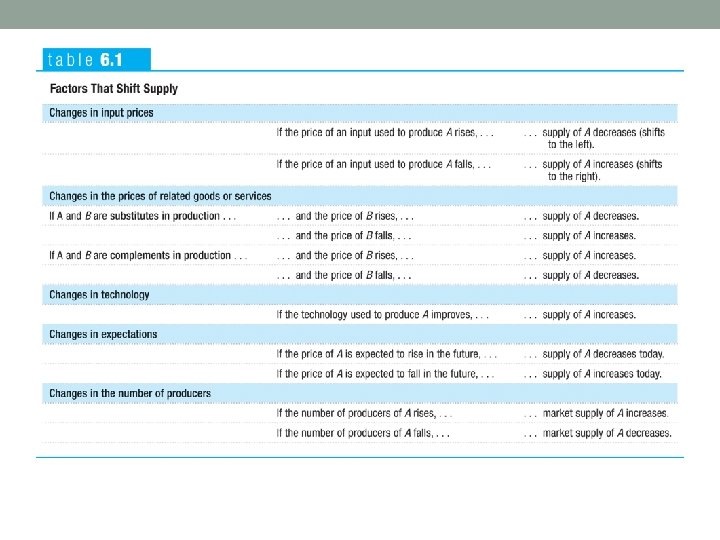
What Shifts the Supply Curve Changes in input prices • Inputs are anything used to produce a good or service • EXAMPLE; price of milk goes up, supply of ice cream shifts left, signifying a decrease in supply • Other Examples? Changes in prices of related goods/services • Produces often produce multiple goods, sometimes using the same inputs • Oil refinery can manufacture gasoline or heating oil and various other products • Heating oil prices increase, supply curve for gasoline will shift to the left, decrease in supply • These are substitutes in production • An increase in pricing for oil, will result in an increase in natural gas production, often a by-product of oil-well drilling • These are compliments in production

What Shifts the Supply Curve Changes in technology • All methods that people can use to turn inputs into useful goods (not just high tech) Changes in expectations • Expected future prices can lead a supplier to produce more or less of a good/service today • The good may already be produce, but can be stored and left off the market • Gasoline is store for long periods of time, often waiting for the summer when prices tend to rise Change in the number of producers • Just like individual demand curves make up market demand, individual supply curves make up market supply curve; total quantity supplied by all producers

Market Supply

Increases/Decreases to Supply

Supply, Demand, and Equilibrium How do supply, demand, and the factors that shift the curves work together? • In a competitive market environment, supply and demand tend to move towards an equilibrium; situations when no individual would be better off doing something different • Cash register example: Long lines at the grocery store, the manager opens up another register, people shuffle around (individual interest, save time), but eventually things even out and no line is quicker than another

Supply, Demand, and Equilibrium A market is at equilibrium when the price has moved along to a level which the quantity of a good demanded equals the quantity of a good supplied • No individual sell is better off by offering to sell more or less of that good • No individual buyer could be better off consuming more or less of that good

Equilibrium Price The price that matches quantity supplies and quantity demanded is the equilibrium price; Also called the marketclearing price The price that “clears” the market by ensuring that every buyer willing to pay that price finds a seller willing to sell at that price • The quantity bought and sold at the price is the equilibrium quantity

Three Questions About Arriving At Equilibrium 1. Why do all sales and purchases in a market take place at the same price? 2. Why does the market price fall if it is above the equilibrium price? 3. Why does the market price rise if it is below the equilibrium price?

Why Do All Sales And Purchases In A Market Take Place At The Same Price? Is this really the case? • Think about buying goods at a “tourist trap” • Prices for the same goods vary from shop to shop (from customer to customer) • Tourists do not know which shops offer the best deals, they do not have time to become educated consumers • In most markets buyers and sellers have been around for a while, they are educated/informed about the market • Prices generally are uniform • If a seller is charging a higher price, buyers will shop somewhere else • So the seller must charge a lower price • Conversely, sellers will not sell below a price they knew buyers are willing to pay • They will wait for the customer who is willing to pay the more reasonable price • In well established, on-going markets, all sellers and buyers receive approximately the same price, market price

Prices “Settle”

Prices “Settle”

Why Does The Market Price Fall If It Is Above The Equilibrium Price? When the price is above market equilibrium, there is a market surplus, or excess supply • There is a Surplus of a good when the QS exceeds the QD • Surplus = Qs – Qd

Why Does The Market Price Fall If It Is Above The Equilibrium Price? Coffee suppliers are frustrated because they cannot find enough buyers who want their produce at that price. This gives sellers incentive to lower prices in order to “poach” from other coffee producers, to gain their customers. • Causes other producers to lower their prices in order not to lose customers • Price naturally moves towards equilibrium

Price Above Equilibrium: Surplus

Why Does The Market Price Rise If It Is Below The Equilibrium Price? When the price is below market equilibrium, there is a market shortage, or excess demand. • Shortage = Qd – Qs

Why Does The Market Price Rise If It Is Below The Equilibrium Price? There are frustrated would-be buyers • People want to purchase at that price but are unable to find producers willing to sell at that price • Buyers must offer more OR sellers will realize that they can charge a higher price • This is a bidding up of prices – the market price will rise

Price Below Equilibrium: Shortage

CHANGES IN EQUILIBRIUM Module 7

Prices “Settle”

Why Would Equilibrium Change? World coffee example: • Vietnam becomes a coffee-producing nation • Coffee prices fall, why?

Why Would Equilibrium Change? A new medical report states that chocolate is good for you • What happens in the market? • Increase in demand, results an increase in Equilibrium prices

Shifts in Demand If tea prices rise, then there will be an increase in demand for coffee, what does that look like in the market? • E 1 to E 2 • P 1 to P 2 • Q 1 to Q 2

Shifts in Demand Example 1: tickets to a concert for a popular musician or band. As the band has more success, and gets more popular with fans, what happens to the price of a concert ticket? • Describe shifts • Stronger tastes and preferences. • Demand shifts to the right. • If prices do not increase, there will be a shortage

Shifts in Demand 1. When demand for a good or service increases, the equilibrium price and the equilibrium quantity both rise 2. When demand for a good or service decreases, the equilibrium price and the equilibrium quantity both decrease In real life, it is difficult to predict changes in demand • Why do you think that is?

Shifts in Supply 1. When supply of a good or service decreases, the equilibrium price of that good or service rises and the equilibrium quantity falls 2. When supply of a good or service increases, the equilibrium price of that good or service falls and the equilibrium quantity rises It is easier to predict changes in supply, why? • Physical factors that affect supply can be measured • IE Availability of inputs

Simultaneous Shifts in Supply and Demand Curves

Simultaneous Shifts in Supply and Demand Curves Demand Supply move in opposite directions. • When demand increases and supply decreases, the equilibrium price rises but the change in the equilibrium quantity is ambiguous. • When demand decreases and supply increases, the equilibrium price falls but the change in the equilibrium quantity is ambiguous

Simultaneous Shifts in Supply and Demand Curves Demand Supply move in opposite directions. • When demand increases and supply decreases, the equilibrium price rises but the change in the equilibrium quantity is ambiguous. • When demand decreases and supply increases, the equilibrium price falls but the change in the equilibrium quantity is ambiguous

Simultaneous Shifts in Supply and Demand Curves Example: Suppose the price of cheeseburgers is rising. In addition, the price of pepperoni is rising. How will these two events affect the market for pizza? Demand shift: • The price of a substitute is rising (cheeseburgers). • This shifts demand for pizza to the right. • Price and quantity of pizza both increase. Supply shift: • The price of an input is rising (pepperoni). • Supply of pizza shifts to the left. • Price increases, and quantity decreases Both shifts generate an increase in the price, so we can certainly predict a higher price of pizza. However the change in quantity depends on which of the two shifts is stronger.

Simultaneous Shifts in Supply and Demand Curves Demand Supply move in the same direction. • When both demand supply increase, the equilibrium quantity increases but the change in equilibrium price is ambiguous. • When both demand supply decrease, the equilibrium quantity decreases but the change in equilibrium price is ambiguous.

Simultaneous Shifts in Supply and Demand Curves Example: The recent Winter Olympics has increased the popularity of snowboarding and more companies have begun producing snowboards. How will these events affect the market for snowboards? Demand shift: • Tastes and preferences are stronger for snowboarding. • This shifts demand for snowboards to the right. • Price and quantity of snowboards both increase. Supply shift: • More suppliers are producing snowboards. • Supply of snowboards shifts to the right. • Price decreases, and quantity increases. • Both shifts generate an increase in the quantity, so we can certainly predict a higher equilibrium quantity of snowboards. However the change in price depends on which of the two shifts is stronger.

Simultaneous Shifts in Supply and Demand Curves
 Cause the ______ to ______ Price ______ Gasoline The price")
The Market for: Shifter(s) Cause the ______ to ______ Price ______ Gasoline The price of crude oil increases Supply to fall Increases Salsa New fertilizer increases plants per acre Quantity ____ Decreases

PRICE CONTROLS Module 8

Recap Competitive markets move back to natural price levels • Do all buyers and sellers get satisfied? • Buyers always want to pay less • Sellers always want a higher price What would be some reasons that outside intervention take place to control prices? • Social concerns • Moral concerns • Political reasons

Example 1 New York City is one of the most expensive cities to live in the in US. Can the average worker live comfortably in the city? • Look at supply and demand of apartments; somewhat limited supply, very high demand: how does this look on a Supply and Demand graph? • Leads to higher prices (rent) Should any thing be done? Can anything be done? • Gov’t can impose rent control; not allowing landlords to increase prices above an “affordable” level

Example 2 Labor market; what if the supply and demand for less skilled workers leads to wage rates that yield income below the poverty level? • Should anything be done? • State or federal governments may create a law that states a wage that is no lower that a stated amount – “minimum wage”

Price Controls are legal restrictions on how high or low a market price may go. • There are two forms of price control 1. Price Ceilings 2. Price Floors

Price Ceilings • Price Ceiling; maximum price sellers are allowed to charge for a good or service • Not seen very often in widespread use; typically only used during crisis • Wars, harvest failures, natural disasters

Price Ceilings

Price Ceilings

Price Ceilings

Price Ceilings

Price Ceilings Historical Examples: • 1940 s; Aluminum and steel prices during WWII • Rent control in NYC • A result of WWII, sudden economic boom created a sharp increase in the demand of NYC housing • Resources were being used for the war effort, not to make buildings so supply was somewhat fixed • 1973; OPEC Oil Embargo • Long lines at the gas pump (customers waited hours to fill up) • 2001; California controlled the price of electricity • Shortage led to higher prices and profits for companies • Controls led to rolling blackouts • 2005, Hawaii controlled the price of gasoline to stop “gouging” of customers – proved ineffective and were removed

Price Ceilings Do price ceilings always cause a shortage? • If No, why? • The ceiling price level can be placed above equilibrium

Results of Price Ceilings 1. Inefficient Allocation to Consumers: Price Ceilings lead to Inefficient Allocation to Consumers; people who want the good badly and are will to pay more to get it don’t get it, and those who care relatively little about the good and are only willing to pay a relatively low price do get it.

Example To see the inefficiency involved, consider the plight of the Lees, a family with young children who have no alternative housing and would be willing to pay up to $1, 500 for an apartment—but are unable to find one. Also consider George, a retiree who lives most of the year in Florida but still has a lease on the New York apartment he moved into 40 years ago. George pays $800 per month for this apartment, but if the rent were even slightly more—say, $850—he would give it up and stay with his children when he is in New York. This allocation of apartments—George has one and the Lees do not—is a missed opportunity: there is a way to make the Lees and George both better off at no additional cost. The Lees would be happy to pay George, say, $1, 200 a month to sublease his apartment, which he would happily accept since the apartment is worth no more than $849 a month to him. George would prefer the money he gets from the Lees to keeping his apartment; the Lees would prefer to have the apartment rather than the money. So both would be made better off by this transaction—and nobody else would be made worse off. NOTE: Subletting is illegal because prices would occur above the ceiling

Results of Price Ceilings 2. Wasted Resources Price ceilings created Wasted resources; expended money, effort, and time used dealing with shortages • Increased opportunity costs • Look at the time spent in line waiting for gas during the oil embargo in the 1970 s 3. Inefficiently Low Quality Price ceilings cause Inefficiently Low Quality; Sellers will offer low-quality goods at a low price even thought buyers would rather have higher quality and are will to pay a higher price for it 4. Black Markets Price ceilings create incentives to provide illegal activities, the emergence of black markets; is a market where goods and services are bought and sold illegally

Price Ceilings So why are there price ceilings? Especially given the unpleasant consequences? • • • Persistent shortages Inefficiency in low quantity Inefficient allocation of goods and services Waste of resources Inefficiency of goods and services in the form or low quality Black markets • They do benefit some people • Ceilings that have been in place a longtime have skewed consumers perception of the real price • Gov’t officials do not understand supply and demand analysis; politics take over

Price Floors; minimum price buyers are required to pay for a good or service • Widely used for agricultural goods • Used to support the incomes of farmers • Also used in trucking services and air travel prior to the 1970 s • Intended to help people, but have undesirable effects. What is the most commonly referred to price floor? • Minimum wage; a legal floor on the wage rate, which is the market price of labor

Price Floors

Price Floors

Price Floors

Price Floors

Price Floors Do price floors always cause a surplus? • No, why? • The floor price level can be placed below equilibrium In the case of crops, the gov’t has at times bought up surpluses • European Commission had something called “Butter Mountain, ” stores of butter equal to the weight of the entire population of Austria • Gov’t stores corn, butter, cheese, etc. in large warehouses, must find ways to dispose of unwanted goods • The EU will pay exporters to sell excess products at a loss over seas • The US will surplus foods to school lunch programs • In some cases, food is simply destroyed • To avoid this the US gov’t will pay producers NOT to grow crops • Cannot rely upon gov’t to buy surpluses

Results of Price Floors 1. Inefficiently Low Quantity Reduces the quantity demanded, less is bought and sold 2. Inefficient Allocation of Sales Among Sellers; those who would be willing to sell the good at the lowest price are not always those who manage to sell it. • Look at minimum wage; there are those who cannot find a job because of the shortage that would be willing to accept less pay in order to work; meanwhile there are those who are employed and may not be working hard for it 3. Wasted Resources Look at the gov’t purchasing unwanted surpluses of crops

Results of Price Floors 4. Inefficiently High Quality Sellers offer high-quality goods at a high price even though buyer would prefer a lower quality at a lower price • High quality is desirable only if it is worth the costs • Some consumers would be willing for lower quality at a lower price • This is a missed opportunity cost EXAMPLE: Airline industry, pre 1970 s deregulation • High-prices, lavish meals that would go uneaten • After deregulation, lower airfare, reduction in services, easy/cheaper to travel • Air travel has grown several hundred percent 5. Illegal Activity Under the table wages

Price Floors So why are there price floors? Especially given the unpleasant consequences? • • • Inefficiently Low Quantity Inefficient Allocation of Sales Among Sellers Wasted Resources Inefficiently High Quality Illegal Activity • Again, gov’t officials do not understand supply and demand models • Benefits some influential buyers or influential sellers (political reasons)

SUPPLY AND DEMAND QUANTITY CONTROLS Module 9

Example 1 In the 1930 s, New York City instituted a system of licensing for taxicabs: only taxis with a “medallion” were allowed to pick up passengers. Because this system was intended to ensure quality, medallion owners were supposed to maintain certain standards, including safety and cleanliness. A total of 11, 787 medallions were issued, with taxi owners paying $10 for each medallion. In 1995, there were still only 11, 787 licensed taxicabs in New York, even though the city had meanwhile become the financial capital of the world, a place where hundreds of thousands of people in a hurry tried to hail a cab every day. (An additional 400 medallions were issued in 1995, and after several rounds of sales of additional medallions, today there are 13, 257 medallions. ) The result of this restriction on the number of taxis was that a New York City taxi medallion became very valuable: if you wanted to operate a taxi in New York, you had to lease a medallion from someone else or buy one for a going price of several hundred thousand dollars.

Quantity Controls This story is an example of quantity controls, or quotas; an upper limit on the quantity of some good or service that can be bought or sold • Gov't places quota limits through licenses, the right to legally supply the good • Other examples of quantity controls: • Boston, San Francisco and taxis • Foreign currency • Fishing limits Some quotas are place with good economic intentions, some bad • Address temporary problems • Usually hard to remove the quota due to politics • Beneficiaries do not want the abolished

Quantity Control

Quantity Control

Quantity Control But how can the price received by taxi drivers be $4 when the price paid by taxi riders is $6? • The answer is that in addition to the market in taxi rides, there is also a market in medallions. Medallion-holders may not always want to drive their taxis: they may be ill or on vacation • Those who do not want to drive their own taxis will sell the right to use the medallion to someone else So we need to consider two sets of transactions here, and so two prices: • The transactions in taxi rides and the price at which these will occur • The transactions in medallions and the price at which these will occur. It turns out that since we are looking at two markets, the $4 and $6 prices will both be right.

Quantity Control

Quantity Control In every case in which the supply of a good is legally restricted, there is a wedge between the demand price of the quantity transacted and the supply price of the quantity transacted. • A Wedge is he price paid by buyers ends up being higher than that received by sellers • The wedge is represented in figure 9. 2 also called a quota rent; the earnings that accrue to the license-holder from ownership of the right to sell the good. It is equal to the market price of the license when the licenses are traded.

Quantity Control This shows quota rent in the market for New York taxi rides. • The quota limits the quantity of rides to 8 million per year, a quantity at which the demand price of $6 exceeds the supply price of $4. • The wedge between these two prices, $2, is the quota rent that results from the restrictions placed on the quantity of taxi rides in this market

Quantity Control What if Sunil doesn’t rent out his medallion? What if he uses it himself? Doesn’t this mean that he gets a price of $6? No, not really. • Even if Sunil doesn’t rent out his medallion, he could have rented it out, which means that the medallion has an opportunity cost of $2 • The cost of not renting out the medallion • Sunil is in two businesses, the business of taxi driving and the medallion renting business

Side Effects of Quantity Controls 1. Inefficiencies due to missed opportunities Mutually beneficial exchanges are kept from occurring • In this example, New Yorkers would be more willing to pay got a taxi ride for additional available rides Deadweight Loss Occurs; the lost gains associated with transactions that due not occur due to market intervention • The triangle represents the missed gains from taxi rides prevented by the quota, a loss that is experienced by both disappointed would-be riders and frustrated would-be drivers 2. Increase in unlicensed activities Because there are transactions that people would like to make but are not allowed to, quantity controls generate an incentive to evade them or even to break the law

Quantity Control Deadweight Loss Occurs; the lost gains associated with transactions that due not occur due to market intervention • The triangle represents the missed gains from taxi rides prevented by the quota, a loss that is experienced by both disappointed would-be riders and frustrated wouldbe driver

Example Suppose we consider the market for ocean caught salmon. Assume that equilibrium: • Qe =50 • Pe =$60 Suppose the salmon are becoming gravely endangered: Quota = 40 • Licenses are allocated, each giving the salmon boat the right to harvest a certain amount of salmon every year. When the total quota limit is reached the season is over.

Example The demand price Pd is the price at which consumers will demand that quantity. The supply price Ps is the price at which producers will supply that quantity. • A quantity control, or quota, drives a wedge between the demand price and the supply price of a good. • Suppose at the quota of 40: • Demand Price = $80 • Supply Price = $50 If buyers are willing to pay $80, but sellers can produce at cost of $50, each owner of a license to fish salmon earns the difference of $30. And this is the amount that any salmon boat would pay to have a license.
- Slides: 102