SECTION 2 4 GRAPHS THAT ENLIGHTEN AND GRAPHS


")
 data by separating each value into")


 has not been plotted correctly.")


- Slides: 30
SECTION 2. 4 GRAPHS THAT ENLIGHTEN AND GRAPHS THAT DECEIVE
NEW GRAPH STYLES Pareto Graph Scatter Plots Dot Plots Stem Plots Pie Charts Ogive
PARETO CHARTS A bar graph where the bars are arranged in decreasing order.
PARETO CHARTS
SCATTERPLOTS A graph made by plotting ordered pairs.
SCATTERPLOTS
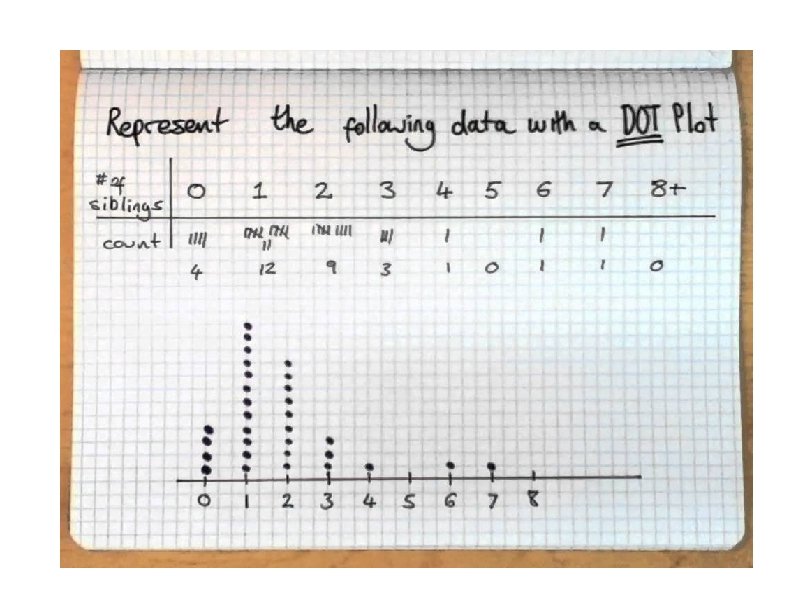
DOTPLOTS A graph in which each data value is plotted as a point (dot) along a horizontal scale of values.
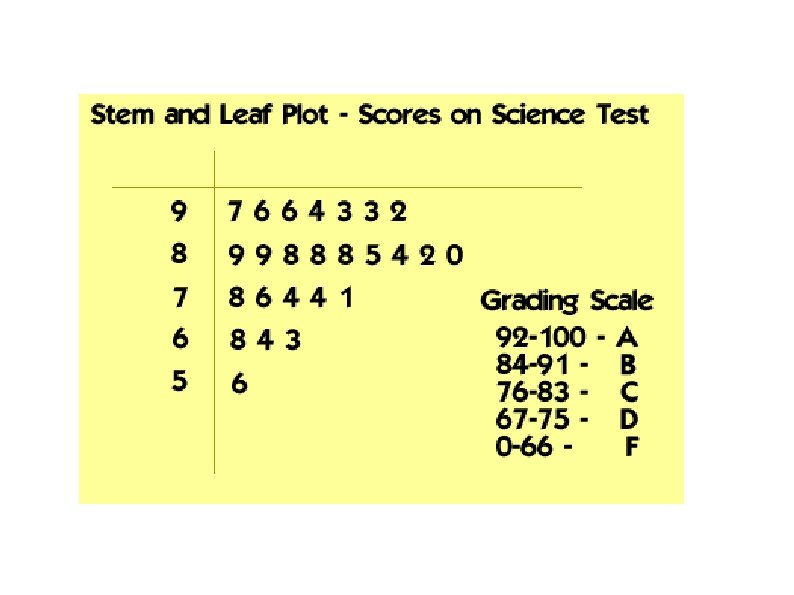
STEMPLOTS Stemplot AKA stem-and-leaf plot Represents quantitative (continuous) data by separating each value into two parts: Stem - the left most digit Leaf - the right most digit
EXAMPLE Draw a stem plot given the data list 24, 52, 24, 50, 25, 26, 27, 32, 36, 27, 31, 48, 41, 31, 28, 36, 43, 32, 41, 45, 36
PIE CHARTS A graph that depicts categorical data as slices of circles, in which the size of each slice is proportional to the frequency.
PIE CHARTS
OGIVE Uses connected dots to depict the cumulative frequencies.
OGIVE
CREATE an OGIVE
GRAPHS THAT ENLIGHTEN Graphs that give a true understanding of the data.
GRAPHS THAT DECIEVE Graphs that mislead or contain errors.
To correctly interpret a graph, you must analyze the numerical information given in the graph, so as not to be misled by the graph’s shape. READ labels and units on the axes!
BAR GRAPH
Is This a Misleading Graph?
Note that the value for November (8. 6) has not been plotted correctly. It’s placed at the 9. 0 position. It’s been plotted to look like there’s a steep incline when in fact, the overall employment trend is pretty stable at around 9%.
WHAT IT SHOULD LOOL LIKE
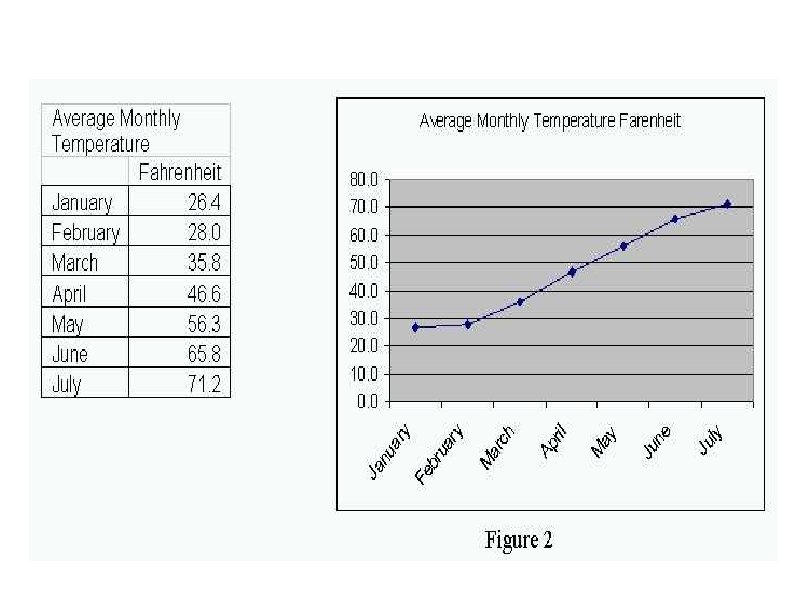
WHAT IS WRONG WITH IT Only shows the first have of the year, when temperatures are always increasing.
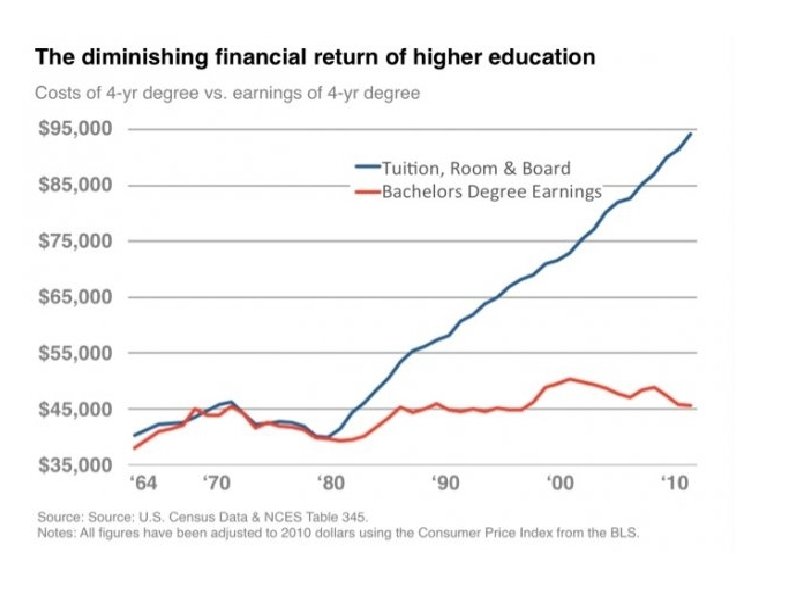
WHAT IS WRONG WITH IT? The scale on this chart is fine. What Business Insider deduced from the chart is not. Have we “We have lost the ubiquitous positive financial return on education”? No. David Blake read the chart without taking into account a key fact that wasn’t on the chart: the cost of not going to college has diminished even more. Than means, your prospects as a high school graduate are a lot worse than your prospects as a college graduate.
WHAT IS WRONG WITH IT? Another key piece of information is Note the average yearly income a college grad can expect is about $45, 000 in 2010. That’s per year. Over an average working lifetime (say, 43 years assuming retirement at age 65), that gives you an income of $45, 000 * 43 = $1, 935, 000.
WHAT IS WRONG WITH IT? Another key piece of information is Subtract that expensive college education ($95, 000) and your net earnings are $1, 840, 000. Compare that to your average high school grad. They can expect to earn $1, 300, 000 over their lifetime (Source: The U. S. Department of Education). That’s quite a difference