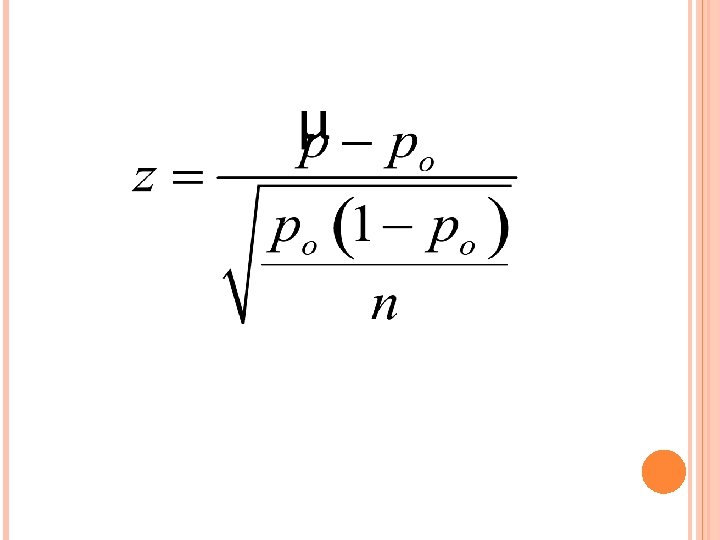
SECTION 12 2 TESTS ABOUT A POPULATION PROPORTION

SECTION 12. 2 TESTS ABOUT A POPULATION PROPORTION

Ho is True Ho is False Reject Ho Type I error Correct Fail to Reject Ho Correct Type II error Power: The ability to reject Ho when it is false


Ex: A basketball player usually makes 53. 3% of his freethrows. In the offseason, the player works on his shot and made 26 out of 39 free throws. a) Do these results provide evidence the player has significantly improved his free throw shooting. Justify your answer with appropriate evidence b) Describe a Type I error and Type II error in this situation c) Suppose the player actually improves his free throw percentage to 60%. What is the probability that you will correctly reject the claim that p=0. 533? Use a 5% significance level. d) Find the probability of a Type I error and Type II error

Gather Information: State the Null and Alternative Hypothesis: Note: “p” is the players free throw percentage during the offseason training Find the P-Value Find the test statistic “z” Yes, with a P-value less than 0. 05, we would say that the increase would not have happened by chance
 Type I Error: Concluding that the player has improved his free throw shot")
b) Type I Error: Concluding that the player has improved his free throw shot when in fact he has not Type II Error: Concluding that the player has not improved his free throw shot when in fact he has C) Find the Power at the 5% significance level: P=0. 60 P=0. 533 The Power is 0. 2058. The Probability That we will correctly reject Ho at the 5% significance level is around 20. 58%

P=0. 60 P=0. 533 The probability of a Type I Error is the significance level � at 5% (Rejecting Ho when it is true) The probability of a Type II Error is the complement of Power (Failing to Reject Ho when is is false)

Each of 50 subjects tastes two unmarked cups of coffee and says which he or she prefers. One cup in each pair contains instant coffee; the other, fresh brewed coffee. 31 of the subjects prefer fresh brewed coffee. Take “p” to be the proportion of the population who would prefer fresh brewed coffee in a blind tasting test a) Test he claim that a majority of people prefer the taste of fresh brewed coffee. Is your result significant at the 5% level What is your practical conclusion? b) Find a 90% confidence interval for “p” C) When you do an experiment like this, in what order should you present the two cups of coffee to the subjects?
 What are your Null/Alternative Hypothesis? We are testing against the Null Hypothesis that")
I) What are your Null/Alternative Hypothesis? We are testing against the Null Hypothesis that there is no change. That Fresh Brewed Coffee makes “NO difference” “p” the proportion of people that like fresh brewed coffee II) Check and Verify that the Conditions for Significance test are met: Normality Independence SRS: It is safe to assume that the preference of each taste tester is independent of one another It hasn’t indicated that sample is SRS, but we will assume that all testers are from SRS

Gather Information: Find the test statistic “z” Find the P-Value Yes, with a P-value less than 0. 05, we would reject Ho at the 5% level and conclude that a majority of people prefer the teste of fresh brewed coffee
 A 90% CI for ‘p” is: We are 90% confident that between 50.")
b) A 90% CI for ‘p” is: We are 90% confident that between 50. 71% to 73. 3% of coffee drinkers prefer freshbrewed coffee C) IF this is an experiment, the coffee should be presented in random order. Some taste testers should receive the instant coffee first and others should get the fresh-brewed coffee first
- Slides: 23