Section 10 2 Tests of Significance Hypothesis Testing


 says that there is no effect")


 find p-values.")

 probability that our sample statistic of (sample")


 calculated a")
- Slides: 29
Section 10. 2: Tests of Significance Hypothesis Testing n n n Null and Alternative Hypothesis P-value Statistically Significant
Goal of Tests of Significance To access the evidence provided by data about some claim concerning a population.
Coin Flipping Example n On a scrap paper record the results of my coin flips.
Why did you doubt my truthfulness? n n Because the outcome of the coin flipping experiment is very unlikely. How unlikely? n (. 5)^k, where k is the number of flips before you yelled.
Suppose I claim to consistently make 80% of my volleyball serves. n n n Not sure if you believe me, you hand me a ball and ask me to serve 20 balls. I make 8 out of those 20 serves. “Aha, ” you say. “Someone who makes 80% of their serves would hardly ever only make 8 out of 20 shots, so I don’t believe your claim!”
Significance Test Procedure STEP 1: Define the population and parameter of interest. State the null and alternative hypotheses in words and symbols. Population: My free throw shots Parameter of interest: Proportion of shots made Suppose I am an 80% free throw shooter. This is a hypothesis and we think it is false. We will call it the null hypothesis and use the symbol H 0 (pronounced H - nought). H 0 : p = 0. 8 You are trying to show that I am worse than an 80% shooter. Your alternate hypothesis is: Ha : p <. 08 6
Significance Test Procedure STEP 2: Choose the appropriate inference procedure. Verify the conditions for using the selected procedure. We are going to use the Binomial Distribution Each trial has either a success or a failure There is a set number of trials Trials are independent The probability of a success is constant 7
Significance Test Procedure n n STEP 3: Calculate the P-value. The Pvalue is the probability that our sample statistic is that extreme assuming that H 0 is true. Look at Ha to calculate “What is the probability of making 8 or fewer shots out of 20? ” n Binomcdf ( 20, . 8, 8) =. 000102 8
Significance Test Procedure STEP 4: Interpret the results in the context of the problem. n n You reject H 0 because the probability of being an 80% shooter and making only 8 out of 20 shots is extremely low. You conclude that Ha is correct; the true proportion is < 80% There are only two possibilities at this step: You reject H 0 because the probability is so low. We accept Ha You fail to reject H 0 because the probability is not low enough 9
Basic Idea Behind Significance Tests An outcome that would rarely happen if a claim were true is good evidence that the claim is not true.
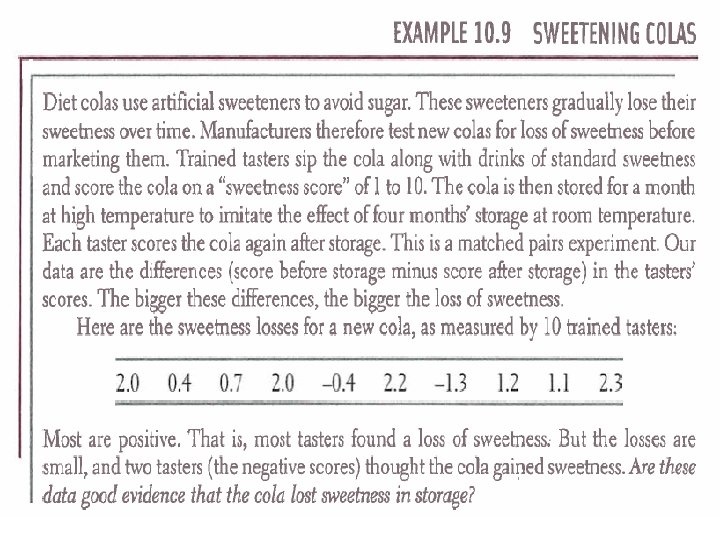
Situation Read and summarize the situation given in: EXAMPLE 10. 9, pg 560.
Situation Summary Matched Pairs Experiment Design. Data: “Sweetness Before” score – “Sweetness after” score 2. 0 0. 4 0. 7 -0. 4 2. 2 -1. 3 1. 2 1. 1 2. 3 Is this good evidence that the cola lost sweetness in storage?
Situation Continued n n = 1. 02 What is the meaning of: • • • a positive mean? a negative mean? a mean equal to 0?
Test of Significance n We don’t know how conclusive or significant our results are. We must perform a significance test that asks the following questions: n Does our reflect a real sweetness loss? n Could we easily get our by chance?
Step 1: Identify the Parameter We are trying to identify the mean µ loss in sweetness for the population. Population = diet soda Parameter = mean loss of sweetness Note: we are always trying to draw conclusions about a parameter of a population, so we must always be stating tests in terms of the parameter.
Step 2: State The Null Hypothesis (H 0) says that there is no effect or change in the population. If H 0 is true, then the sample result is just chance at work. In our situation, the null hypothesis would be that the cola (population) does not lose sweetness. Written: H 0 : µ = 0
Step 3: State the Alternative Hypothesis The effect we suspect is true, the alternative to “no effect” or “no change” is described by the Alternative Hypothesis (Ha) In our situation, the alternative hypothesis is that the cola does lose sweetness. Written: H a: µ > 0
Significant Test Reasoning If H 0 is true, how surprising is our outcome of ? If the outcome is surprisingly large, then that is evidence against H 0 and for Ha
Sampling Distribution of if H 0 is true. Central Limit Theorem would dictate that the sampling distribution would be In our situation, the sampling distribution of x-bar would be N(0, 0. 316). Assuming we know the population = 1
Calculate P-Value If H 0 is true, calculate the probability that one would get an outcome of 1. 02. This probability is called the p-value. Standardize 1. 02 if N(0, . 316), then use Table A.
P-Value Definition The probability, assuming H 0 is true, that the test statistic would take a value as extreme or more extreme than that actually observed is called the p-value. The smaller the p-value, the stronger the evidence against H 0.
REMEMBER ! ! ! n n n Hypothesis tests (or Significance Tests) find p-values. P-values describe how probable the NULL HYPOTHESIS is based on the sample statistic. WE ARE ALWAYS TESTING WHETHER THE NULL HYPOTHESIS IS PROBABLE OR NOT!
Check for Understanding A hypothesis test was calculated. Answer whethere is significant evidence to reject the H 0 and accept the Ha. n n n P-value P-value = = = . 45. 03. 99. 10. 11 P-value =. 0001 P-value =. 21 P-value = 4. 2341 E-12
Writing Your Conclusion There is a (p-value) probability that our sample statistic of (sample mean or proportion) would occur if the Null Hypothesis were true and the population parameter was (pop. Mean or prop). This suggests that Null hypothesis is (likely, somewhat likely, not likely). If not likely, then describe the alternative hyp. As more likely.
Statistically Significant n n To describe how significant the evidence against the H 0 is, we establish a significance level ( ). If the p-value is as small or smaller than the established , we say the evidence to reject the H 0 is statistically significant at the -level.
Statistical Significance The smaller the significance level, the more evidence against the H 0 (or the more likely the Ha). Significance does not mean “important”; it means that the outcome is not likely to occur just by chance.
Check for Understanding If the following p-values were calculated, state whethere is statistically significant evidence against the H 0 at the 0. 10, 0. 05, or 0. 01 level. n n n P-value P-value = = = . 45. 03. 99. 10. 11 P-value =. 0001 P-value =. 21 P-value = 4. 2341 E-12
Summary n n n We We stated a null hypothesis (no loss) calculated a test statistic. stated alternative hypothesis. found the probability of getting the test statistic if H 0 was true. (p-value) Since p-value was very low, it was statistically significant evidence that the null hypothesis was false and the alternative true.