SECTION 10 1 ESTIMATING WITH CONFIDENCE CONFIDENCE INTERVALS


 for x is approximately")


")


 Step 1: Indicate the")
 To determine the sample size n that will yield")

- Slides: 16
SECTION 10. 1 ESTIMATING WITH CONFIDENCE & CONFIDENCE INTERVALS
MAIN IDEAS: The purpose of this chapter is to create a “confidence interval” (C. I. ) CI – a range of values with the goal of capturing the true population mean (parameter) When we want a 95% C. I. we are saying that the method we used for creating this interval will capture the pop. mean 95% of the time If we increase the percentage confidence, the range gets bigger: 10. 1 “based on mean and SD” 10. 2 “use t-distr” When we don’t have pop SD 10. 3 “based on Proportion
UNDERSTANDING CONFIDENCE INTERVAL Margin of Error Suppose this distribution illustrates To have a 95% confidence, we create a the IQ score of all students in Moscrop margin of error that is 2 σ from the µx So 95% of all the samples This is the true population mean will have a confidence When I take a sample, I aim to interval that will capture the As we take repeated samples, we are capture the true population mean confident that 95% of the resulting Due to Sampling variation, the sample confidence will capture µ mean will vary. To have a bigger confidence of capturing µ, set a larger margin of error
STEPS IN CREATING A CONFIDENCE INTERVAL Step 1: We take a sample, use the mean of that sample as the center of our confidence interval We create a margin of error using the z-score and population standard deviation given to us The margin of error is defined as: Bigger z value Bigger SD value Bigger Margin of Error Bigger sample size Smaller Margin of Error Concluding sentence: Our 95% C. I is between [a, b]. In context, we are confident that the method if repeatedly used with sample size “n” will capture the true population mean 95% of the time Bigger Margin of Error
FINDING Z-VALUE FOR CONFIDENCE INTERVAL A 68% CI, means that each tail is 16%, so your range will be x plus or minus one SD A 95% CI, has 2. 5% in each tail and your range will be x plus or minus two SD A 99. 7% CI, your range will be x plus or minus three SD A z-score table can be used to find Z*. Be mindful that a 90% confidence has two tails, each tail will be 5% Using a Ti-83 is the easiest! Just plug in the tail area for Z*
ESTIMATING WITH CONFIDENCE INTERVAL: The sampling model (aka: sampling distribution) for x is approximately ¯ normal according to the Central Limit thm Mean of the sampling model is µ because x is an unbiased estimator ¯ of the population mean Since the population size is at least 10 times the sample size, the standard deviation of the sampling distribution of x will be: ¯ Note: In this section, we pretend the population sd (σ) is always known. In the real world, σ is unknown. Using the Empirical rule of 68, 95, 99. 7, we know that 95% of a normal distribution is within 2σ of the mean We can construct a confidence interval that 95% of all sample means will be between: 95% Confidence Interval Margin of Error
EX: SUPPOSE I WANT TO KNOW THE MEAN IQ SCORES OF ALL STUDENTS IN MOSCROP SECONDARY (N=1500). I TOOK A SAMPLE OF 50 STUDENTS AND GOT A SAMPLE MEAN X =105. IF THE POPULATION STANDARD DEVIATION IS 5. 5, CREATE A 95% CONFIDENCE INTERVAL FOR THE PARAMETER. This value is “ 2” because 95% of the area in a standard normal curve is within 2 standard deviations of the mean. Our 95% confidence interval is between 103. 44 to 106. 56 If we use the Z-table or Ti-83 (Inv. Norm), the z-value actual value should be 1. 960. Conclusion: If we repeatedly took a sample size of 50, we are 95% confident that our samples will capture the IQ scores of all Moscrop Students
We are given the average cost to be $47. 52, so µx = $47. 52 The parameter σ (SD) is $1. 59 with a sample size n=10, so We want a 98% CI, so find the z-value Answer: “B”
HOW TO SET A C% CONFIDENCE INTERVAL A confidence level of “C”% (ie 95%) gives the probability that the interval will capture the true parameter value µ in repeated samples. Another way of saying this is that we would expect C % of all confidence intervals to capture the true parameter value µ A level C confidence interval for a parameter is given by: Sample Mean µx The Margin of Error depends on the desired confidence level C and the shape of the distribution Conditions: Data must be from a SRS from the population The sample distribution of x is approximately normal: ¯ Population is normally distributed OR Central Limit Theorem (n>30)
Since the distribution of x is approximately normal, we can use the ¯ middle area of the curve to construct a confidence interval Depending on the level of confidence, we can use the area of the tail to determine the z-score for the margin of error The Z-values are denoted by: ±z* z* is called the “Upper p critical value” with probability p lying to its Suppose we want a 90% C. I. right under the standard normal curve The area on the tail will be 5% each Likewise, if we want a 95% C. I. , Using the area of 5% we can find the area on the tail will be 2. 5% each corresponding z-value that The Confidence Interval will be:
CONFIDENCE INTERVAL FOR THE MEAN: Conditions for using the general formula of C. I. for a population mean µ : ¯ 1. x must be from a Simple Random Sample 2. The sample size “n” must be at least 30 3. Population must have an unknown mean and KNOWN standard deviation σ. A level C % confidence interval for µ is given by the formula: The margin of error only covers random sampling errors Things like under-coverage, non-response, poor sampling designs can cause additional errors
Ex: The following data is obtained from an SRS from a normal population. Construct 95% confidence intervals for µ given that σ= 3 and. Input the values into L 1 Do a Z interval test on your Ti-83 Press: Choose “Data” if using values from L 1. Indicate the C-Level: 95% Calculate STAT TESTS Indicate the C. I.
INFERENCE PROCEDURE FOR LEVEL C CONFIDENCE INTERVAL FOR (WITH KNOWN) Step 1: Indicate the parameter of Interest: µ (the true mean of the population of interest) Step 2: Verify that the conditions for using a C. I. are met Check that the data is from a normal population or that the sampling ¯ model of x is approximately normal. (n>30). The data must have been generated by an SRS. The σ is known Step 3: If the conditions are met, then calculate the Level C confidence interval : Step 4: Interpret the results in the context of the problem: We are C% confident that the true population mean is between
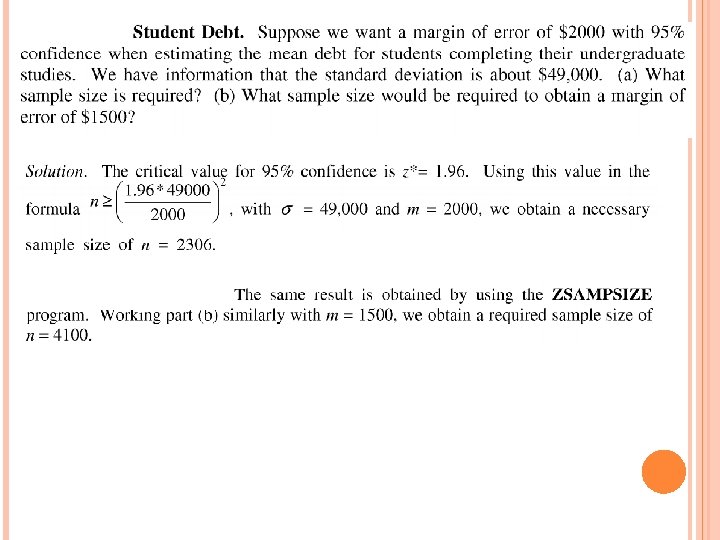
CHOOSING A SAMPLE SIZE (n) To determine the sample size n that will yield a confidence interval for a population mean with a specific margin of error “m”, set the expression for the margin of error to less than or equal to “m” and solve for sample size “n” Isolate “n” to find the desired Sample Size Margin of Error This sample size “n” must be this large in order to have a margin of error less than or equal to “m”
Ex: To assess the accuracy of a laboratory scale, a standard weight known to weigh 10 grams is weighted repeatedly. The scale readings are normally distributed with unknown mean (this mean is 10 grams if the scale has no bias). The standard deviation of the scale reading is known to be 0. 0002 gram. a) The weight is weighed five times. The mean result is 10. 0023 g. Construct a 98% C. I. for the mean of repeated measurements of the weight b) How many measurements must be averaged to get a margin of error of ± 0. 0001 with 98% confidence? Show your work