Second Exam One week from this coming Thursday


")


 Assumptions: a) Environmental")
 deciding where to search 2)")
 deciding where to search 2)")
 Clearly, an optimal consumer should forage")
 utilization coefficients and electivities Resource State 1 2")

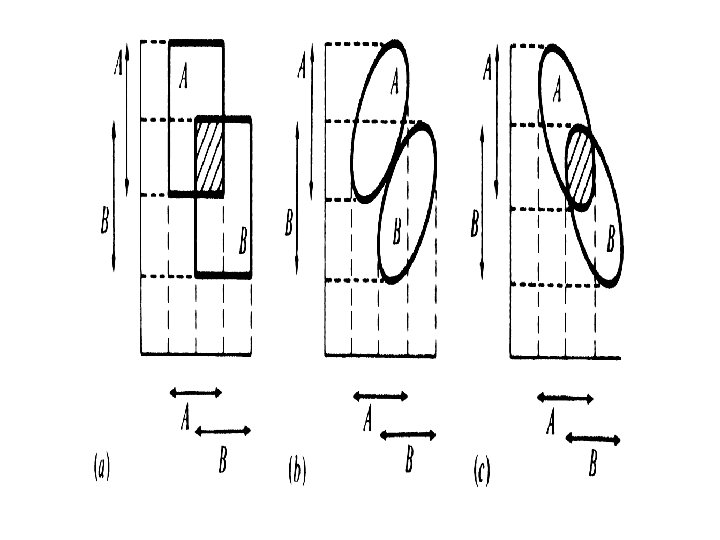


 Disjunct, Abutting, Overlapping, Included Niches Niche overlap")

 changes in either A")


")


 Principal Components Analysis Reduces dimensionality (correlated data) Changes coordinate")


- Slides: 45
Second Exam One week from this coming Thursday Chapters 10, 11, 12, 13, 14, and 15 Can humans share spaceship earth? Why Can't We Humans Share Spaceship Earth? The Vanishing Book of Life on Earth Watch Average Temperatures 1884 -2012 Global Warming Watch Domino Effects Intelligent Design? Space Travel Agriculture Economics Handouts 5, 6, and 7
~ ~ Kc = 160 Kb = 125 Nc* = 70 Nb* = 30 Nc* = Kc – acb Nb* acb = (Kc – Nc*)/ Nb* = (160 – 70)/30 = 90/30 = 3. 00 Nb* = Kb – abc Nc* abc = (Kb – Nb*)/ Nc* = (125 – 30)/70 = 95/70 = 1. 357
Diffuse competition: Ni* = Ki – ij Nj Alpha matrices, N and K vectors Matrix Algebra Notation: N = K – AN Partial derivatives, ∂Ni/∂Nj sensitivity of species i to changes in j Jacobian matrix (community matrices), Lyapunov stability Evidence for competition in nature Resource partitioning among sympatric congeneric pairs Resource Matrices, food, place, time niche dimensions Complementarity of niche dimensions Galápagos finches, beak depth, seed size Character displacement Hydrobia mud snails Hutchinsonian ratios, Limiting similarity Corixids, musical instruments, knives, pots, trikes, bikes Accipter hawks, monitor lizards
The ecological niche, function of a species in the community Resource utilization functions (RUFs) Competitive communities in equilibrium with their resources Hutchinson’s n-dimensional hypervolume concept Fundamental and Realized Niches Niche Breadth Niche Overlap
Robert H. Mac. Arthur Geographical Ecology Range of Available Resources Average Niche Breadth Niche Overlap
Mac. Arthur, R. H. 1970. Species packing and competitive equilibrium for many species. Theoret. Population Biol. 1: 1 -11. Rate of Resource Species Packing, one dimension Resource Utilization Functions = RUFs
Species Packing , one dimension, two neighbors in niche space Three generalized abundant species with broad niche breadths Nine specialized less abundant species with narrow niche breadths
Niche Breadth Jack of all trades is a master of none Robert H. Mac. Arthur & Levin’s Theory of Limiting Similarity Richard Levins Phenotype Specialists are favored when resources are very different
Niche Breadth Jack of all trades is a master of none Robert H. Mac. Arthur & Levin’s Theory of Limiting Similarity Richard Levins Phenotype Generalists are favored when resources are more similar
Niche Dimensionality 1 D = ~ 2 Neighbors 2 D = ~ 6 Neighbors 3 D = ~ 12 Neighbors 4 D = ~ 20 Neighbors NN = D + D 2 Diffuse Competition d. Ni/dt = ri. Ni(Ki -Ni - ij Nj) d. Ni/dt = 0 when Ni = Ki - ij Nj
Niche Overlap Hypothesis
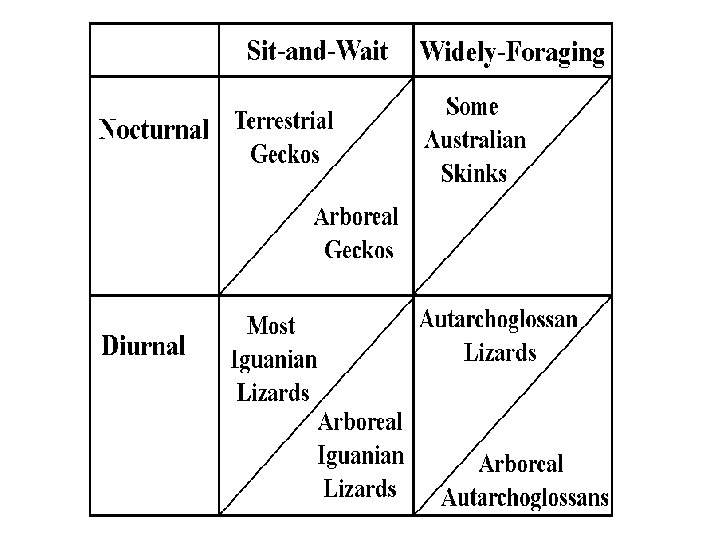
Foraging Tactics and Feeding Efficiency Costs and Profits of Foraging An optimal foraging tactic maximizes the difference between foraging profits and their costs (net benefit) Food = matter and energy for maintenance and reproduction Hazards: exposure to predators, loss of time for other activities Sit-and-Wait ambush predators (e. g. spiders at webs) Widely foraging active hunters (go out and find prey) Search Time (per item eaten) versus Pursuit Time (per item eaten) Search for all possible prey items, but pursue them one at a time Prey items can be ranked from most preferred to least desirable
Optimal Foraging Theory “Economics of Consumer Choice” (R. H. Mac. Arthur) Assumptions: a) Environmental structure is repeatable, with statistical expectation of finding a given resource (habitat, microhabitat, or prey item) b) Food items can be arranged along a continuous spectrum, such as by size or energy reward c) Similar phenotypes are closely equivalent in harvesting abilities d) Principle of Allocation applies: no one phenotype can be maximally efficient on all prey types e) An individual’s economic “goal” is to maximize its total intake of food resources
“Economics of Consumer Choice” Four Phases of Foraging: 1) deciding where to search 2) searching for palatable food items R. H. Mac. Arthur 3) upon locating a potential food item, deciding whether or not to pursue it 4) pursuit itself, with possible capture and eating Search and pursuit efficiencies for each food type in each habitat are entirely determined by preceding assumptions about morphology and environmental repeatability. These efficiencies dictate probabilities associated with search and pursuit (phases 2 and 4). Thus, need to consider only the two decisions: where to forage and which prey items to pursue (phases 1 and 3 above)
“Economics of Consumer Choice” Four Phases of Foraging: 1) deciding where to search 2) searching for palatable food items R. H. Mac. Arthur 3) upon locating a potential food item, deciding whether or not to pursue it 4) pursuit itself, with possible capture and eating Search and pursuit efficiencies for each food type in each habitat are entirely determined by preceding assumptions about morphology and environmental repeatability. These efficiencies dictate probabilities associated with search and pursuit (phases 2 and 4). Thus, need to consider only the two decisions: where to forage and which prey items to pursue (phases 1 and 3 above)
“Economics of Consumer Choice” (R. H. Mac. Arthur) Clearly, an optimal consumer should forage where its expectation of yield is greatest -- an easy decision to make, given knowledge of efficiency probabilities and the structure of the environment (of course, in reality, animals are not omniscient and must make decisions based on incomplete information). The decision as to which prey items to pursue is also simple. Upon finding a potential prey item, a consumer has just two options: either pursue it or go on searching for a better item and pursue that one instead. Both decisions end in the forager beginning a new search, so the best choice is clearly the one that returns the greatest yield per unit time. An optimal consumer should opt to pursue an item only when it cannot expect to locate, catch and eat a better item during the time required to capture and ingest the first prey item
Resource Matrix (n x m matrix) utilization coefficients and electivities Resource State 1 2 3. . . m 1 u 11 u 21 u 31. . . um 1 2 u 12 u 22 u 32. . . um 2 Consumer Species 3. . . u 13. . . u 23. . . u 33. . . . um 3. . . Handout 7 Conus Problem n u 1 n u 2 n u 3 n. . . umn
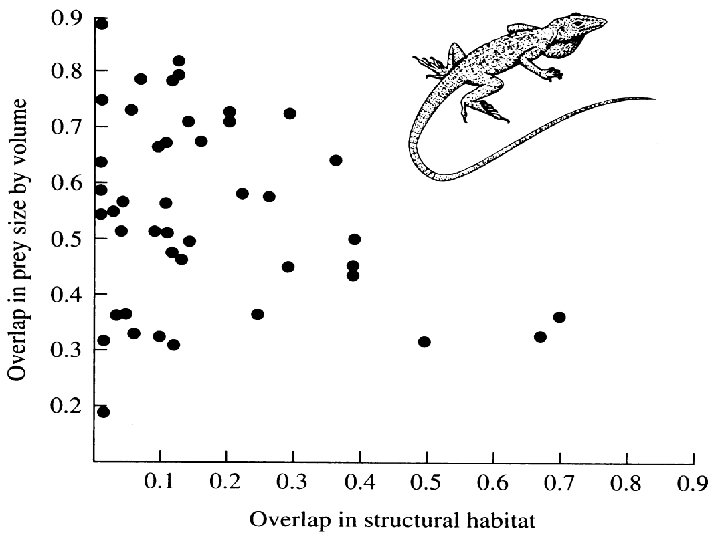
Niche Dynamics and Niche Dimensionality Thomas W. Schoener 1 -½S|pij – pik| where pij and pik are the proportions of resource i used by species j or k respectively
Unidimensional utilization versus true multidimensional utilization
Partial derivatives, ∂Ni/ ∂Nj sensitivities of each species to changes in the density of each other species Jacobian matrix (community matrices) Lyapunov stability (negative leading dominant eigenvalue) The ecological niche, function of a species in the community Resource utilization functions (RUFs) Competitive communities in equilibrium with their resources Within & between phenotype components of niche breadth Hutchinson’s n-dimensional hypervolume concept Fundamental and Realized Niches Niche dimensionality, unidimensional shadows misleading Niche overlap hypothesis Resource matrices
Resource matrices of utilization coefficients (or electivities) Disjunct, Abutting, Overlapping, Included Niches Niche overlap hypothesis Niche dynamics and niche dimensionality, diffuse competition Complementarity of niche dimensions Independence of niche dimensions Unidimensional estimates of true multidimensional utilization Niche Breadth: Specialization versus generalization. Similar resources favor specialists, different resources favor generalists
Mac. Arthur “Economics of Consumer Choice” Robust theorem: Diets contract when prey abundant Mac. Arthur and Levins limiting similarity model Ambush versus Active Foragers: optimal foraging Compression Hypothesis Fisher’s model of adaptation and deterioration of environment, p. 92 Periodic tables of niches Thermoconformer versus thermoregulator continuum Ecological Equivalents, convergent evolution Adaptive Suite of horned lizards Convergent evolution, ecological equivalents (Moloch horridus)
Adaptation and Deterioration of Environment Ronald A. Fisher Non-directed (random) changes in either A or B are equally likely to reduce the level of adaptation (d ) when small, but as the magnitude of change increases, the probability of improvement diminishes. From Chapter 5, page 92.
Compression Hypothesis: habitats contract, diets do not
Empty Niche
Page 95
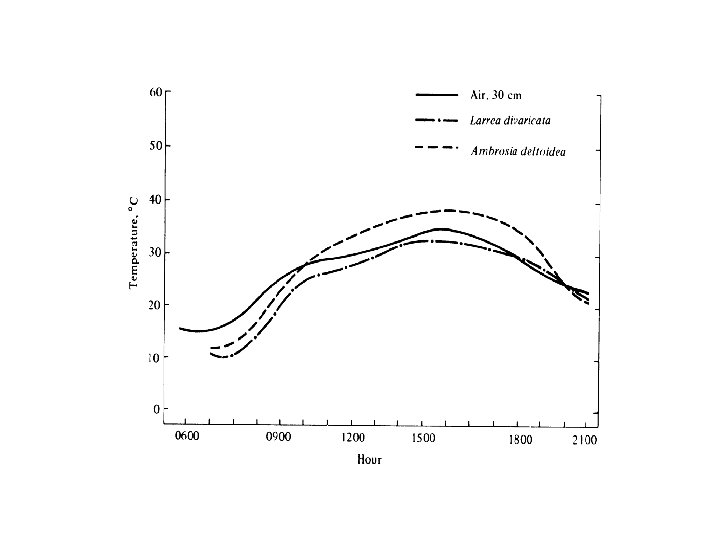
Passive thermoconformer Page 96 Nephrurus laevissimus
Active Thermoregulator Ctenophorus isolepis
Active Thermoregulator Ctenophorus isolepis Thermoconformer
Ctenotus skinks (Australia)
Thermoconformer
Page 106
Page 106 O Thermoconformers
Ten Morphometrics Snout-vent length Tail length Head width Head depth Jaw length Forefoot length Foreleg length Hindfoot length Hindleg length
Multivariate techniques (principal components, ordination) Principal Components Analysis Reduces dimensionality (correlated data) Changes coordinate system (data positions unchanged) Log transform data
First Principal Component Second Principal Component
First Two Principal Components reduce variance by 92. 4%
First Two Principle Components reduce variance by 92. 4%
First Two Principal Components capture 92. 4% of variance Agama
Page 343 Moloch Phrynosoma