Seasonal Forecasts using Objectively Chosen Analog Years Seasonal

Seasonal Forecasts using Objectively Chosen Analog Years

Seasonal Forecasts using Objectively Chosen Analog Years • The Technique • 2011 -12 Verification • Analogs for Upcoming Winter • The Forecast

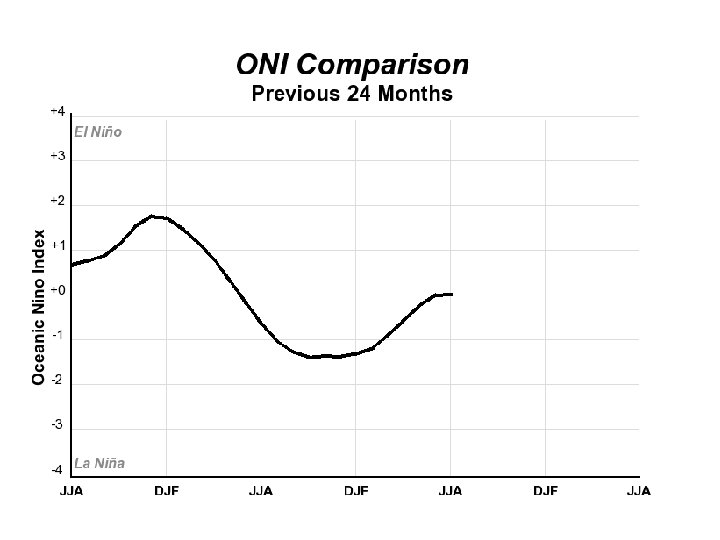
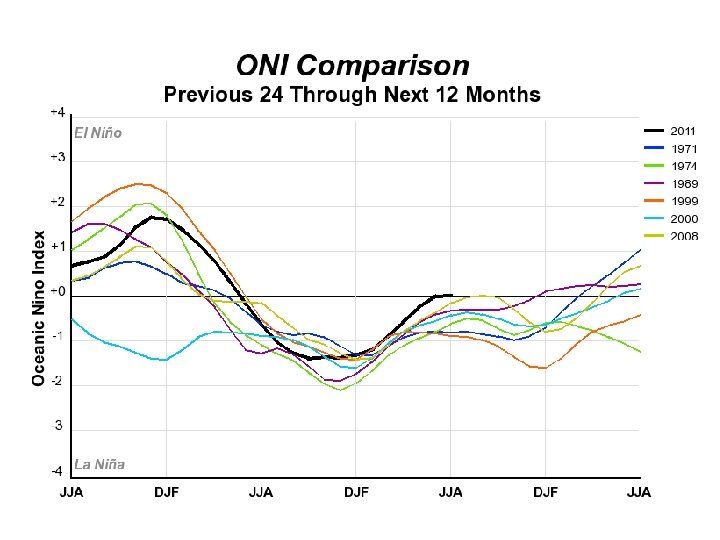
Analog Seasonal Forecasting • Look at this year so far…

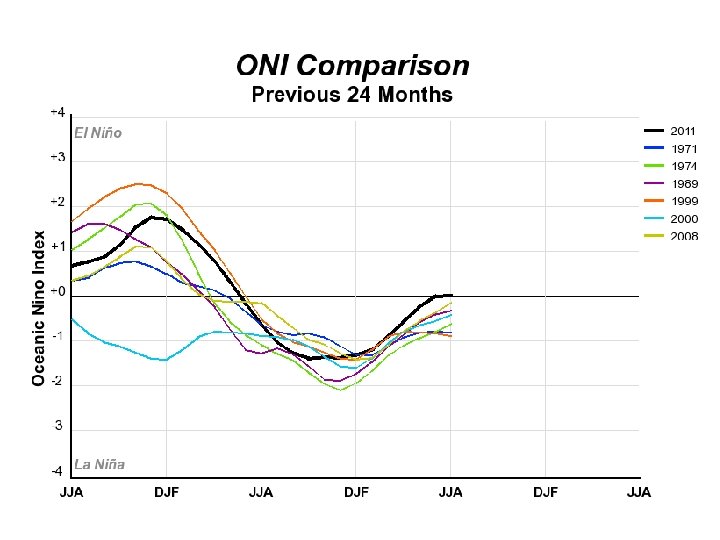
Analog Seasonal Forecasting • Look at this year so far… • Look for past years that are similar to this year …

Analog Seasonal Forecasting • Look at this year so far… • Look for past years that are similar to this year … • Use what subsequently happened in those past years as a forecast for what will happen this year.

Analog Seasonal Forecasting • Look at this year so far… • Look for past years that are similar to this year … • Use what subsequently happened in those past years as a forecast for what will happen this year.
 NAO (North Atlantic Oscillation) Jones NAO EPO")
Climate Indices PNA (Pacific North American Index) NAO (North Atlantic Oscillation) Jones NAO EPO (Eastern Pacific Oscillation) TNH ONI NTA (North Tropical Atlantic Index) CAR (Caribbean Index) MEI BEST Nino 3 Nino 1+2 Nino 3+4 Nino 4 Pacific Warm Pool Tropical Pacific SST EOF TNA TSA WHWP WP (West Pacific Index) QBO (Quasi-Biennial Oscillation) PDO (Pacific Decadal Oscillation) PMM (Pacific Meridional Mode) NP (North Pacific Index) NOI (Northern Oscillation Index) AO (Arctic Oscillation) AAO TNI Atlantic Tripole SST EOF AMO AMM (Atlantic Meridional Mode) ACE (Atlantic Accumulated Cyclone Intensities) Solar Cycle (Flux) Monthly Hurricane Total MDR Hurricanes SST Anomaly MDR - Tropics SST Anomaly Central India Monsoon Precipitation Sahel Rainfall Brazil Rainfall SW USA Monsoon Global Mean Temperature ESPI Globally integrated angular momentum

Not just th e index… But sensibl e weather… IE Warm/C ool… Wet/ Dry

Not just th e index… But sensibl e weather… IE Warm/C ool… Wet/ Dry

Automate the Process • Compare each previous year to this year… • Compute a “Goodness of Fit” number… • Sort “Goodness of Fit”… • Print/Save results… • Do this for multiple indices… • Find “Consensus” analog years


Last s ’ r a Ye

2011/12 Forecast Summary Forecast: Nov Climate Division 2 – Willamette Valley Dec Jan Feb Mar Apr Above Near Below Precip: Near Above Near Below Near Temp:

2011/12 Forecast Summary Forecast: Nov Climate Division 2 – Willamette Valley Dec Jan Feb Mar Apr Above Near Below Precip: Near Above Near Below Near Temp: Observed: Nov Climate Division 2 – Willamette Valley Dec Jan Feb Below Near Below Precip: Near Below Above Temp:

2011/12 Forecast Summary Forecast: Climate Division 2 – Willamette Valley Nov Dec Jan P P Feb Mar Apr P Above Near Below Precip: Near Above Near Below Near P Temp: Observed: Nov Climate Division 2 – Willamette Valley Dec Jan Feb Below Near Below Precip: Near Below Above Temp:

2011/12 Verification • 4 “Hits” • 6 One-category errors • 2 Two-category errors

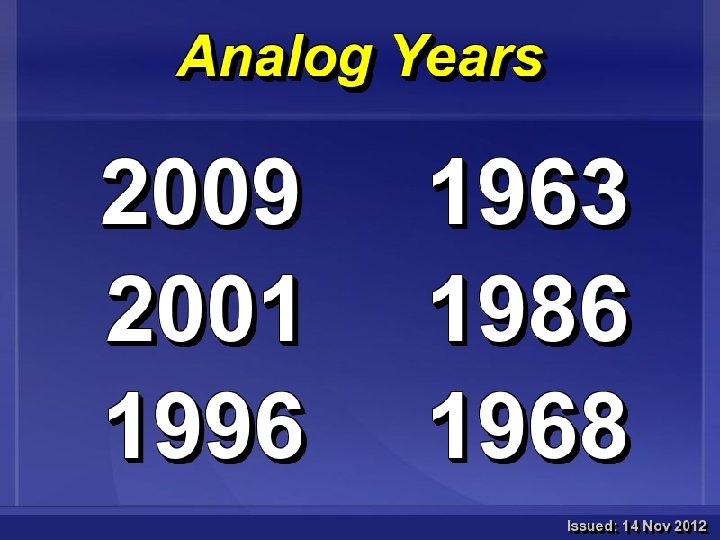
On to Next Winter…

On to Next Winter…

On to Next Winter…

Indices CPC SOI, MEI, ONI, BOM SOI, Nino 3. 4 Anom, Nino 3 Temps, Nino 4 Temps, PNA, PDO, NAO, WP, and the QBO.

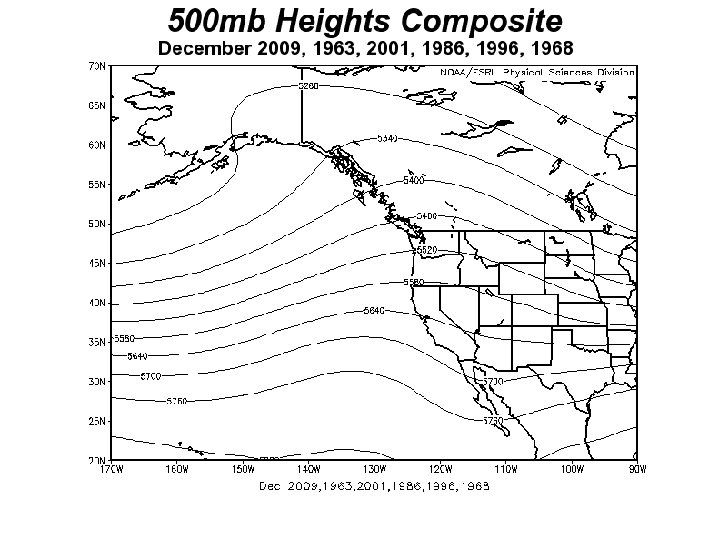
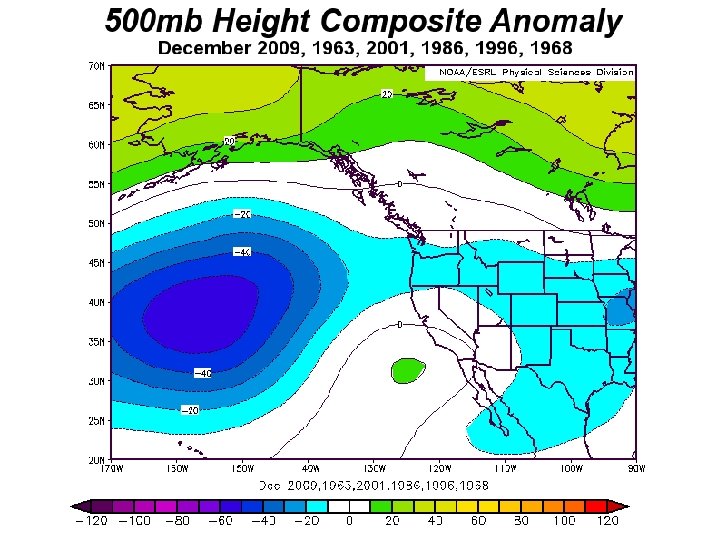
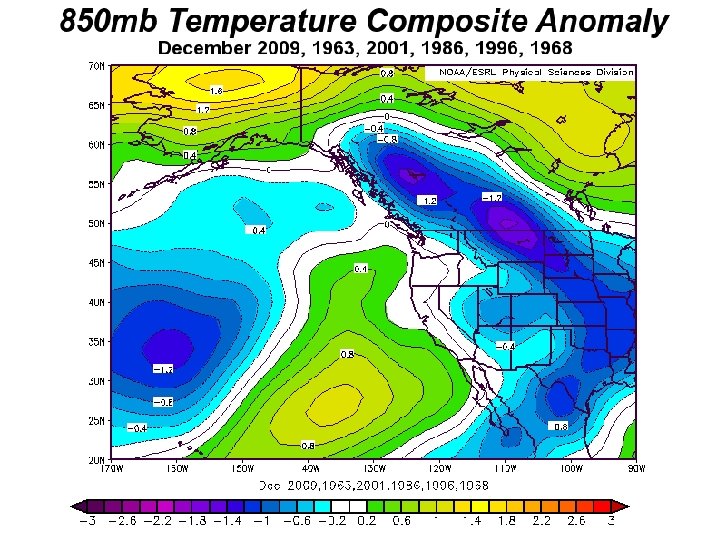
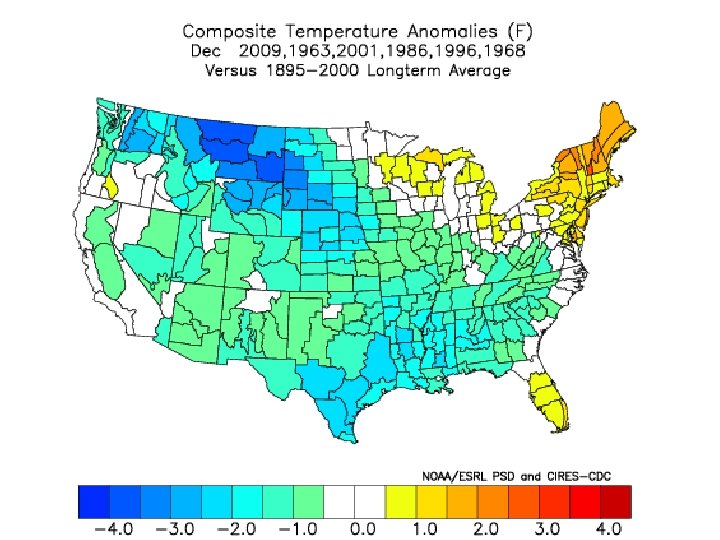
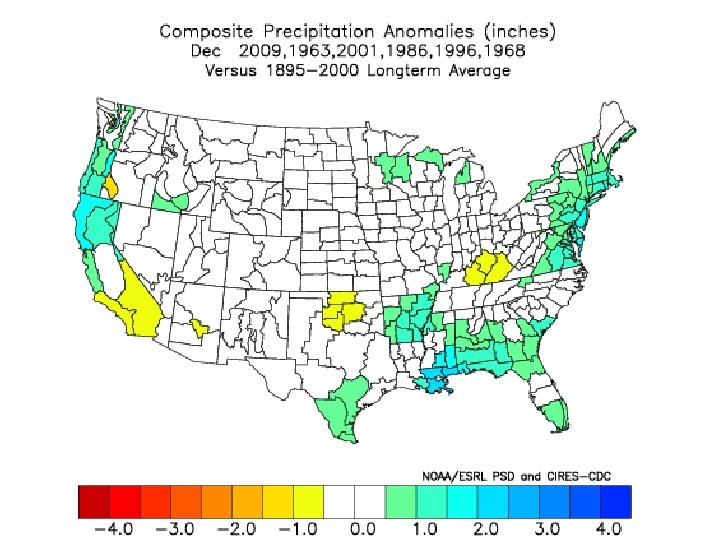
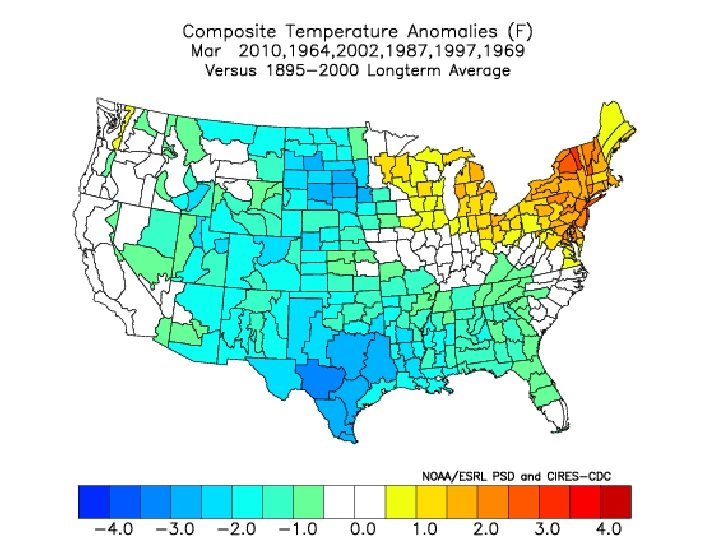
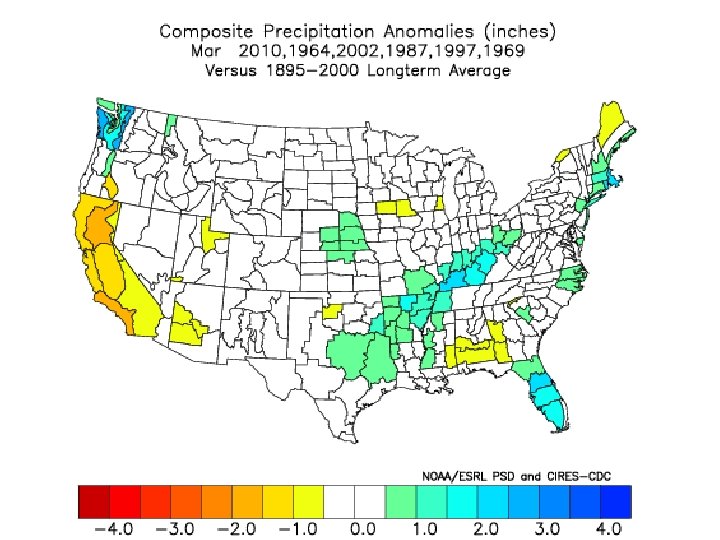
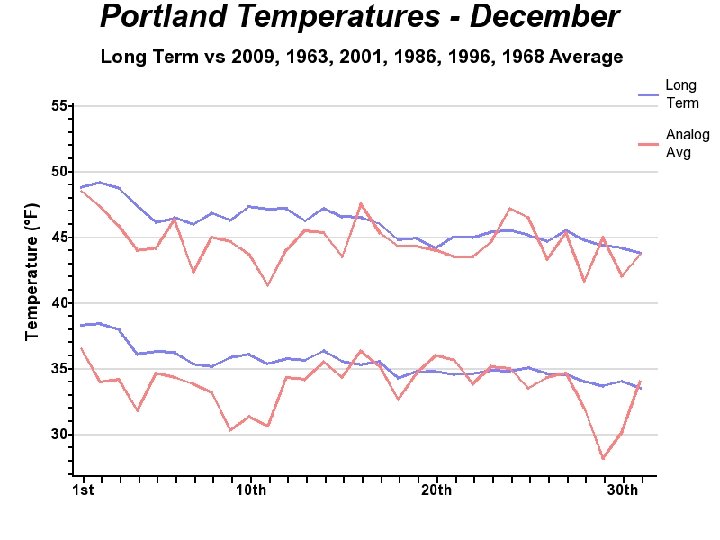
Composites December…

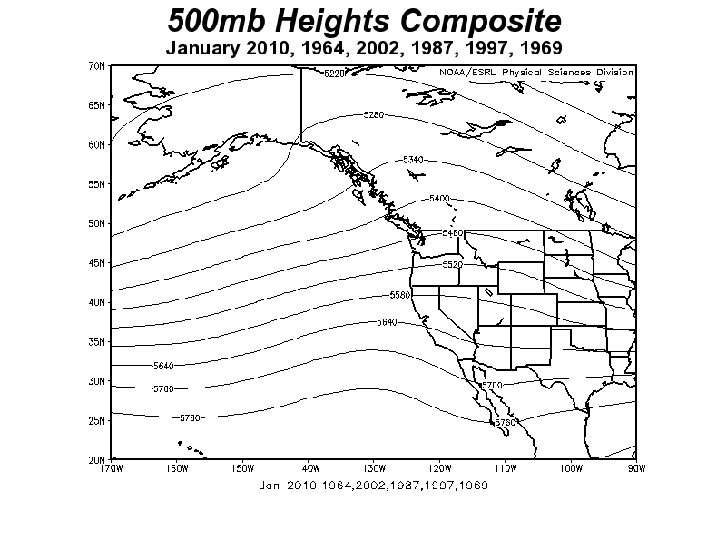
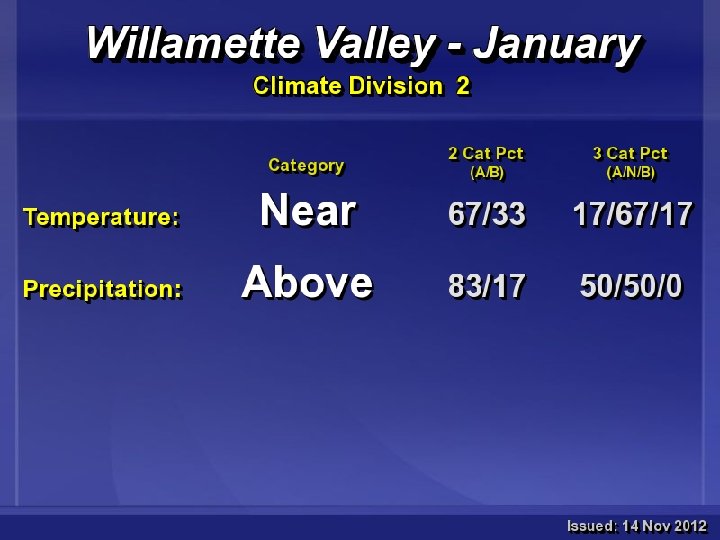
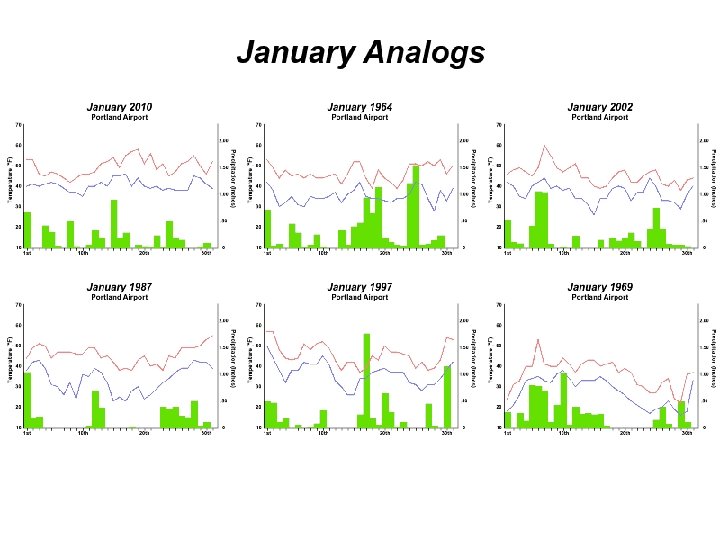
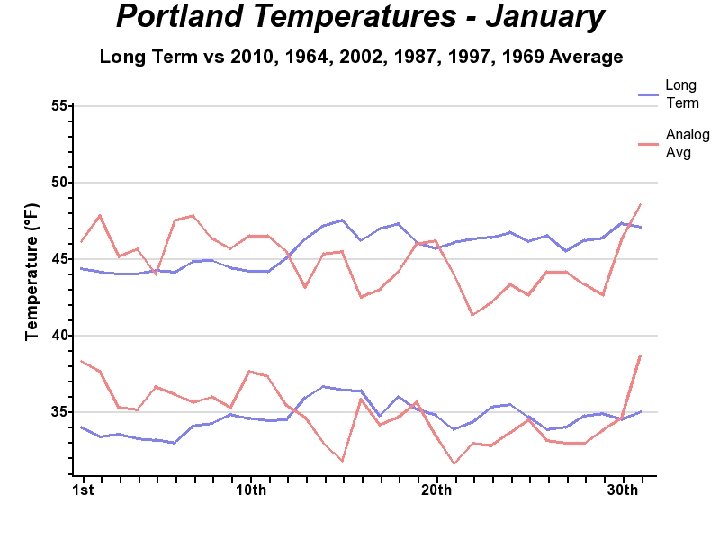
Composites January…
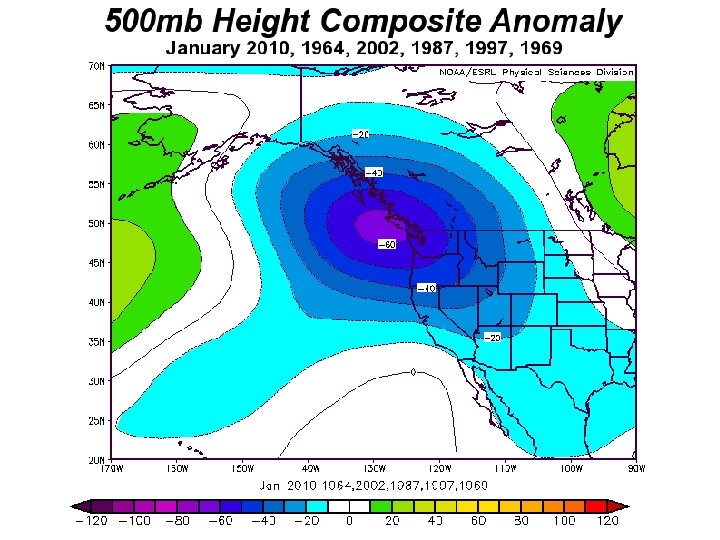
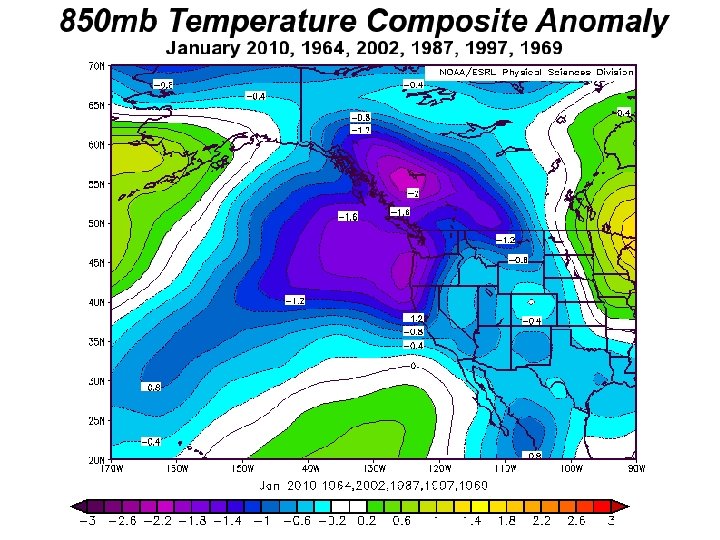
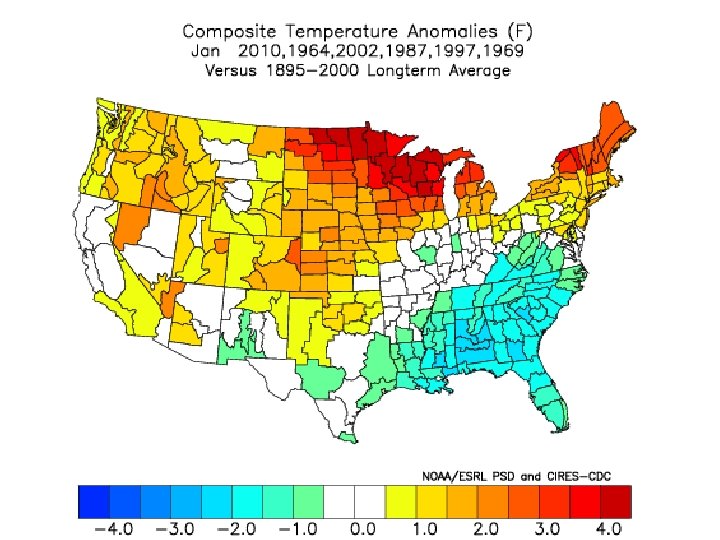
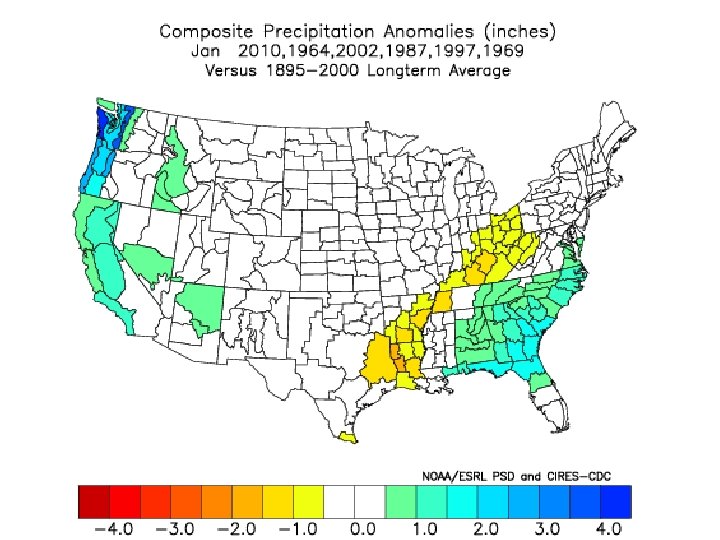

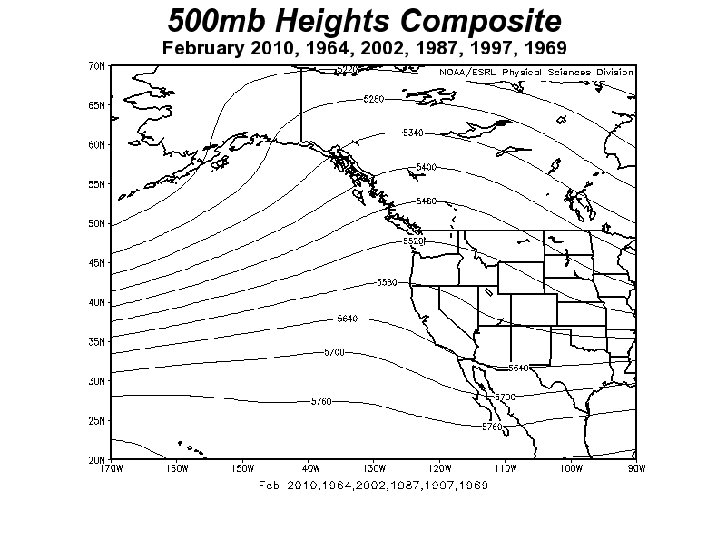
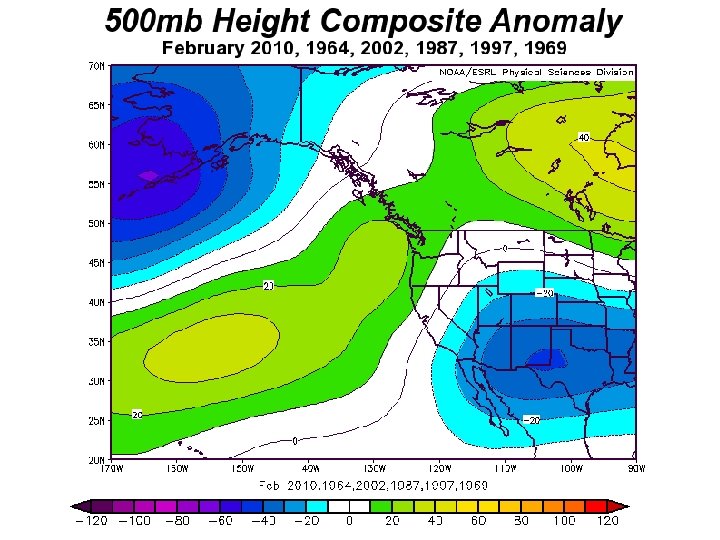
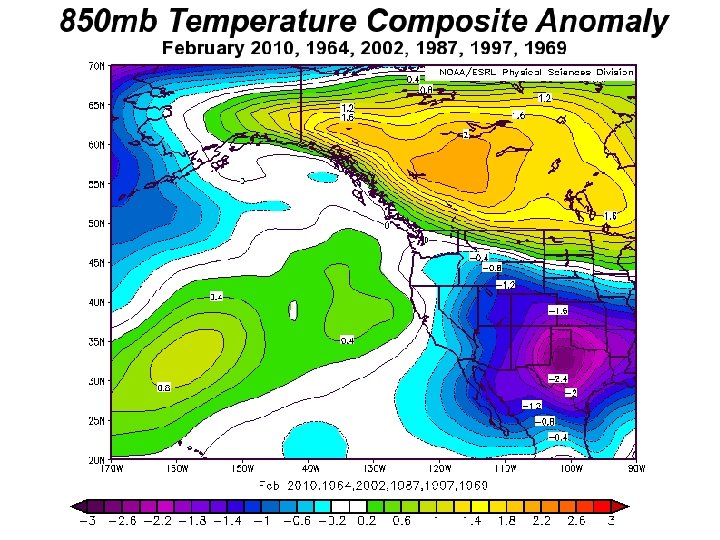
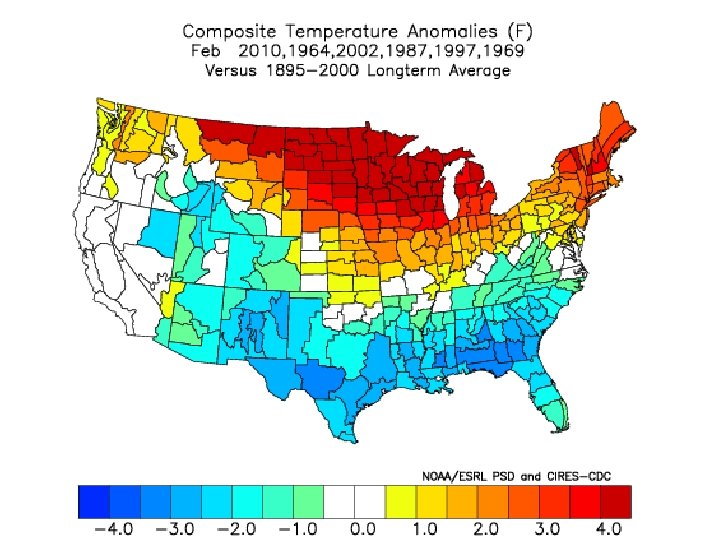
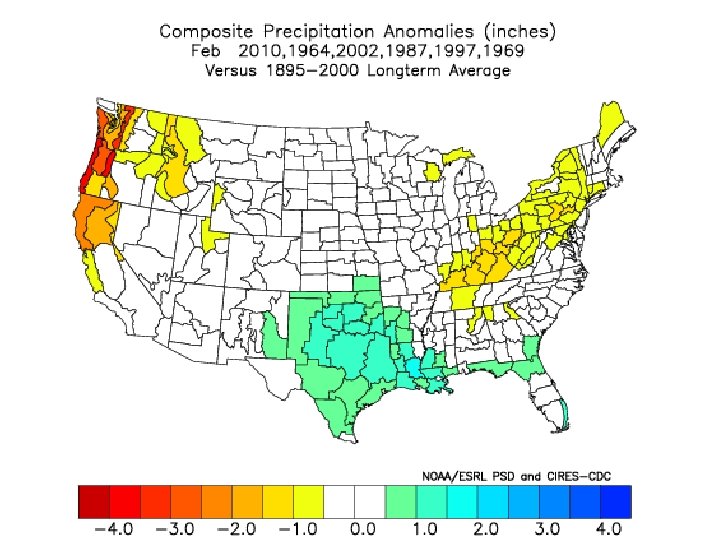
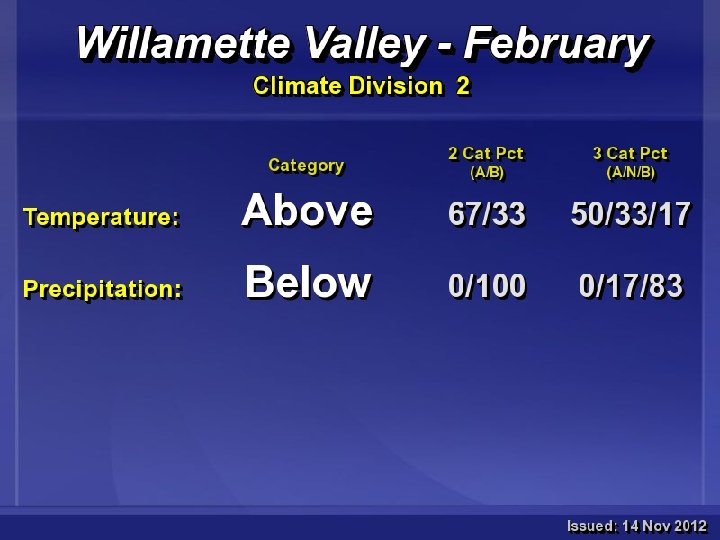
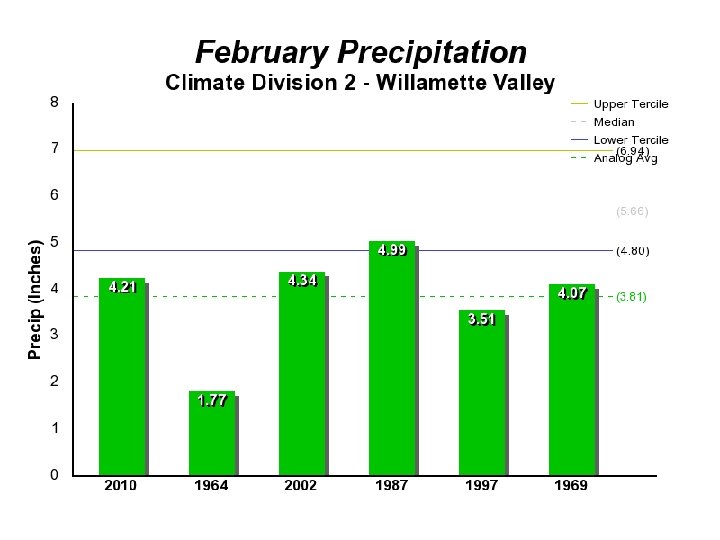
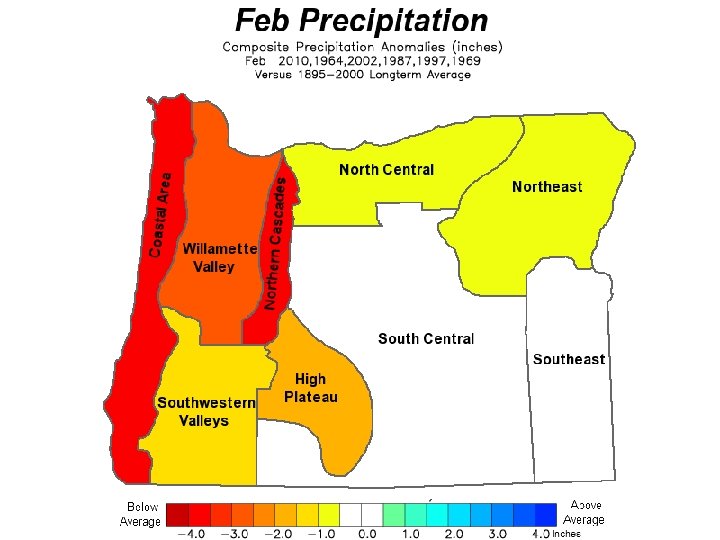
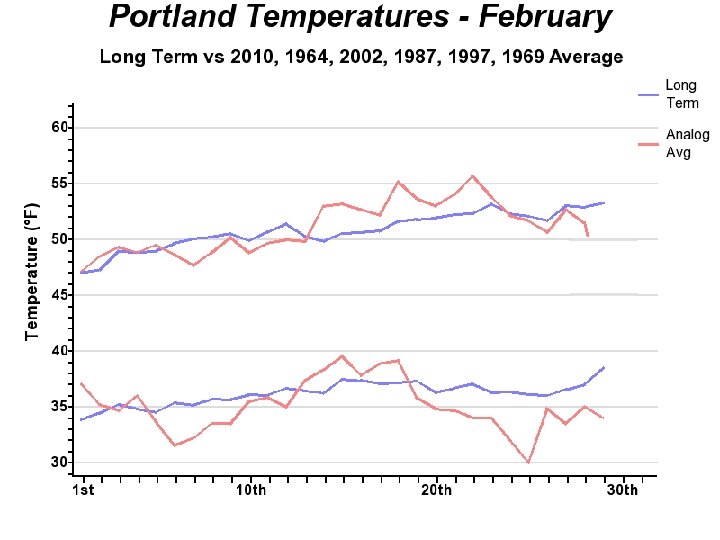
Composites February…

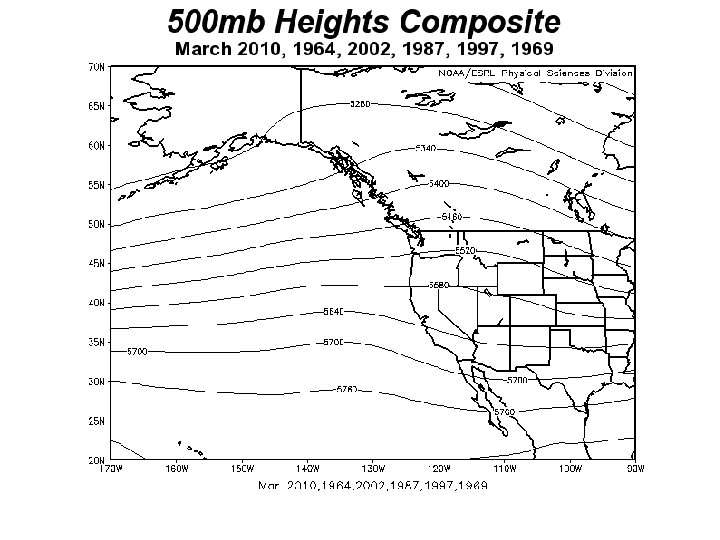
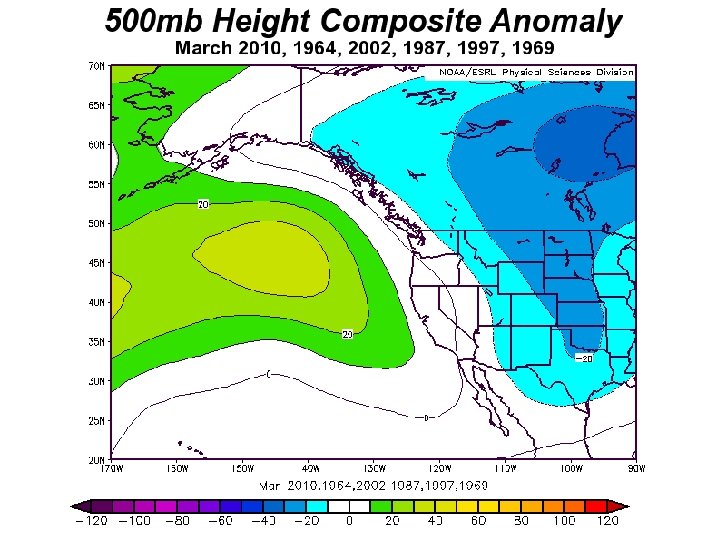
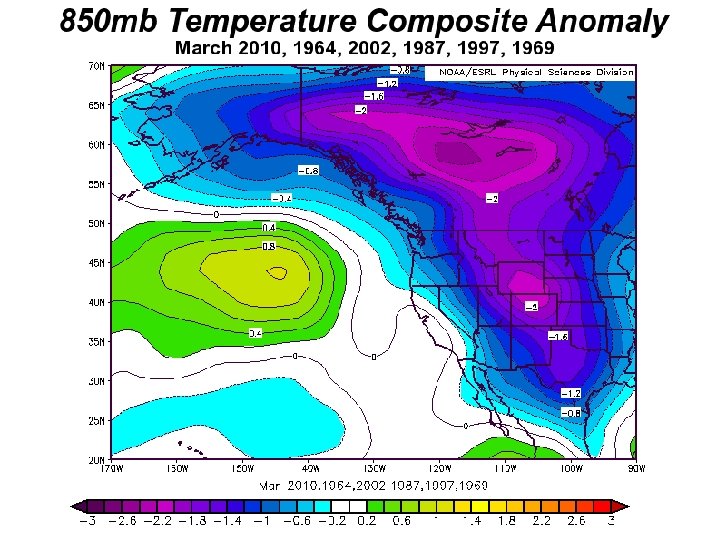
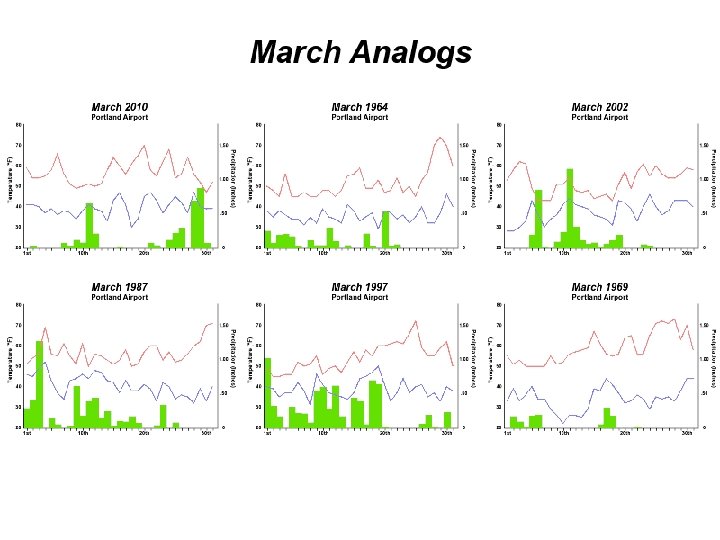
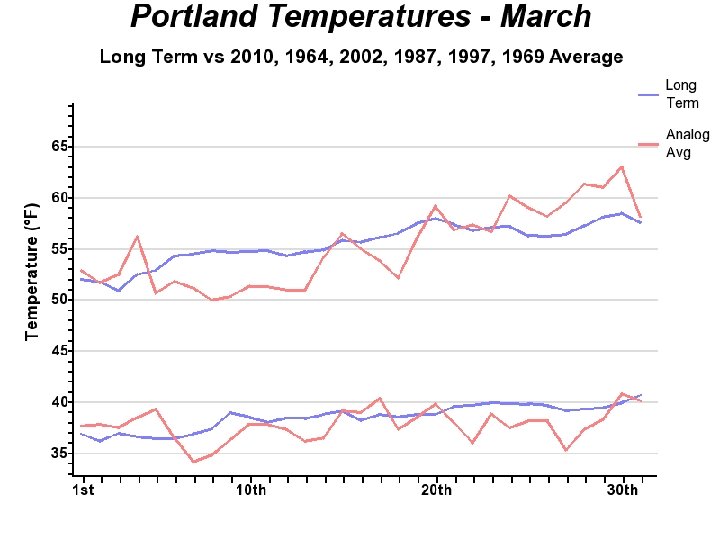
Composites March…

April May

April May

April May http: //weather. jimlittle. net/2012 Winter Forecast Graphics

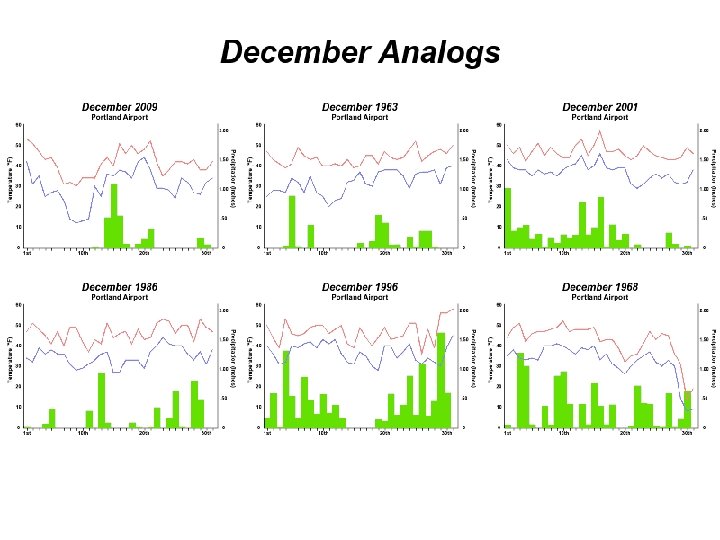
Portland/Willamette Valley Month by Month…
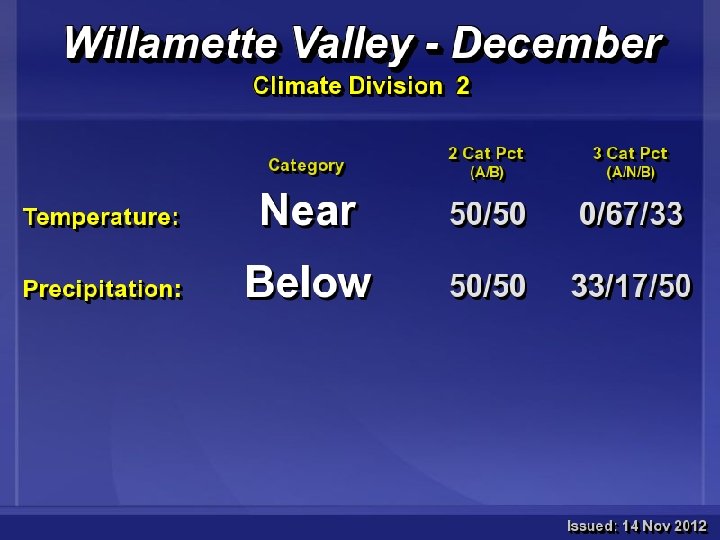

Median

“Near” Median

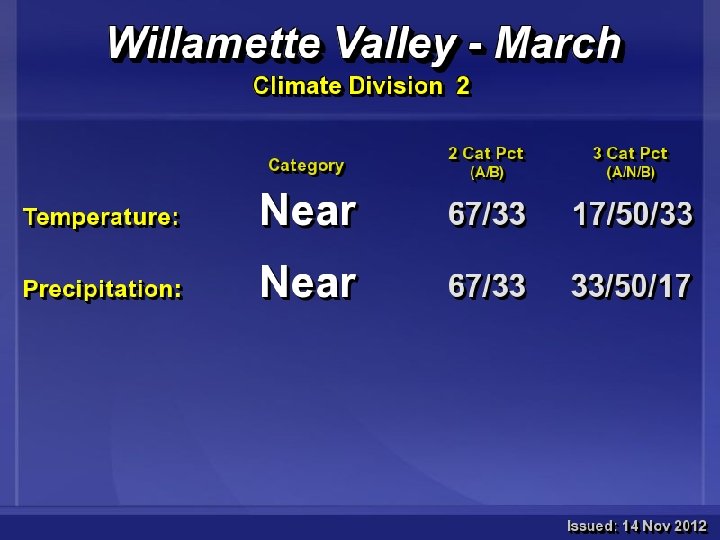

Summary Climate Division 2 – Willamette Valley Dec Jan Feb Mar Apr May Near Above Near Precip: Below Above Below Near Above Near Temp:

Cascades

Summary Climate Division 4 – North Cascades Dec Jan Feb Mar Apr May Near Below Near Precip: Near Above Below Temp:

Government Camp Snow December 23 d 24 th 25 th 26 th 27 th 28 th 29 th 30 th 31 st 2009 21 21 20 19 19 26 26 2001 56 56 54 52 50 50 48 1996 53 65 64 67 67 68 71 52 50 1986 6 8 8 8 7 6 6 11 11 1968 54 55 46 46 52 60 65 70 74 1963 8 7 8 9 8 6 6 5 3 Snow Depth in Inches

Government Camp Snow December 23 d 24 th 25 th 26 th 27 th 28 th 29 th 30 th 31 st 2009 21 21 20 19 19 26 26 2001 56 56 54 52 50 50 48 1996 53 65 64 67 67 68 71 52 50 1986 6 8 8 8 7 6 6 11 11 1968 54 55 46 46 52 60 65 70 74 1963 8 7 8 9 8 6 6 5 3 Snow Depth in Inches

Government Camp Snow December 23 d 24 th 25 th 26 th 27 th 28 th 29 th 30 th 31 st 2009 21 21 20 19 19 26 26 2001 56 56 54 52 50 50 48 1996 53 65 64 67 67 68 71 52 50 1986 6 8 8 8 7 6 6 11 11 1968 54 55 46 46 52 60 65 70 74 1963 8 7 8 9 8 6 6 5 3 Snow Depth in Inches 4 of 6 Years Great! 2 of 6 Marginal

Questions? Climate Division 2 – Willamette Valley Dec Jan Feb Mar Apr May Near Above Near Precip: Below Above Below Near Above Near Temp: jim@mail. wxnorthwest. com jlittle@odf. state. or. us http: //weather. jimlittle. net/2012 Winter Forecast Graphics
- Slides: 77