SCSU Light Pole LED Retrofit Analysis Don Granlund


 • OBJECTID*, Lightpole_ID, Image_ID, Bulb_type, Pole_Material, Wattage, Voltage, Last_Insp_Date,")


 /")


- Slides: 31
SCSU Light Pole LED Retrofit Analysis Don Granlund III Krystal Sweeter Joseph A. Sanders
Project Description • The purpose of this project was to find and map and collect data on all of the light poles on the SCSU campus for the maintenance department using Arc. GIS 10. 1 software, and to conduct a cost/benefit analysis of retrofitting those light poles to LED • Joe Teff • Alyssa Heinen
Objectives Map, inspect, and photograph every light pole on the SCSU campus and create a detailed Arc. GIS “layer” for the existing campus map • • Determine the total number of light poles on campus • Determine the difference between highpressure sodium lights and LEDs in initial cost, maintenance, energy usage, and average lifespan • Create a cost/benefit analysis
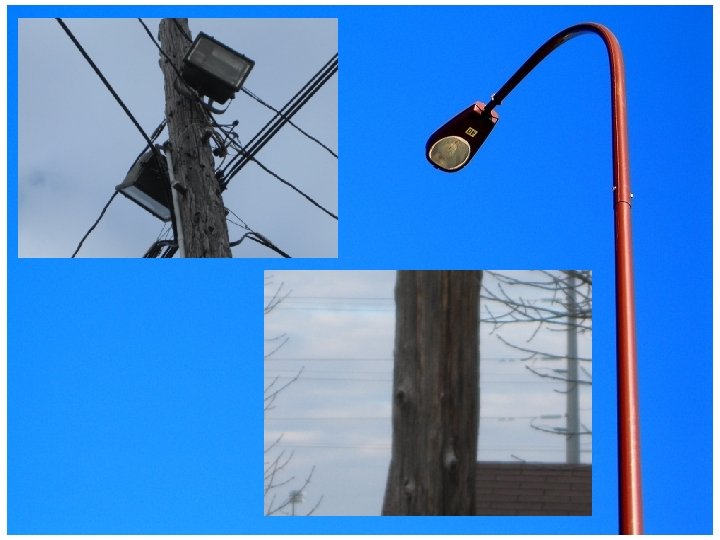
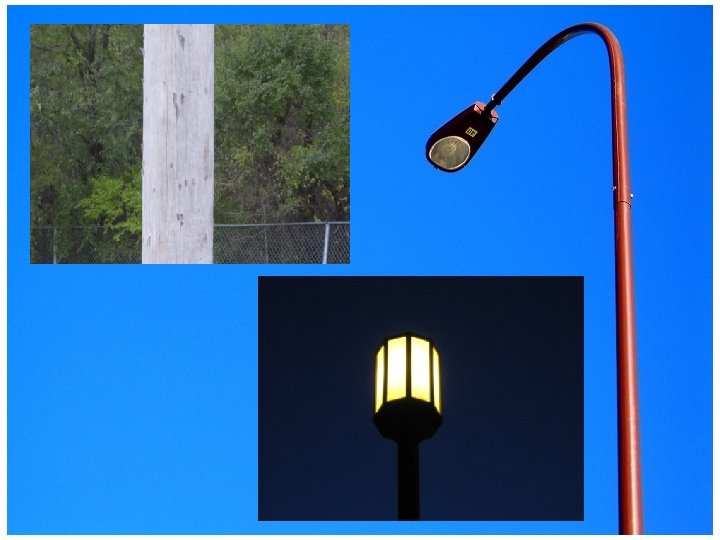
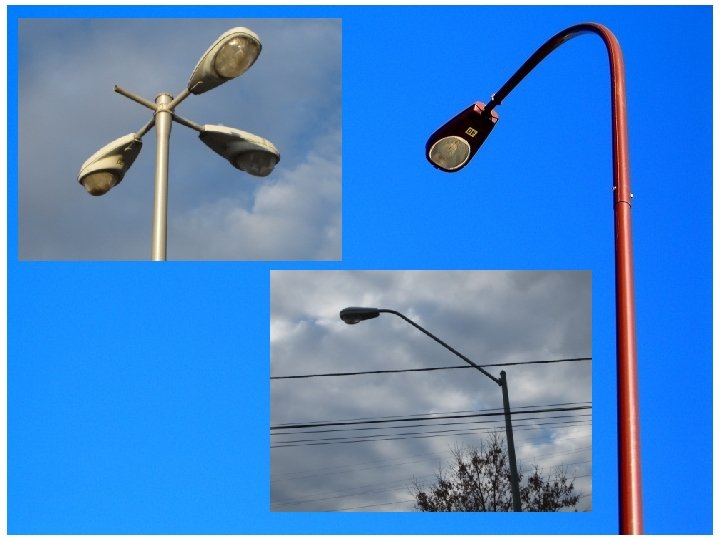
Phase 1 of Arc. GIS • Primary objective: Gather data for “electronic” map • Created 6 “mini-maps” which were used to accurately map all 530 light poles on campus • 1, 060 photo’s were taken for inspection and maintenance records • Each light pole was given an identification number and “Image_id”
Phase 2 of Arc. GIS • Primary objective: Develop a layer within the Arc. GIS campus map • Plotted every light pole in our layer on the “electronic” version of the campus map • Developed an attribute table for data and maintenance records • Inputted data manually into our Arc. GIS layer
Attribute Table – (9 Fields) • OBJECTID*, Lightpole_ID, Image_ID, Bulb_type, Pole_Material, Wattage, Voltage, Last_Insp_Date, Comments
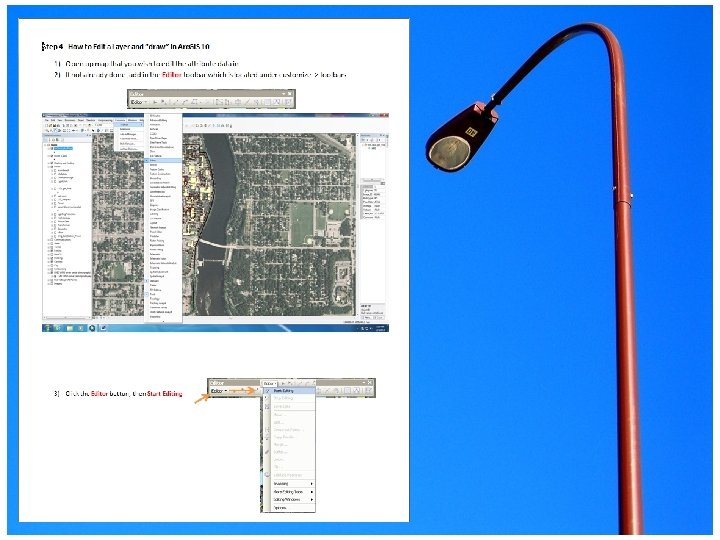
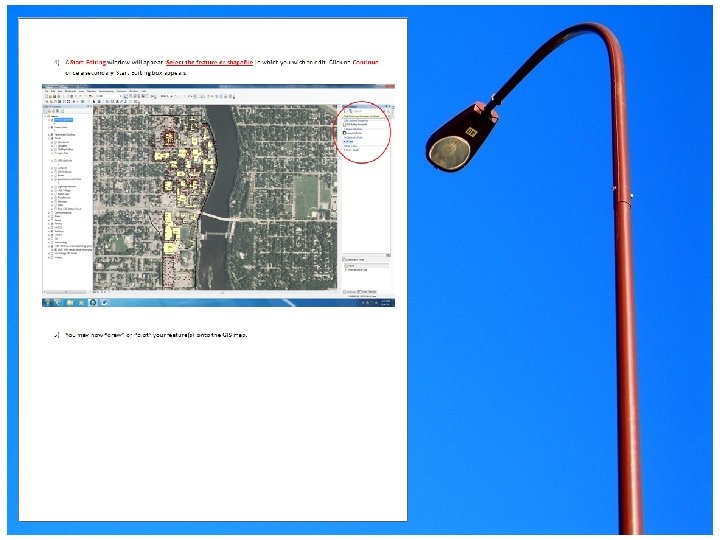
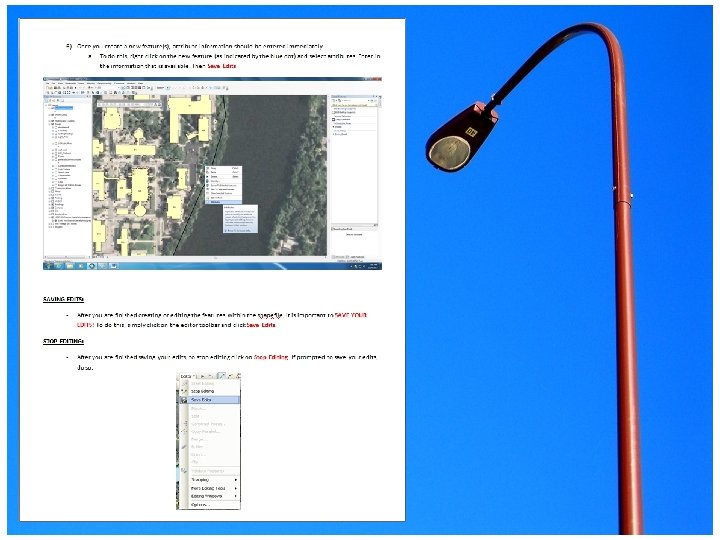
Phase 3 of Arc. GIS • Primary objective: Develop an Arc. GIS Instructional booklet • Booklet consists of 4 -steps • These 4 -steps are identical to the steps used to create the layer with the Arc. GIS campus map • Designed the Instructional booklet to Arc. GIS “noob-friendly”
LED vs. HPS • Lumens - derived unit of luminous flux, a measure of the total "amount" of visible light emitted by a source. • LED engines have a mean of 3, 425 lumens compared to 2, 250 lumens of HPS bulbs. • LED engines operate at 55 watts and have a lower operating temperature. Current bulbs on campus operate at 150 Watts. • LED engines have a life span of 100, 000 hours or 22. 83 years! HPS last only 16, 000 years or 3. 65 years.
D-Series Size 1 Jordan Ruddy – Grainger Industrial Supply
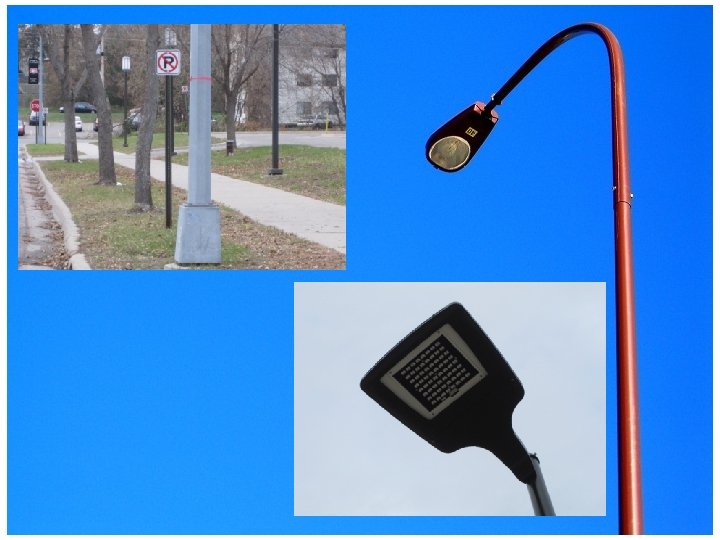
D-Series Size 1 • Mast Arm Mount • Features: – Consists of 1 or 2 LED engines: each engine has 30 LEDs – Majority of lamps can be replaced easily with just four bolts – Long lasting – Energy Efficient – Ideal for replacing 100 W to 400 W area lighting
Cost and Benefits • High Pressure Sodium: • LED – Cost of Lamps: $40. 75 – Cost of ballast: $178. 25 – Lifespan: 16, 000 hours – Cost of LED Replacement: $740. 00 – Lifespan: 100, 000 hours • HPS and LED: – Average hours lit: 12 hours – Amount Xcel charges per Kilowatt: $. 072 – Total Number of light poles: 530
Cost and Benefits Cont. HPS Wattages • 70%- 100 Watts • 20%- 150 Watts • 10%- 200 Watts LED Wattages • 55 Watts
Costs and Benefits Cont.
Cost and Benefits Cont. • Results • HPS • 100 Watts: $11, 645 • 150 Watts: $5, 014 • 200 Watts: $3, 346 – Total: $20, 005 per year • LED • 55 Watts: $9, 285. 69 per year • Savings: $10, 719. 31
Cost and Benefits Cont. • Initial investment – $405, 980 • $405, 980 / $10, 971 (difference in operating costs) = 37. 62 years to break even!? • For Real?
Cost and Benefits Cont. • HPS operating Cost per year = $20, 005. 00… 16, 000 hours of life or 3. 6 years • LED operating cost per year = $9, 285. 00… 100, 000 hours of life or 22. 83 years • Initial Investment for LED = $405, 980. 00 • Operating cost (electricity used) difference between LED and HPS = $10, 791. 31 • $405, 980 / $10, 791 = 37. 62 years to break even on initial investment not counting labor or HPS bulb cost.
Cost and Benefits Cont. • Currently, SCSU has roughly 530 HPS bulbs / 3. 6 year life expectancy = 147. 2 bulbs replaced per year on average which costs $5, 998. 40 in replacement HPS bulbs. Lets assume 10 bulbs per day are replaced over 14 days. Estimated labor cost is $100 per hour. So to buy and replace HPS bulbs costs a total of $14, 720 per year in labor plus $5, 998. 40 in replacement bulbs. Which accumulates a of $20, 718. 40 per year.
Cost and Benefits Cont. • So if you take $405, 980 (initial investment) / $20, 718. 40 (Labor and HPS replacement cost) in labor that equals only 19. 59 years to break even. Which is before any LEDs will burn out. This leaves SCSU a period of 3. 24 years before the first LED fails. During this time SCSU will realize a savings of $20, 718. 40 per year in labor and energy, with a total of $67, 127. 62 over 3. 24 years by not buying HPS bulbs and saving in labor costs. This $67, 127. 62 is deducted from the initial investment of $405, 980. 00 equaling $341, 853 which means that SCSU will realistically “break even” in a little over 20 years.
Excel Graph *This Excel graph was designed to be updated with potential change with costs, total bulbs, labor costs, and other variables if need be
Conclusions and Recommendations • SCSU should switch to all LED – Conserve Energy – Excellent Long-term investment – Status Symbol – Forward Thinking • An average of 147 HPS bulbs cease to operate on campus per year. Instead of replacing those 147 bulbs, invest in LED. • Map ALL the exterior lights on campus • LIGHT POLE SPACING ANALYSIS? • Professional Audit. Again?
Reflection and Discussion • We feel the Project was a big success • Purpose of Project – Save SCSU time and money – Laid groundwork for future mapping of exterior lights – Provided hard data on switching to LED lights • Valuable Experience – Project had a late start – Meeting with experts – Time management – Work delegation
Work Log • Arc. GIS mapping, photographs, procedures, and development – 22 hours • Cost/benefit Analysis – 12 hours • Research, written report, meetings, and communication – 16 hours • TOTAL – 50 hours
Reflection and Discussion • Skills Acquired/Refined – Long and short term planning – Time management (setting goals) – GIS • Useful Courses – Principles of Geographic Information Systems – Resource Management – Communication Technology – Environmental and Technological Assessment – Environmental Systems Modeling – Environmental Economics
Questions? ? ? “I get to graduate now!”