Screen Stage Lecturers desk Row C Row D


 Lind (10 – 12)")
")


= 3. 517; p < 0. 05 The GPA for")


 Hours spent at computer 0. 05 10.")

= 5. 73; p < 0. 05 The number of hours")


 = 3.")


- Slides: 76
Screen Stage Lecturer’s desk Row C Row D Row E Row F Row G Row H Row J Row K Row L Row M 28 27 26 28 27 25 24 23 22 26 25 24 23 22 28 27 26 25 24 23 22 28 27 26 25 24 23 22 28 27 26 25 24 23 22 table 3 broke n desk 2 1 Row A Row B Row C Row D Row E Row F Row G Row H Row J Row K Row L Row M 14 13 12 11 10 9 8 7 6 5 4 3 2 1 21 20 19 18 17 16 15 14 13 12 11 10 9 8 7 6 5 4 3 2 1 21 20 19 18 17 16 15 14 13 12 11 10 9 8 7 6 5 4 3 2 1 21 20 19 18 17 16 15 14 13 12 11 10 9 8 7 6 5 4 3 2 1 21 20 19 18 17 16 13 12 11 10 9 8 7 6 5 4 3 2 1 14 13 2 1 Projection Booth Modern Languages R/L handed table 3 2 1 Row C Row D Row E Row F Row G Row H Row J Row K Row L Row M
MGMT 276: Statistical Inference in Management Spring 2015
MGMT 276: Statistical Inference in Management Spring 2015
Exam 3 –Tuesday April 14 th Study guide is online Shorter and longer versions Bring 2 calculators Bring 2 pencils (with good erasers) Bring ID Stats Review with Dr. Delaney Sunday at 6: 30 pm (April 12 th) Room 111 Chem Building No Cost
No Homework Just study for exam
Schedule of readings Before our next exam (April 14 th) Lind (10 – 12) Chapter 10: One sample Tests of Hypothesis Chapter 11: Two sample Tests of Hypothesis Chapter 12: Analysis of Variance Plous (2, 3, & 4) Chapter 2: Cognitive Dissonance Chapter 3: Memory and Hindsight Bias Chapter 4: Context Dependence
By the end of lecture today 4/9/15 Hypothesis testing with t-scores (two independent samples) Analysis of Variance (ANOVA) Constructing brief, complete summary statements Review for Exam 3
Homework
Homework
Homework
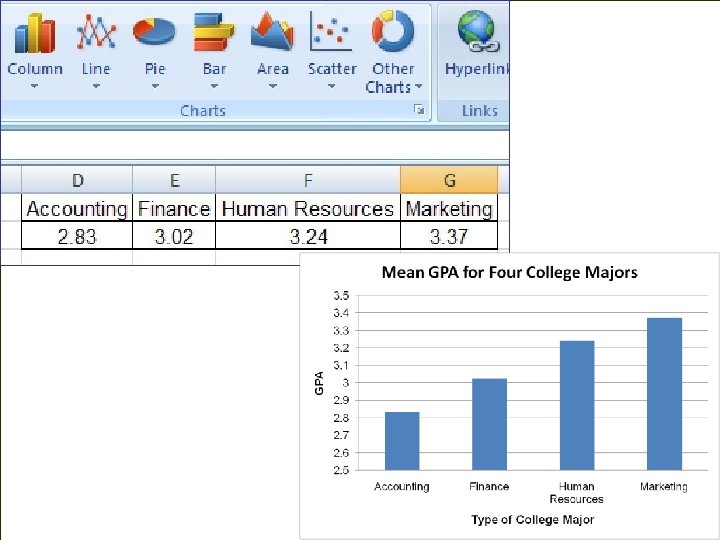
Type of major in school 4 (accounting, finance, hr, marke Homework Grade Point Average 0. 05 2. 83 3. 02 3. 24 3. 37
If observed F is bigger. Fthan criticalthan F: If observed is bigger Reject null & critical Significant! F: Reject null & Significant! Homework If p value is less than 0. 05: Reject null & Significant! 4 -1=3 # groups - 1 # scores - number of groups 28 - 4=24 # scores - 1 28 - 1=27 0. 3937 0. 1119 0. 3937 / 0. 1119 = 3. 517 3. 009 3 24 0. 03
Yes Homework F (3, 24)= 3. 517; p < 0. 05 The GPA for four majors was compared. The average GPA was 2. 83 for accounting, 3. 02 for finance, 3. 24 for HR, and 3. 37 for marketing. An ANOVA was conducted and there is a significant difference in GPA for these four groups (F (3, 24) = 3. 52; p < 0. 05).
Number of observations in each group Average for each group (We REALLY care about this one)
“SS” = “Sum of Squares” - will be given for exams Number of groups minus one (k – 1) 4 -1=3 Number of people minus number of groups (n – k) 28 -4=24
SS between df between SS within df within MS between MS within
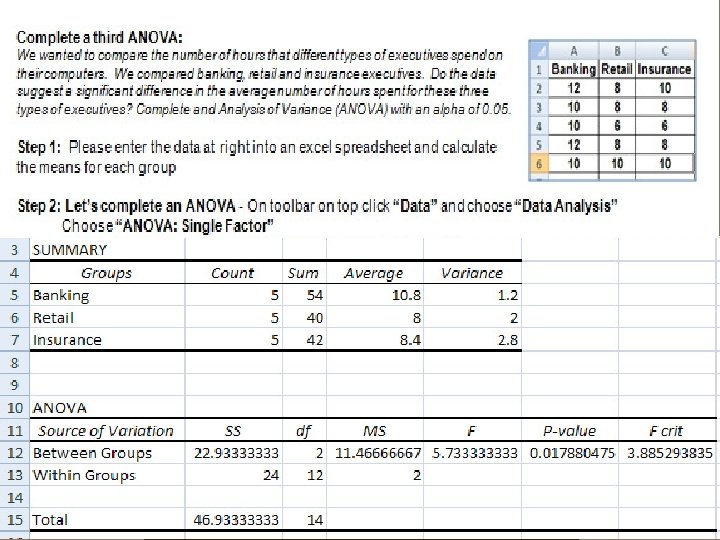
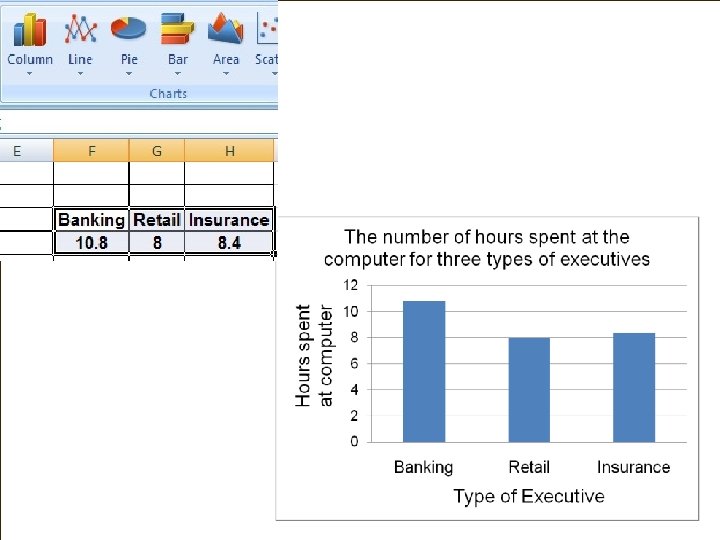
Type of executive 3 (banking, retail, insurance) Hours spent at computer 0. 05 10. 8 8 8. 4
If observed is bigger F than criticalthan F: If Fobserved is bigger Reject null & Significant! critical F: Reject null & Significant! If p value is less than 0. 05: Reject null & Significant! 11. 46 2 11. 46 / 2 = 5. 733 3. 88 2 12 0. 0179
Yes F (2, 12)= 5. 73; p < 0. 05 The number of hours spent at the computer was compared for three types of executives. The average hours spent was 10. 8 for banking executives, 8 for retail executives, and 8. 4 for insurance executives. An ANOVA was conducted and we found a significant difference in the average number of hours spent at the computer for these three groups , (F (2, 12) = 5. 73; p < 0. 05).
Number of observations in each group Average for each group Just add up all scores
“SS” = “Sum of Squares” - will be given for exams Number of groups minus one (k – 1) 3 -1=2 Number of people minus number of groups (n – k) 15 -3=12
SS between df between SS within df within MS between MS within
Writing Assignment - Quiz 1. When do you use a t-test and when do you use an ANOVA 2. What is the formula for degrees of freedom in a two-sample t-test 3. What is the formula for degrees of freedom “between groups” in ANOVA 4. What is the formula for degrees of freedom “within groups” in ANOVA 5. Daphne compared running speed for three types of running shoes • What is the independent variable? • What is the dependent variable? • How many factors do we have (what are they)? • How many treatments do we have (what are they)? 6. How are “levels”, “groups”, “conditions” “treatments” related? 7. How are “significant difference”, “p< 0. 05”, “we reject the null”, and “we found a main effect” related? 8. Draw and match each with proper label iability r a V l a Tot Group n e e w Bet ility Variab roup G n i h Wit ility b a i r a V
Let’s try one An ANOVA was conducted comparing “best racquet” scores for different types of tennis racquets. The results were: F(4, 45) = 9. 49; p < 0. 05. What should we conclude? a. we rejected the null hypothesis correct b. we did not reject the null hypothesis F(4, 45) = 9. 49; p < 0. 01
Let’s try one An ANOVA was conducted comparing “best racquet” scores for different types of tennis racquets. The results were: F(4, 45) = 9. 49; p < 0. 05. But Julia now wants to know if she can reject the null with an alpha of at 0. 01. In this study ___ a. we rejected the null hypothesis correct b. we did not reject the null hypothesis F(4, 45) = 9. 49; p < 0. 01
Let’s try one An ANOVA was conducted comparing ratings for the best Brand of skis (4 FRNT, K 2, and Rossignol). For each brand of ski we rated 10 skis. Degrees of freedom between is _____; degrees of freedom within is ____ a. 30; 3 b. 3; 30 c. 27; 2 d. 2; 27 correct .
Let’s try one An ANOVA was conducted comparing ratings for the best Brand of skis (4 FRNT, K 2, and Rossignol). For each brand of ski we rated 10 skis. Mean Square between is _____; Mean Square within is ____ a. 6. 9, 1. 5 b. 1. 5, 6. 9, correct c. 13. 8, 41. 5 d. 41. 5, 13. 8 .
Let’s try one An ANOVA was conducted comparing ratings for the best Brand of skis (4 FRNT, K 2, and Rossignol). For each brand of ski we rated 10 skis. The F ratio is: a. . 25 b. 1 c. 4. 51 correct d. 25 .
Let’s try one An ANOVA was conducted comparing ratings for the best Brand of skis (4 FRNT, K 2, and Rossignol). Alpha = 0. 05. Please complete this ANOVA table. We should: a. reject the null hypothesis correct b. not reject the null hypothesis Observed F bigger than Critical F p <. 05
Let’s try one An ANOVA was conducted comparing ratings for the best Brand of skis (4 FRNT, K 2, and Rossignol). Alpha = 0. 01. Please complete this ANOVA table. We should: a. reject the null hypothesis b. not reject the null hypothesis correct Observed F bigger than Critical F p NOT <. 01
Let’s try one An ANOVA was conducted comparing ratings for the best Brand of skis (4 FRNT, K 2, and Rossignol). The best rated brand of skis was ____ a. 4 FRNT b. K 2 c. Rossignol correct
Let’s try one Tasi is a small business owner who wanted to know whether advertising campaign would make a difference in the average amount of money spent by her customers. She has two businesses, one in California and one in Florida. She completed an ad campaign in California, but had no advertising campaign in Florida. She then compared sales and completed a t-test using an alpha of 0. 01 The results are presented in this table. Which of the following best describes the results of her experiment: a. There is a significant difference t(98) = 2. 25; p <0. 01 b. There is not a significant difference t(98) = 2. 25; p <0. 01 c. There is a significant difference t(98) = 2. 25; n. s. d. There is not a significant difference t(98) = 2. 25; n. s. correct
Theodora is researcher who compares how different companies address workers’Let’s quality life and general productivity. She created a tryofone questionnaire that measured these two constructs and gave the test to 140 men and 140 women. Please refer to this table to answer the following question: Which of the following best describe Theodora’s findings on worker productivity? a. A t-test was calculated and there is a significant difference in productivity between the two groups t(278) = 3. 64; p < 0. 05 correct b. A t-test was calculated and there is no significant difference in productivity between the two groups t(278) = 3. 64; n. s. c. A t-test was calculated and there is a significant difference in productivity between the two groups t(280) = 3. 64; p < 0. 05 d. A t-test was calculated and there is no significant difference in productivity between the two groups t(280) = 3. 64; n. s.
Refer again to Theodora’s findings presented on the table. Let’s assume for this question Theodora set her alpha at 0. 01, which of the Let’s that try one following is true? a. Theodora found a significant difference between men and women’s quality of life, but not between men and women’s productivity. b. Theodora found a significant difference between men and women’s productivity, but not between men and women’s quality of life measures correct c. Theodora found a significant difference between men and women for both productivity and quality of life measures. d. Theodora found no significant difference between men and women for neither productivity nor quality of life measures.
. . Which of the following would represent a one-tailed test? a. Please test to see whether men or women are taller b. With an alpha of. 05 test whether advertising increases sales c. With an alpha of. 01 test whether management strategies correct affect worker productivity d. Does a stock trader’s education affect the amount of money they make in a year?
Which of the following represents a significant finding: a. p < 0. 05 correct b. the observed statistic (z score) is not bigger than critical value c. the observed z statistic is nearly zero d. do not reject the null hypothesis Careful with “exceeds”
A t-test was conducted to see whether “Bankers” or “Retailers” spend more time in front of their computer. Which best summarizes the results from this excel output: a. Bankers spent significantly more time in front of their computer screens than Retailers, t(3. 5) = 8; p < 0. 05 b. Bankers spent significantly more time in front of their computer screens than Retailers, t(8) = 3. 5; p < 0. 05 correct c. Retailers spent significantly more time in front of their computer screens than Bankers, t(3. 5) = 8; p < 0. 05 d. Retailers spent significantly more time in front of their computer screens than Bankers, t(8) = 3. 5; p < 0. 05 e. There was no difference between the groups
Let’s try one A t-test was conducted to see whether “Bankers” or “Retailers” spend more time in front of their computer. Which critical t would be the best to use a. 3. 5 b. 1. 859 c. 2. 306 correct d. . 004 e. . 008
Let’s try one A t-test was conducted to see whether “Bankers” or “Retailers” spend more time in front of their computer. How many bankers and retailers were measured a. 10 bankers were measured; 8 retailers were measured b. 10 bankers were measured; 10 retailers were measured c. 5 bankers were measured; 5 retailers were measured correct
Let’s try one An ANOVA was conducted and there appears to be a significant difference in the number of cookies sold as a result of the different levels of incentive F(2, 27) = ___; p < 0. 05. Please fill in the blank a. 3. 3541 b. . 00635 c. 6. 1363 correct d. 27. 00
An ANOVA was conducted and we found the following results: F(3, 12) = 3. 73 ____. Which is the best summary a. The critical F is 3. 89; we should reject the null b. The critical F is 3. 89; we should not reject the null c. The critical F is 3. 49; we should reject the null d. The critical F is 3. 49; we should not reject the nullcorrect Let’s try one
Let’s try one Agnes compared the heights of the women’s gymnastics team and the women’s basketball team. If she doubled the number of players measured (but ended up with the same means) what effect would that have on the results? a. the means are the same, so the t-test would yield the same results. b. the means are the same, but the variability would increase so it would be harder to reject the null hypothesis. c. the means are the same, but the variability would decrease so it would be easier to reject the null hypothesis. correct
Let’s try one Albert compared the heights of a small sample of 10 women from the women’s gymnastics team to the mean for the whole team (population). This is an example of a one-sample t-test. He found an observed t(9) =. 04, what should he do? a. Reject the null hypothesis b. Do not reject the null hypothesis correct c. There is not enough information
How many of these t-tests reach significance with alpha of 0. 05? a. 1 b. 2 c. 3 d. 4 correct A table of t-test
Relationship between advertising space and sales An advertising firm wanted to know whether the size of an ad in the margin of a website affected sales. They compared 4 ad sizes (tiny, small, medium and large). They posted the ads and measured sales. This is an example of a _____. a. correlation b. t-test c. one-way ANOVA d. two-way ANOVA correct
According to the Central Limit Theorem, which is false? a. As n ↑ x will approach µ b. As n ↑ curve will approach normal shape c. As n ↑ curve variability gets bigger correct d. As n ↑
Let’s try one Albert compared the race times of 20 male and female jockeys for race horses. He wanted to know who averaged faster rides. Which of the following is true? a. The IV is gender while the DV is time to finish a race correct b. The IV is time to finish a race while the DV is gender
Let’s try one Albert compared the race times of 20 male and female jockeys for race horses. He wanted to know who averaged faster rides. Which of the following is true? a. The null hypothesis is that there is no difference in race times between the genders correct b. The null hypothesis is that there is a difference between the genders
Let’s try one Which would be a Type II error? Albert compared the race times of 20 male and female jockeys for race horses. He wanted to know who averaged faster rides. A Type I Error would claim that: a. b. c. d. There is a difference when in fact there isn’t one There is no difference when in fact there isn’t one correct There is no difference when in fact there is a difference
Let’s try one Albert compared the race times of 20 male and female jockeys for race horses. He wanted to know who averaged faster rides. He concluded p < 0. 05 what does this mean? a. There is a significant difference between the means b. There is no significant difference between the means correct
Let’s try one Albert compared the race times of 20 male and female jockeys for race horses. He wanted to know who averaged faster rides. Which of the following is true? a. This is a one-tailed test b. This is a two-tailed test correct
Let’s try one Albert compared the race times of 20 male and female jockeys for race horses. He wanted to know who averaged faster rides. Which of the following is true? a. b. This is a quasi, between participant design correct This is a quasi, within participant design This is a true, between participant design This is a true, within participant design
Let’s try one Albert compared the race times of 20 male and female jockeys for race horses. He wanted to know who averaged faster rides. Which of the following is best describes this study? a. correlation b. t-test correct c. one-way ANOVA d. two-way ANOVA
Let’s try one Albert compared the race times of 20 male and female jockeys for race horses. He wanted to know who averaged faster rides. Which of the following is best describes his results? a. t(198) = 2. 38; p < 0. 05 correct b. t(198) = 2. 38; ns c. t(198) = 1. 97; p < 0. 05 d. t(198) = 1. 97; ns
Let’s try one Albert compared the race times of 20 male and female jockeys for race horses. He wanted to know who averaged faster rides. Which of the following is best describes his results? a. t(198) = 2. 38; p < 0. 01 b. t(198) = 2. 38; ns correct c. t(198) = 1. 97; p < 0. 01 d. t(198) = 1. 97; ns
An ANOVA was conducted comparing which type of horse is the fastest (Arabians, Thoroughbreds, or Quarter Horses). We measured how long it took to finish the race. We measured 11 of each type of horse (33 altogether) Please complete this ANOVA table. Degrees of freedom between is _____; degrees of freedom within is ____ a. 30; 2 b. 2; 30 c. 80; 3 correct d. 3; 80
An ANOVA was conducted comparing which type of horse is the fastest (Arabians, Thoroughbreds, or Quarter Horses). We measured how long it took to finish the race. We measured 11 of each type of horse (33 altogether) Mean Square Between is ____ while Mean Square Within is ______ a. 80; 2 b. 2; 80 c. 30; 40 d. 40; 30 correct
An ANOVA was conducted comparing which type of horse is the fastest (Arabians, Thoroughbreds, or Quarter Horses). We measured how long it took to finish the race. We measured 11 of each type of horse (33 altogether) Please complete this ANOVA table. The F ratio is a. . 75 b. 1. 3 c. 1. 5 correct d. 1. 75
The critical F ratio a. 2. 84 b. 2. 92 c. 3. 23 d. 3. 32 correct
The observed F is 1. 3 and the critical F ratio is 3. 32. What should we conclude? a. reject the null hypothesis b. do not reject the null hypothesis correct c. p < 0. 5 d. both a and c are true
An ANOVA was conducted comparing which type of horse is the fastest (Arabians, Thoroughbreds, or Quarter Horses). We measured how long it took to finish the race. We measured 11 of each type of horse (33 altogether) Please complete this ANOVA table. The observed F is 2 and the critical F ratio is 3. 32. F(2, 30) = ___; n. s. Please fill in the blank a. 3. 32 b. 1. 3 c. 30 correct d. 40
Relationship between advertising space and sales An advertising firm wanted to know whether the size of an ad in the margin of a website affected sales. They compared 4 ad sizes (tiny, small, medium and large). They posted the ads and measured sales. This is an example of a _____. a. correlation b. t-test c. one-way ANOVA d. two-way ANOVA correct
Victoria was also interested in the effect of vacation time on productivity of the workers in her department. In her department some workers took vacations and some did not. She measured the productivity of those workers who did not take vacations and the productivity of those workers who did (after they returned from their vacations). This is an example of a _____. a. quasi-experiment correct b. true experiment c. correlational study Let’s try one
Ian was interested in the effect of incentives for girl scouts on the number of cookies sold. He randomly assigned girl scouts into one of three groups. The three groups were given one of three incentives and he looked to see who sold more cookies. The 3 incentives were: 1) Trip to Hawaii, 2) New Bike or 3) Nothing. This is an example of a ___. a. quasi-experiment b. true experiment c. correlational study correct Let’s try one
Ian was interested in the effect of incentives and age for girl scouts on the number of cookies sold. He randomly assigned girl scouts into one of three groups. The three groups were given one of three incentives and he looked to see who sold more cookies. The 3 incentives were: 1) Trip to Hawaii, 2) New Bike or 3) Nothing. He also measured their age. This is an example of a ___. a. quasi-experiment b. true experiment c. correlational study d. mixed design correct Let’s try one
Relationship between movie times and amount of concession purchases. Marietta is a manager of a movie theater. She wanted to know whethere is a difference in concession sales for afternoon (matinee) movies vs. evening movies. She took a random sample of 25 purchases from the matinee movie (mean of $7. 50) and 25 purchases from the evening show (mean of $10. 50). She compared these two means. This is an example of a _____. a. correlation b. t-test correct c. one-way ANOVA d. two-way ANOVA Let’s try one
Relationship between movie times and amount of concession purchases. Matinee correct d. Concession b. Evening Concession purchase c. Movie Times Concession purchase a. Concession purchase Marietta is a manager of a movie theater. She wanted to know whethere is a difference in concession sales for afternoon (matinee) movies and evening movies. She took a random sample of 25 purchases from the matinee movie (mean of $7. 50) and 25 purchases from the evening show (mean of $10. 50). Which of the following would be the appropriate graph for these data Movie Times Let’s try one
Relationship between daily fish-oil capsules and cholesterol levels in men. Pharmaceutical firm tested whether fish-oil capsules taken daily decrease cholesterol. They measured cholesterol levels for 30 male subjects and then had them take the fish-oil daily for 2 months and tested their cholesterol levels again. Then they compared the mean cholesterol before and after taking the capsules. This is an example of a _____. a. correlation b. t-test c. one-way correct ANOVA d. two-way ANOVA
Relationship between GPA and starting salary Starting Salary Elaina was interested in the relationship between the grade point average and starting salary. She recorded for GPA. and starting salary for 100 students and looked to see if there was a relationship. This is an example of a _____. a. correlation correct b. t-test c. one-way ANOVA d. two-way ANOVA GPA Relationship between GPA and Starting salary Let’s try one
Match each level of significance to each situation. Which situation would be associated with a critical z of 1. 96? a. A b. B c. C d. D Critical z values One-tailed 5% 1% α = 0. 05 Hint: Possible values 1. 64 1. 96 2. 33 2. 58 Significance level =. 05 α = 0. 01 Significance level =. 01 Two-tailed 2. 5%. 5% -1. 64 or +1. 64 A -1. 96 or +1. 96 C -2. 58 or +2. 58 -2. 33 or +2. 33 B D
Let’s try one In a one-way ANOVA we have three types of variability. Which picture best depicts the random error variability (also known as the within variability)? a. Figure 1 b. Figure 2 1. c. Figure 3 d. All of the correct above 2. 3.