Screen Lecturers desk Row A Row B Row

Screen Lecturer’s desk Row A Row B Row A 15 14 12 11 10 13 20 Row B 19 24 23 22 21 Row C 20 19 28 27 26 25 24 23 Row D 22 21 20 19 30 29 28 27 26 25 24 23 Row E 23 22 21 20 19 35 34 33 32 31 30 29 28 27 26 Row F 25 35 34 33 32 31 30 29 28 27 26 Row G 37 36 35 34 33 32 31 30 29 28 41 40 39 38 37 36 35 34 33 32 31 30 Row C Row D Row E Row F Row G Row H Row L 33 31 29 25 23 22 21 21 8 7 6 5 3 4 Row A 2 1 3 2 Row B 9 8 7 6 5 4 12 11 10 9 8 7 6 5 4 3 2 1 24 23 22 21 20 19 18 17 16 15 14 13 12 11 10 9 8 7 6 5 4 3 2 1 Row F 25 24 23 22 21 20 19 18 17 16 15 14 13 12 11 10 9 8 7 6 5 4 3 2 1 Row G Row H 27 26 25 24 23 22 21 20 19 18 17 16 15 14 13 12 29 Row J 28 27 26 25 24 23 22 21 20 19 18 17 16 15 14 13 12 11 10 9 8 7 6 5 4 3 2 1 Row J 29 Row K 28 27 26 25 24 23 22 21 20 19 18 17 16 15 14 13 12 11 10 9 8 7 6 5 4 3 2 1 Row K 25 Row L 24 23 22 21 20 19 18 17 16 15 14 13 12 11 10 9 20 19 Row M 18 4 3 Row N 15 14 13 12 11 10 9 8 7 6 5 4 3 2 1 Row P 15 14 13 12 11 10 9 8 7 6 5 4 3 2 1 4 3 32 31 30 29 28 27 26 Row M 9 18 17 18 16 17 15 16 18 14 15 17 18 13 14 13 16 17 12 11 10 15 16 14 15 13 12 11 10 14 17 16 15 14 13 12 11 10 9 13 8 7 6 5 table 15 14 13 12 11 10 9 8 7 6 Projection Booth 5 2 1 1 1 Row C Row D Row E 11 10 9 8 7 6 5 4 3 2 2 1 1 1 Row L Row M Harvill 150 renumbered Left handed desk Row H

Screen Kristina Lecturer’s desk Row A Attila Row C Row B Row A 15 14 12 11 10 13 20 Row B 19 24 23 22 21 Row C 20 19 28 27 26 25 24 23 Row D 22 21 20 19 30 29 28 27 26 25 24 23 Row E 23 22 21 20 19 35 34 33 32 31 30 29 28 27 26 Row F 25 35 34 33 32 31 30 29 28 27 26 Row G 37 36 35 34 33 32 31 30 29 28 41 40 39 38 37 36 35 34 33 32 31 30 25 Row D Row E Row F Row G Row H Row L 33 31 29 23 22 21 Ha nn a h 21 8 7 6 5 Row A 2 1 3 2 Row B 8 7 6 5 4 12 11 10 9 8 7 6 5 4 3 2 1 24 23 22 21 20 19 18 17 16 15 14 13 12 11 10 9 8 7 6 5 4 3 2 25 24 23 22 21 20 19 18 17 16 15 14 13 12 11 10 9 8 7 6 5 4 3 2 Row H 27 26 25 24 23 22 21 20 19 18 17 16 15 14 13 12 29 Row J 28 27 26 25 24 23 22 21 20 19 18 17 16 15 14 13 12 11 10 9 8 7 6 5 4 3 2 1 Row J 29 Row K 28 27 26 25 24 23 22 21 20 19 18 17 16 15 14 13 12 11 10 9 8 7 6 5 4 3 2 1 Row K 25 Row L 24 23 22 21 20 19 18 17 16 15 14 13 12 11 10 9 20 19 Row M 18 4 3 Row N 15 14 13 12 11 10 9 8 7 6 5 4 3 2 1 Row P 15 14 13 12 11 10 9 8 7 6 5 4 3 2 1 4 3 18 17 18 16 17 15 16 18 14 15 17 18 13 14 13 16 17 12 11 10 15 16 14 15 13 12 11 10 14 17 16 15 14 13 12 11 10 9 13 8 7 6 5 table 14 13 12 11 10 9 8 7 6 Projection Booth Harvill 150 renumbered 3 4 9 32 31 30 29 28 27 26 Row M 9 5 2 1 1 Row C Row D le l e h. Row F Row E M ic 1 1 Row G 11 10 9 8 7 6 5 4 3 2 2 1 1 1 Row L Row M e Sez n 1 Left handed desk Row H

Introduction to Statistics for the Social Sciences SBS 200 - Lecture Section 001, Spring 2018 Room 150 Harvill Building 9: 00 - 9: 50 Mondays, Wednesdays & Fridays. 2/5/18 http: //www. youtube. com/watch? v=o. SQJP 40 Pc. GI

In nearly every class we will use clickers to answer questions in class and participate in interactive class demonstrations e v a h u o y f i d e r Even e t s i g e r t e y n a c t o u n o y r e k c i l c r e u t a yo p i c i t r a p still
 Please read chapters 1 - 5")
Schedule of readings Before next exam (February 9) Please read chapters 1 - 5 in Open. Stax textbook Please read Appendix D, E & F online On syllabus this is referred to as online readings 1, 2 & 3 Please read Chapters 1, 5, 6 and 13 in. Plous Chapter 1: Selective Perception Chapter 5: Plasticity Chapter 6: Effects of Question Wording and Framing Chapter 13: Anchoring and Adjustment

Everyone will want to be enrolled in one of the lab sessions Labs c ontinu e this w eek

Overview Frequency distributions The normal curve Mean, Median, Mode, Trimmed Mean Standard deviation, Variance, Range Mean Absolute Deviation Skewed right, skewed left unimodal, bimodal, symmetric

Deviation scores: The amount by which observations deviate on either side of their mean (x - µ) Deviation scores (x - µ) Diallo is 0” Preston is 2” Mike is -4” Hunter is -2 Shea is 4 David is 0” How far away is each score from the mean? Mean Diallo Mike Preston Shea Mike Hunte r How do we find each deviation score? Prest on Hunt er (x - µ) Diall Mik o e Presto Find distance of each person from the mean n (subtract their score from mean) Deviation score (x - µ) = ? 5’ 8” 5’ 9” 5’ 10’ 5’ 11” 6’ 0” 6’ 1” 6’ 2” 6’ 3” 6’ 4” - 6’ 0” = - 4” 6’ 0” = - 3” 6’ 0” = - 2” 6’ 0” = - 1” 6’ 0 = 0 6’ 0” = + 1” 6’ 0” = + 2” 6’ 0” = + 3” 6’ 0” = + 4” Diallo

Deviation scores: The amount by which observations deviate on either side of their mean (x - µ) Deviation scores (x - µ) Diallo is 0” Preston is 2” Mike is -4” How far away is each score from the mean? Hunter is -2 Shea is 4 David is 0” Mean Diallo Mike Deviation score Preston Shea (x - µ) = ? 5’ 8” 5’ 9” 5’ 10’ 5’ 11” 6’ 0” 6’ 1” 6’ 2” 6’ 3” 6’ 4” - Rememb er It’s rela tive to the m ean Based o differe n from t nce he mea n 6’ 0” = - 4” 6’ 0” = - 3” 6’ 0” = - 2” 6’ 0” = - 1” 6’ 0 = 0 6’ 0” = + 1” 6’ 0” = + 2” 6’ 0” = + 3” 6’ 0” = + 4”

Standard deviation: The average amount by which observations deviate on either side of their mean Deviation scores (x - µ) Diallo is 0” Preston is 2” Mike is -4” Hunter is -2 How far away is each score from the mean? Shea is 4 David is 0” Mean Diallo Mike Preston Shea How do we find the average height? Σx = average height N How do we find the average spread? Σ(x - µ) = average deviation N Add up Deviation scores Σ (x - µ) = ? 5’ 8” 5’ 9” 5’ 10’ 5’ 11” 6’ 0” 6’ 1” 6’ 2” 6’ 3” 6’ 4” - 6’ 0” = - 4” 6’ 0” = - 3” 6’ 0” = - 2” 6’ 0” = - 1” 6’ 0 = 0 6’ 0” = + 1” 6’ 0” = + 2” 6’ 0” = + 3” 6’ 0” = + 4” Σ(x - x) = 0 Σ(x - µ) = 0

Standard deviation: The average amount by which observations deviate on either side of their mean How far away is each score from the mean? Deviation scores (x - µ) Diallo is 0” Preston is 2” Mike is -4” Hunter is -2 Shea is 4 David is 0” Mean Diallo Mike 2 Σ(x - µ) N Preston Shea Σ (x - µ) = ? Square the deviation Σ(x s 2 - x) 2 Σ(x - µ) 5’ 8” 5’ 9” 5’ 10’ 5’ 11” 6’ 0” 6’ 1” 6’ 2” 6’ 3” 6’ 4” - 6’ 0” = - 4” 6’ 0” = - 3” 6’ 0” = - 2” 6’ 0” = - 1” 6’ 0 = 0 6’ 0” = + 1” 6’ 0” = + 2” 6’ 0” = + 3” 6’ 0” = + 4” Σ(x - x) = 0 Σ(x - µ) = 0 Big proble m

Standard deviation: The average amount by which observations deviate on either side of their mean How far away is each score from the mean? Deviation scores (x - µ) Diallo is 0” Preston is 2” Mike is -4” Hunter is -2 Shea is 4 David is 0” Mean Step 1 Find the mean Diallo Step 2 Mike Find each deviation scoreΣ (x - µ) = ? Preston Shea Step 4 Divide by n and take square root 2 Σ(x - µ) N 5’ 8” - 6’ 0” = - 4” 5’ 9” - 6’ 0” = - 3” 5’ 10’ - 6’ 0” = - 2” 5’ 11” Step - 6’ 0” = 3 - 1” Square 6’ 0”each - 6’ 0 deviation = 0 6’ 1” add - 6’ 0”them = + 1” up And 6’ 2” - 6’ 0” = + 2” 6’ 3” - 6’ 0” = + 3” 6’ 4” - 6’ 0” = + 4” 2 Σ(x - x) 2 Σ(x - µ) Σ(x - x) = 0 Σ(x - µ) = 0 score

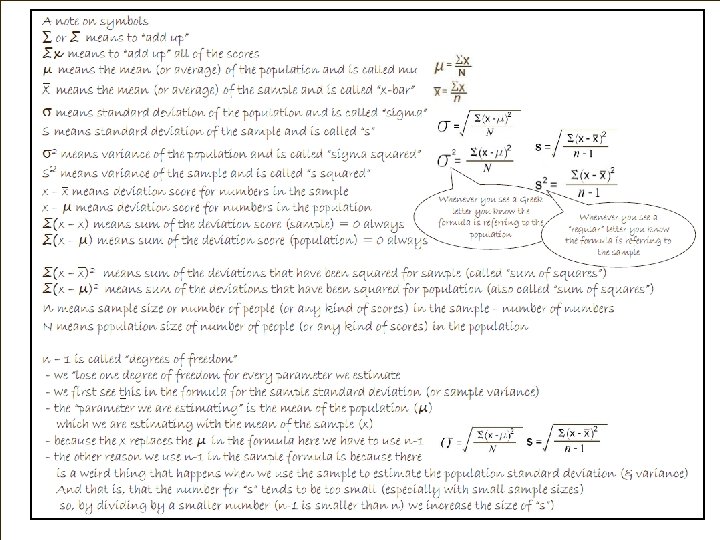
Standard deviation: The average amount by which observations deviate on either side of their mean These would be helpful to know by heart – please memorize these formula

Standard deviation: The average amount by which observations deviate on either side of their mean What do these two formula have in common?

Standard deviation: The average amount by which observations deviate on either side of their mean What do these two formula have in common?

Standard deviation: The average amount by which observations deviate on either side of their mean “n-1” is Degrees of Freedom” How do these formula differ?

Standard deviation: The average amount by “Sum which observations deviate on either side of their mean of Squar es” Remember, it’s relative to the mean “n-1” is “Degrees of Freedom” Based on difference from the mean Please memorize these Deviation scores Diallo is 0” Preston is 2” Mike is -4” Hunter is -2 Shea is 4 David 0” Generally, (on average) how far away is each score from the mean? Mean Diallo Remember, We are Preston Shea thinking Mike in terms of “deviations”

Raw scores, z scores & probabilities Please note spatially where 1 standard deviation falls on the curve

Raw scores, z scores & probabilities 68% 95% Please note spatially where 1 standard deviation falls on the curve 99. 7%

1 sd above and below mean 68% 2 sd above and below mean 95% 3 sd above and below mean 99. 7% These would be helpful to know by heart – please memorize areas

Summary of 7 facts to memorize

Writing Assignment – Pop Quiz

Writing Assignment – Pop Quiz

Writing Assignment – Pop Quiz Distance from the mean 2 inches 4 inches X Taller Shorter X Taller X Pre sto mea n is 2” n (t alle taller th an m an the ost) Mik e mea is 4” s n (s hort e hor ter r than th mos e t) Dia llo Equal to mean mea is exa 0 inches n (h ctly alf t sam Half are Shorter alle e r ha heigh lf sh t orte as r)

Writing Assignment – Pop Quiz Parameter Sigma – standard deviation - population mu – a mean – an average - population x-bar – a mean – an average - sample statistic s – standard deviation - sample statistic The number of “standard deviations” the score is from the mean population Sigma squared and s squared - variance Sigma is parameter (population) s is statistic (sample) Deviation scores (x-µ) for population (parameter) (x-x) is statistic (sample) Sum of squares On left is statistic on right is parameter Standard deviation s is statistic sigma is parameter Degrees of freedom sample

- Slides: 30