Screen Alyson Lecturers desk Row A Chris Row


 Please read chapters")


- Slides: 25
Screen Alyson Lecturer’s desk Row A Chris Row C Row B Row A 15 14 12 11 10 13 20 Row B 19 24 23 22 21 Row C 20 19 28 27 26 25 24 23 Row D 22 21 20 19 30 29 28 27 26 25 24 23 Row E 23 22 21 20 19 35 34 33 32 31 30 29 28 27 26 Row F 25 35 34 33 32 31 30 29 28 27 26 Row G 37 36 35 34 33 32 31 30 29 28 41 40 39 38 37 36 35 34 33 32 31 30 25 Row D Row E Row F Row G Row H Row L 33 31 29 23 22 21 Tr ey 21 8 7 6 5 Row A 2 1 3 2 Row B 8 7 6 5 4 12 11 10 9 8 7 6 5 4 3 2 1 24 23 22 21 20 19 18 17 16 15 14 13 12 11 10 9 8 7 6 5 4 3 2 25 24 23 22 21 20 19 18 17 16 15 14 13 12 11 10 9 8 7 6 5 4 3 2 Row H 27 26 25 24 23 22 21 20 19 18 17 16 15 14 13 12 29 Row J 28 27 26 25 24 23 22 21 20 19 18 17 16 15 14 13 12 11 10 9 8 7 6 5 4 3 2 1 Row J 29 Row K 28 27 26 25 24 23 22 21 20 19 18 17 16 15 14 13 12 11 10 9 8 7 6 5 4 3 2 1 Row K 25 Row L 24 23 22 21 20 19 18 17 16 15 14 13 12 11 10 9 20 19 Row M 18 4 3 Row N 15 14 13 12 11 10 9 8 7 6 5 4 3 2 1 Row P 15 14 13 12 11 10 9 8 7 6 5 4 3 2 1 4 3 18 17 18 16 17 15 16 18 14 15 17 18 13 14 13 16 17 12 11 10 15 16 14 15 13 12 11 10 14 17 16 15 14 13 12 11 10 9 13 8 7 6 5 table 14 13 12 11 10 9 8 7 6 Projection Booth Harvill 150 renumbered 3 4 9 32 31 30 29 28 27 26 Row M 9 5 2 1 1 Row C Row D Row E o Fl 1 Row F 1 Row G 11 10 9 8 7 6 5 4 3 2 2 1 1 1 Row L Row M Jun 1 Left handed desk Row H
e v a h u o y f i d e r Even e t s i g e r t e y n a c t o u n o y r e k c i l c r e u t a yo p i c i t r a p still The Gre e She n ets
Introduction to Statistics for the Social Sciences SBS 200 - Lecture Section 001, Fall 2018 Room 150 Harvill Building 10: 00 - 10: 50 Mondays, Wednesdays & Fridays. http: //www. youtube. com/watch? v=o. SQJP 40 Pc. GI
Everyone will want to be enrolled in one of the lab sessions e u n i t n o k c e e s b w La this
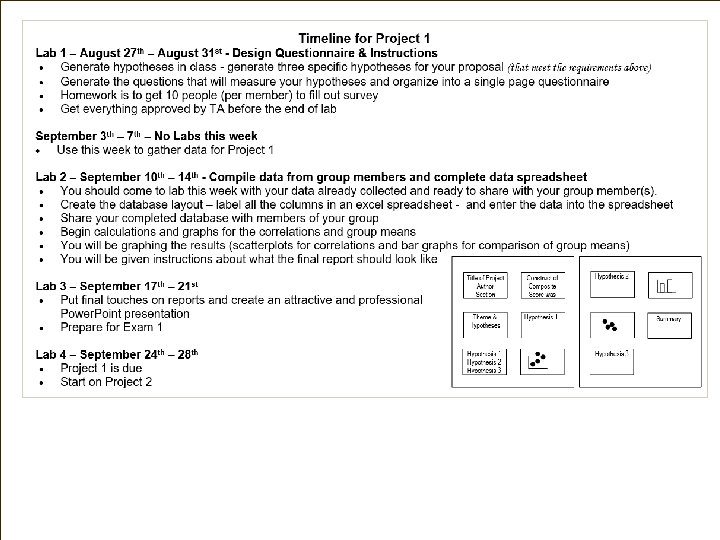
Schedule of readings Before next exam (September Study Guide posted 21) Please read chapters 1 - 5 in Open. Stax textbook Please read Appendix D, E & F online On syllabus this is referred to as online readings 1, 2 & 3 Please read Chapters 1, 5, 6 and 13 in Plous Chapter 1: Selective Perception Chapter 5: Plasticity Chapter 6: Effects of Question Wording and Framing Chapter 13: Anchoring and Adjustment
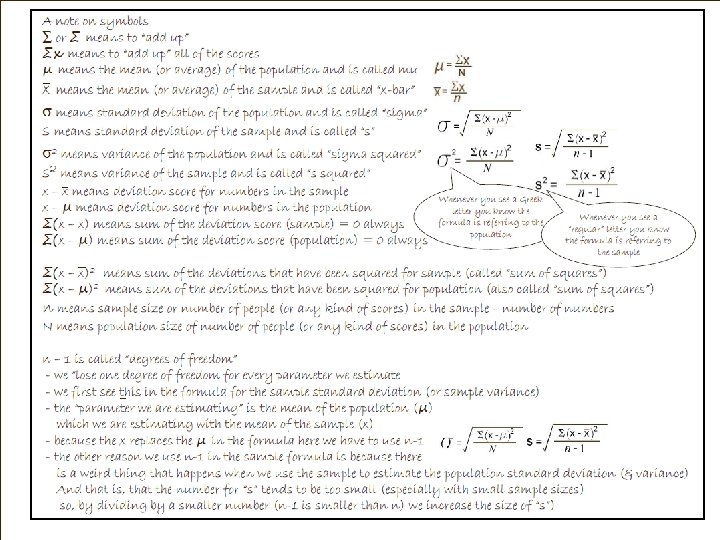
Summary of 7 facts to memorize
Writing Assignment – Pop Quiz
Writing Assignment – Pop Quiz
Writing Assignment – Pop Quiz Distance from the mean 2 inches 4 inches X Taller Shorter X Taller X Pre sto mea n is 2” n (t alle taller th an m an the ost) Mik e mea is 4” s n (s hort e hor ter r than th mos e t) Dia llo Equal to mean mea is exa 0 inches n (h ctly alf t sam Half are Shorter alle e r ha heigh lf sh t orte as r)
Writing Assignment – Pop Quiz Parameter Sigma – standard deviation - population mu – a mean – an average - population x-bar – a mean – an average - sample statistic s – standard deviation - sample statistic The number of “standard deviations” the score is from the mean population Sigma squared and s squared - variance Sigma is parameter (population) s is statistic (sample) Deviation scores (x-µ) for population (parameter) (x-x) is statistic (sample) Sum of squares On left is statistic on right is parameter Standard deviation s is statistic sigma is parameter Degrees of freedom sample
Due Today
Due Today
Review of Homework Each of these. Worksheet are deviation scores 3 – 5 = -2 6 – 5 = +1 50 2 5 2 -22= 4 -2 1 3 -1 0 3 -3 -1 1 -1 Σ(x - µ) = 0 0 36 = 2 10 - 1 4. 5 8 4 1 9 1 0 9 9 1 1 1 This is the standard deviation! 12= 1 36 4 6
Review of Homework Worksheet -12= 1 5 – 6 = -1 -1 2 -1 -1 3 60 2. 4 6 1 8 – 6 = +2 0 -1 3 1 -5 0 52 = 10 - 1 5. 52. 4 9 1 4 1 1 9 2 2= 4 0 1 9 1 25 52 5 8
If it is complete and correct, hand it in now Do not hand it in until it: • Is correct, complete and stapled • If it is not complete and correct, consider this an “extension” and hand it in next time
Exam 1 Review
Let’s try one Albert compared the time required to finish the race for 20 female jockeys and 20 male jockeys riding race horses. He wanted to know who averaged faster rides. Which of the following is true? a. The IV is gender while the DV is time to finish a race b. The IV is time to finish a race while the DV is gender
Let’s try one Albert compared the time required to finish the race for 20 female jockeys and 20 male jockeys riding race horses. He wanted to know who averaged faster rides. The independent variable is a(n) _____ a. b. c. d. Nominal level of measurement Ordinal level of measurement Interval level of measurement Ratio level of measurement
Let’s try one Albert compared the time required to finish the race for 20 female jockeys and 20 male jockeys riding race horses. He wanted to know who averaged faster rides. The dependent variable is a(n) _____ a. b. c. d. Nominal level of measurement Ordinal level of measurement Interval level of measurement Ratio level of measurement
Let’s try one Albert compared the time required to finish the race for 20 female jockeys and 20 male jockeys riding race horses. He wanted to know who averaged faster rides. The independent variable is a(n) _____ a. Discrete b. Continuous
Let’s try one Albert compared the time required to finish the race for 20 female jockeys and 20 male jockeys riding race horses. He wanted to know who averaged faster rides. The dependent variable is a(n) _____ a. Discrete b. Continuous
Let’s try one Albert compared the time required to finish the race for 20 female jockeys and 20 male jockeys riding race horses. He wanted to know who averaged faster rides. Which of the following is true? a. b. c. d. This is a quasi, between participant design This is a quasi, within participant design This is a true, between participant design This is a true, within participant design