Scope o Operations Management includes n n n


 o o o Flexibility Inventory management Supply chain")


 Productivity = Outputs Inputs Output Labor Output Machine Output")
 Outputs Productivity = Labor+Machine Outputs Productivity = Labor+Capital+Energy")
 Productivity = Goods or service produced All input used")


 Cost-Volume Relationships")
 Cost-Volume Relationships 0 e u n e v e r l a")


- Slides: 51
Scope o Operations Management includes: n n n n n Capacity planning Assuring quality Supply chain management Inventories Aggregate planning MRP Lean operation Scheduling KPIs chapter 6 chapter 9, 10 chapter 11 chapter 12 chapter 13 chapter 14 chapter 15 chapter 16
Introduction o Operations Management is: The management of systems or processes that create goods and/or provide services
The Organization The Three Basic Functions of business organizations. Organization Marketing Operations Finance
The Basic Functions o o o Marketing – generates demand Production/operations – creates the product Finance/accounting – tracks how well the organization is doing, pays bills, collects the money
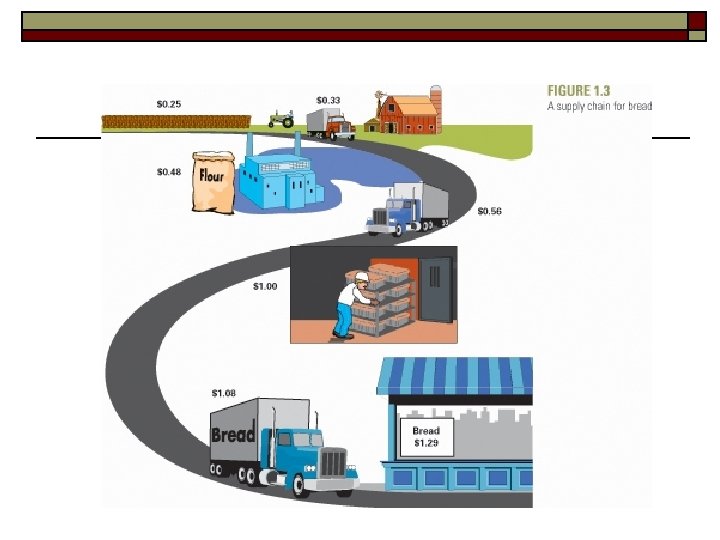
Supply Chain Suppliers’ Suppliers Direct Suppliers Producer Distributor Final Consumer Supply Chain: A sequence of activities And organizations involved in producing And delivering a good or service
Value-added The operations function involves the conversion of inputs into outputs Value added Inputs Land Labor Capital Transformation/ Conversion process Outputs Goods Services Feedback Control Feedback
Food Processor Inputs Processing Outputs Raw Vegetables Metal Sheets Water Energy Labor Building Equipment Cleaning Making cans Cutting Cooking Packing Labeling Canned vegetables
Hospital Process Inputs Doctors, nurses Hospital Medical Supplies Equipment Laboratories Processing Examination Surgery Monitoring Medication Therapy Outputs Healthy patients
The goods-service continuum Goods Service Surgery, teaching Song writing, software development Computer repair, restaurant meal Automobile Repair, fast food Home remodeling, retail sales Automobile assembly, steel making
Goods & Service Characteristic Goods Service Customer contact Low High Uniformity of input High Low Labor content Low High Uniformity of output High Low Output Tangible Intangible Measurement of productivity Easy Difficult Opportunity to correct problems High Low Inventory Much Little Evaluation Easier Difficult Patentable Usually Not usual
Competitiveness Differentiation – better or at least different o Cost - cheaper o Quick response – more responsive o
Businesses Compete Using Marketing o o o Identifying consumer wants and needs Pricing Advertising and promotion
Businesses Compete Using Operation o o o Product and service design Cost Location Quality Quick response
Businesses Compete Using Operation (cont. ) o o o Flexibility Inventory management Supply chain management Service and service quality Managers and workers
Strategy o Mission n o Mission Statement n o Provide detail and scope of mission Strategies n o States the purpose of an organization Goals n o The reason for existence for an organization Plans for achieving organizational goals Tactics n The methods and actions taken to accomplish strategies
Planning and Decision Making Mission Goals Organizational Strategies Functional Goals Finance Strategies Tactics Operating procedures Marketing Strategies Tactics Operating procedures Operations Strategies Tactics Operating procedures
SWOT o o S : Strengths W : Weaknesses O : Opportunities T : Threats
Key External Factors o o o Economic conditions Political conditions Legal environment Technology Competition Markets
Key Internal Factors o o o o Human Resources Facilities and equipment Financial resources Customers (loyalty, understanding) Products and services Technology Suppliers
Output - Input Labor Output Machine Raw materials Electricity / water / etc. Capital Inventory Others Products Processes Or Services
Productivity Partial measures output/(single input) Productivity = Outputs Inputs Output Labor Output Machine Output Capital Output Energy
Productivity Multi-factor measures output/(multiple inputs) Outputs Productivity = Labor+Machine Outputs Productivity = Labor+Capital+Energy
Productivity Total measure output/(total inputs) Productivity = Goods or service produced All input used to produce them
Productivity Growth = Current Period Productivity – Previous Period Productivity
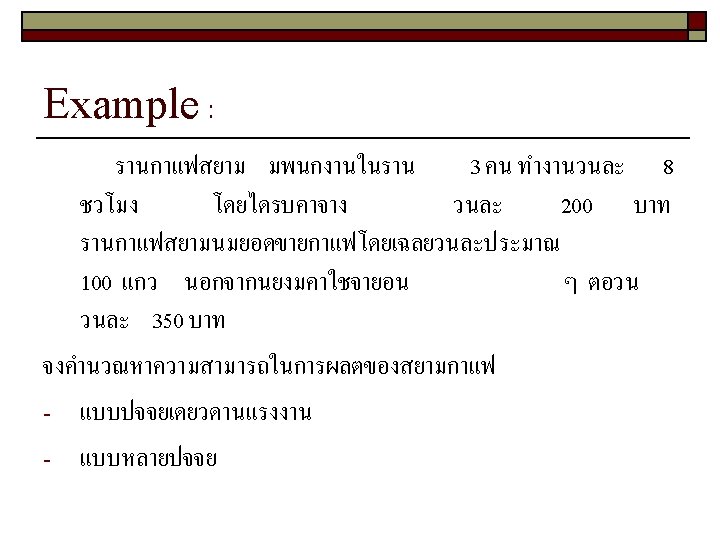
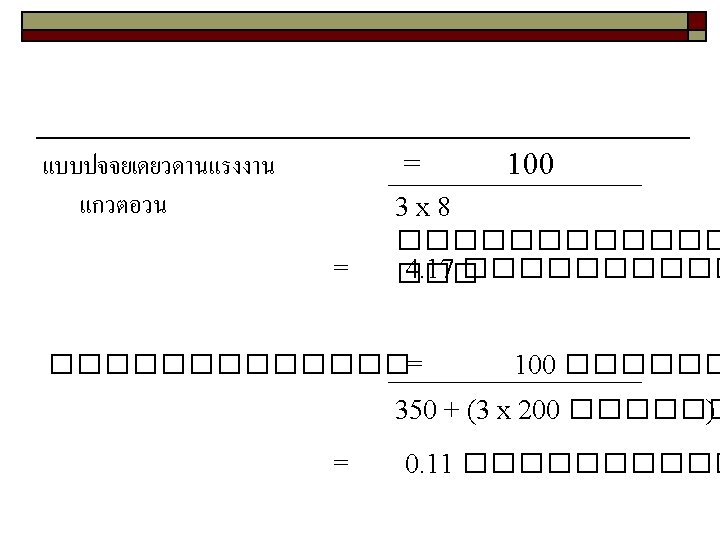
Example 3 7040 Units Produced Cost of labor of $1, 000 Cost of materials: $520 Cost of overhead: $2000 What is the multifactor productivity?
Example 3 Solution MFP = Output Labor + Materials + Overhead MFP = (7040 units) $1000 + $520 + $2000 MFP = 2. 0 units per dollar of input
Capacity Planning o o Capacity is the upper limit or ceiling on the load that an operating unit can handle. Capacity also includes n n n Equipment Space Employee skills
Capacity o Design capacity n o Effective capacity n o maximum output rate or service capacity an operation, process, or facility is designed for Design capacity minus allowances such as personal time, maintenance, and scrap Actual output n Rate of output actually achieved--cannot exceed effective capacity.
Efficiency and Utilization Efficiency = Utilization = Actual output Effective capacity Actual output Design capacity Both measures expressed as percentages (%)
Efficiency/Utilization Example Design capacity = 50 trucks/day Effective capacity = 40 trucks/day Actual output = 36 units/day Efficiency = Actual output = 36 units/day = 90% Effective capacity 40 units/ day Utilization = Actual output Design capacity = 36 units/day = 72% 50 units/day
Steps for Capacity Planning 1. 2. 3. 4. 5. 6. 7. 8. Forecast future capacity requirements Evaluate existing capacity Identify alternatives Conduct financial analysis Assess key qualitative issues Select one alternative Implement alternative chosen Monitor results
Calculating Processing Requirements Working 8 -hour shift, 250 day/year Annual capacity = 2000 hours Machine required to handle these job = 5, 800 /2, 000 = 2. 90 Machine required to handle these job = 3 machines
Product Life Cycle Company Strategy/Issues Introduction Growth Maturity Best period to increase market share Practical to change price or quality image Poor time to change image, price, or quality R&D engineering is critical Strengthen niche Competitive costs become critical Defend market position CD-ROM Internet Sales Decline Cost control critical Fax machines Drive-through restaurants Color printers Flat-screen monitors DVD 3 1/2” Floppy disks
Bottleneck Operation Machine #1 Machine #2 10/hr 30/hr 10/hr Machine #3 Bottleneck Operation 30/hr 10/hr Machine #4 10/hr Bottleneck operation: An operation in a sequence of operations whose capacity is lower than that of the other operations
Bottleneck Operation 1 20/hr. Operation 2 10/hr. Operation 3 15/hr. Maximum output rate limited by bottleneck 10/hr.
Cost-volume symbols FC = Fixed cost VC = Total variable cost V = Variable cost per unit TC = Total cost TR = Total revenue R = Revenue per unit Q = Quantity or volume of output QBEP = Break-even quantity P = Profit
TC = VC + FC VC = Q x v Amount ($) Cost-Volume Relationships t os To C V = c l a t o v C F + t s o ) C (V c e bl a i r a T Fixed cost (FC) 0 Q (volume in units)
Amount ($) Cost-Volume Relationships 0 e u n e v e r l a t o T Q (volume in units)
Cost-Volume Relationships BEP = Break Even Point t i e f v Pro e r l a t st o o c T l a t To Amount ($) The volume of output at which Total cost and total revenue are equal e u n BEP = FC (r – v) s s o L 0 BEP units Q (volume in units)
Example: One manager wants to decide to buy machine for making part of purchase from suppliers Make Buy Annual FC 150, 000 none (Baht) VC (Baht) 60 80 Annual volume 12, 000 (units) @ ������������������������
Decision Tree Decision tree n A schematic representation of the available alternatives and their possible consequences Useful for analyzing sequential decisions ) (. 40 mand e D ow $40 ing h t No Do Overtime L ild Sm all n High Dema nd (. 6 0 2 ) Exp and Bu o 1 ) ge ar L ild Bu 0 (. 4 2 ing Do Noth and Cut m De w Lo High Dem and ( Pric . 60) $70 es $50 $55 ($10) $50
Example: Number of Machine 1 2 3 Annual FC 9, 600 15, 000 20, 000 Range of output 0 -300 301 -600 601 -900 • VC=B 10/unit • Selling price = B 50/unit @ �� Breakeven Point