
Scientific Visualization 5 hp Fall 2010 Ch 1
- Slides: 52
Scientific Visualization 5 hp Fall 2010 Ch 1. Introduction Ch 2. Computer Graphics primer Ch 4. The Visualization pipeline Filip Malmberg filip@cb. uu. se Uppsala universitet
UU/IT Teachers Filip Malmberg (filip. malmberg@cb. uu. se) Stefan Seipel (stefan. seipel@cb. uu. se) Patrik Malm (patrik. malm@cb. uu. se) Pontus Olsson (pontus. olsson@cb. uu. se) Gustaf Kylberg (gustaf. kylberg@cb. uu. se) Centre for Image Analysis, CBA ITC building 2, floor 1 Office 2111
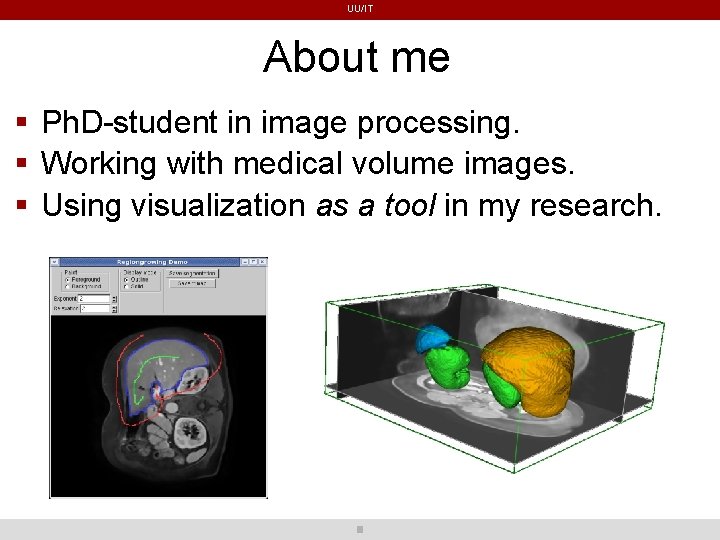
UU/IT About me Ph. D-student in image processing. Working with medical volume images. Using visualization as a tool in my research.
UU/IT About the course 10 lectures 3 Computer exercises/assignments (3 hp) Written exam (2 hp) Textbook: The Visualization Toolkit, An Object-Oriented Approach to 3 D Graphics, 4 th edition, Kitware, Inc. , 2006 ISBN 1 -930934 -19 -X
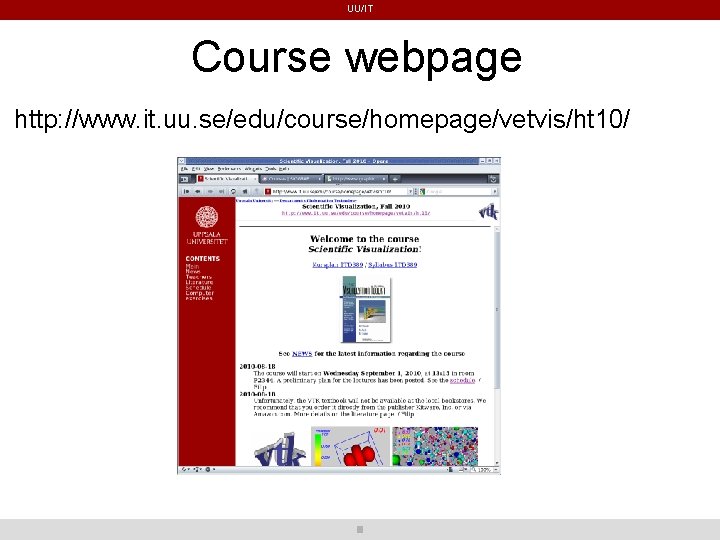
UU/IT Course webpage http: //www. it. uu. se/edu/course/homepage/vetvis/ht 10/
UU/IT What is visualization? Dictionary: vi·su·al·ize • To form a mental image of; envisage: try to visualize the scene as it is described • To make visible
UU/IT Interpreting data in visual terms When data is complex: Collected/Computed When numerous data Visualization is not a substitute to, but in addition to, statistical analysis and other quantitative methods Visualization takes advantage of human sensory abilities • Pattern recognition, Trend discovery, etc.
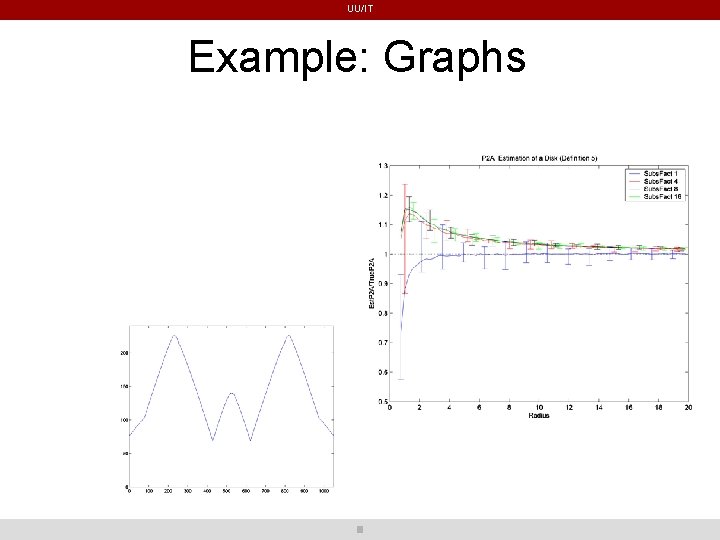
UU/IT Example: Graphs
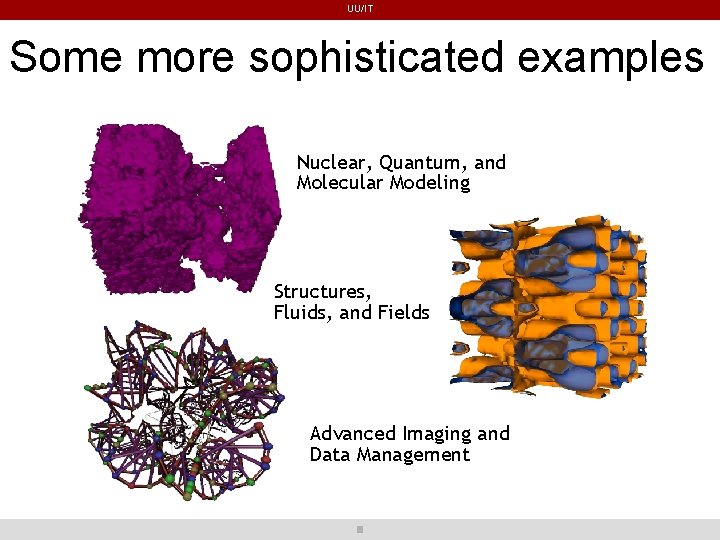
UU/IT Some more sophisticated examples Nuclear, Quantum, and Molecular Modeling Structures, Fluids, and Fields Advanced Imaging and Data Management
UU/IT Scientific visualization is the process of exploring, transforming, and viewing data as images The dimensionality of the data is generally larger than or equal to 3 Visualization is often interactive We are not trying to create realistic images, but to visualize data in an informative way Dependent on the task given
UU/IT Visualization serves many purposes ”Pretty pictures” For further analysis Debugging. . .
UU/IT Visualization can be used in every step of most processes Problem formulation Mathematical modelling Software/Hardware Simulation Result Interpretation
UU/IT General development of visualization Rather new discipline still developing into subareas Multi-disciplinary (Computer science, human perception, computer graphics, HCI) Faster computers, high-speed networks, new user-interfaces
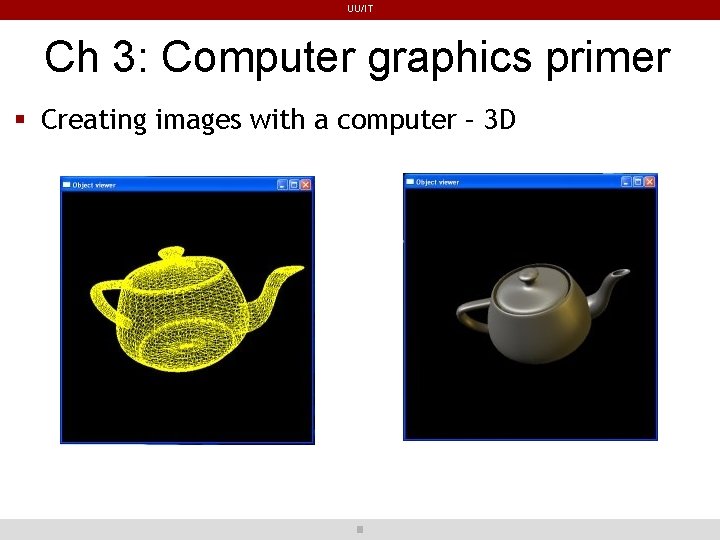
UU/IT Ch 3: Computer graphics primer Creating images with a computer – 3 D
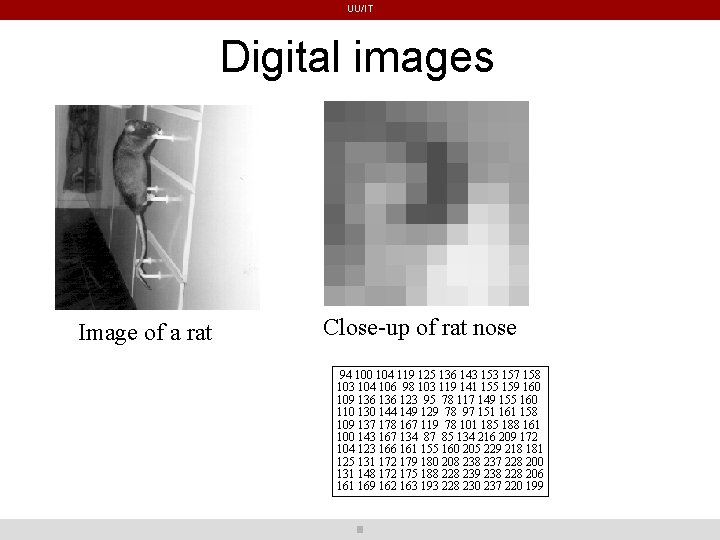
UU/IT Digital images Image of a rat Close-up of rat nose 94 100 104 119 125 136 143 157 158 103 104 106 98 103 119 141 155 159 160 109 136 123 95 78 117 149 155 160 110 130 144 149 129 78 97 151 161 158 109 137 178 167 119 78 101 185 188 161 100 143 167 134 87 85 134 216 209 172 104 123 166 161 155 160 205 229 218 181 125 131 172 179 180 208 237 228 200 131 148 172 175 188 228 239 238 228 206 161 169 162 163 193 228 230 237 220 199
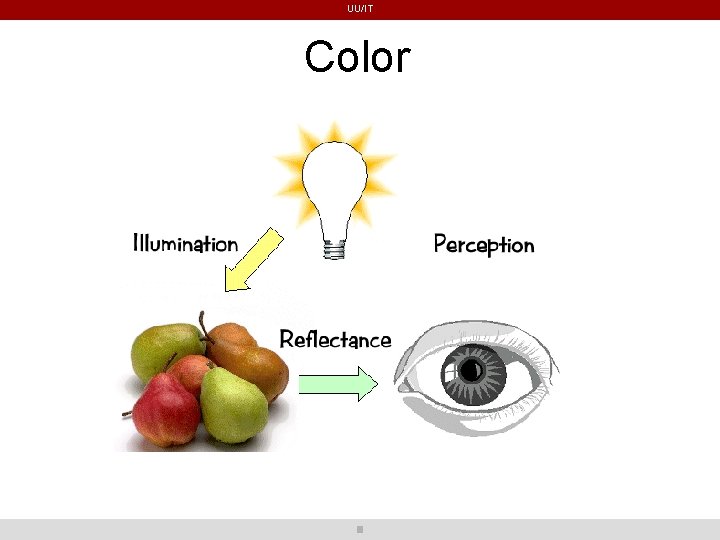
UU/IT Color
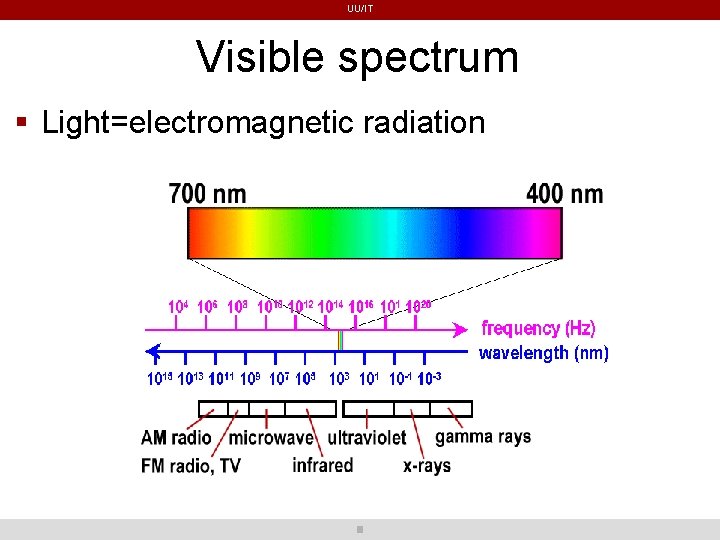
UU/IT Visible spectrum Light=electromagnetic radiation
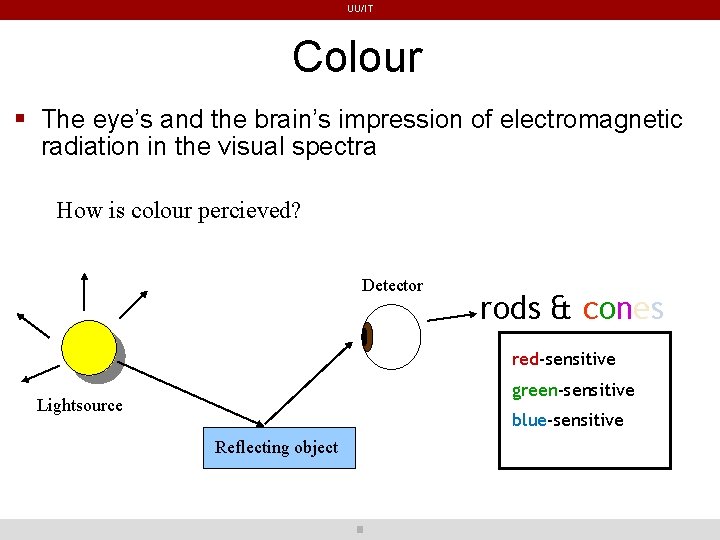
UU/IT Colour The eye’s and the brain’s impression of electromagnetic radiation in the visual spectra How is colour percieved? Detector rods & cones red-sensitive green-sensitive Lightsource blue-sensitive Reflecting object
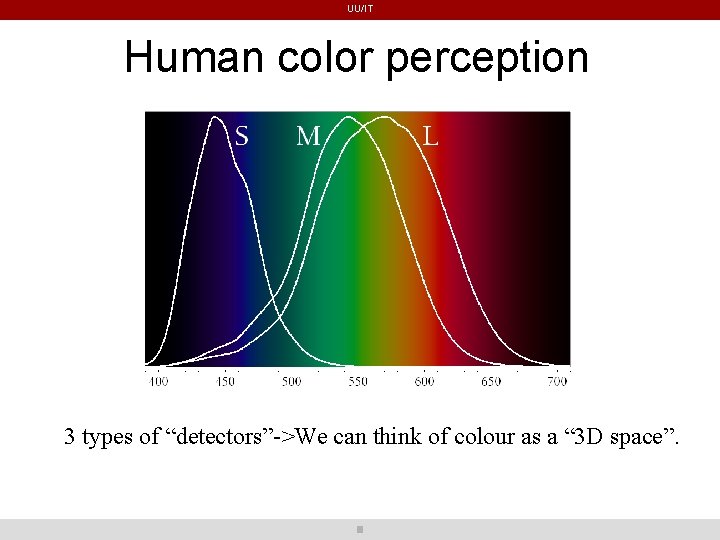
UU/IT Human color perception 3 types of “detectors”->We can think of colour as a “ 3 D space”.
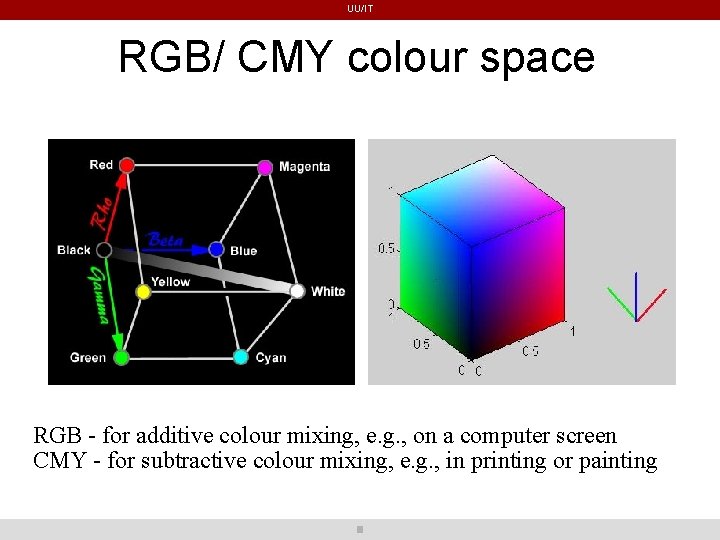
UU/IT RGB/ CMY colour space RGB - for additive colour mixing, e. g. , on a computer screen CMY - for subtractive colour mixing, e. g. , in printing or painting
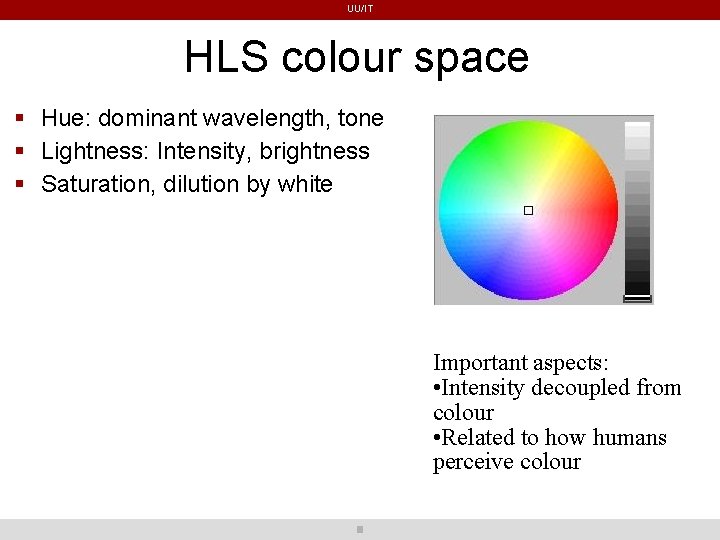
UU/IT HLS colour space Hue: dominant wavelength, tone Lightness: Intensity, brightness Saturation, dilution by white Important aspects: • Intensity decoupled from colour • Related to how humans perceive colour
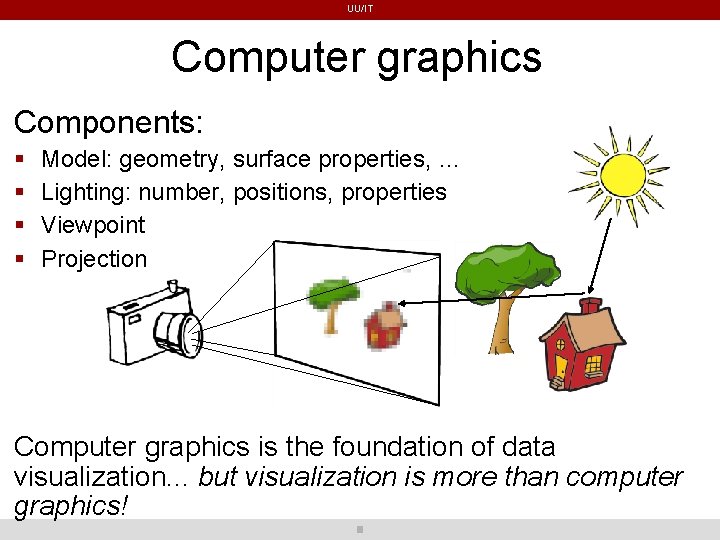
UU/IT Computer graphics Components: Model: geometry, surface properties, … Lighting: number, positions, properties Viewpoint Projection Computer graphics is the foundation of data visualization. . . but visualization is more than computer graphics!
UU/IT Rendering Generation of an image from data. “Physical” view: • Rays of light are emitted from a light source • Some rays strike an object • The object surface absorbs some light and reflects the rest • Some reflected light enter our eyes (or a camera) • We ”see” the object
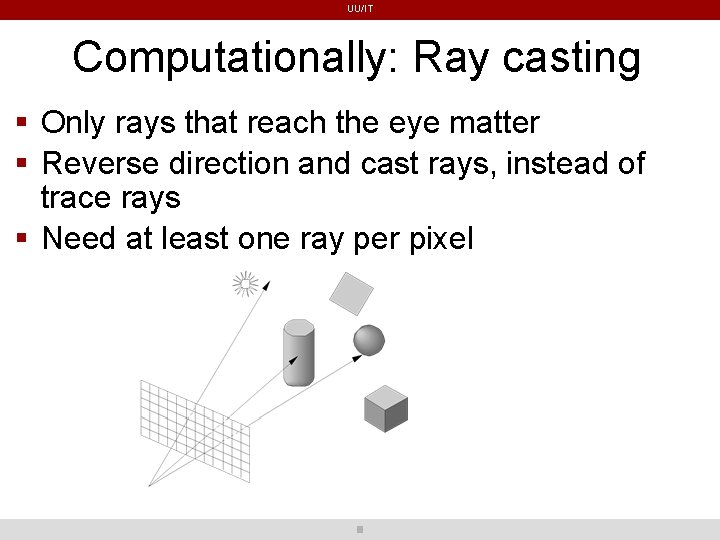
UU/IT Ray-tracing or ray-casting Ray-tracing simulates the interaction of light with objects by following the path of each light ray. In computations: • follow the rays backwards from the eye into the scene
UU/IT Computationally: Ray casting Only rays that reach the eye matter Reverse direction and cast rays, instead of trace rays Need at least one ray per pixel
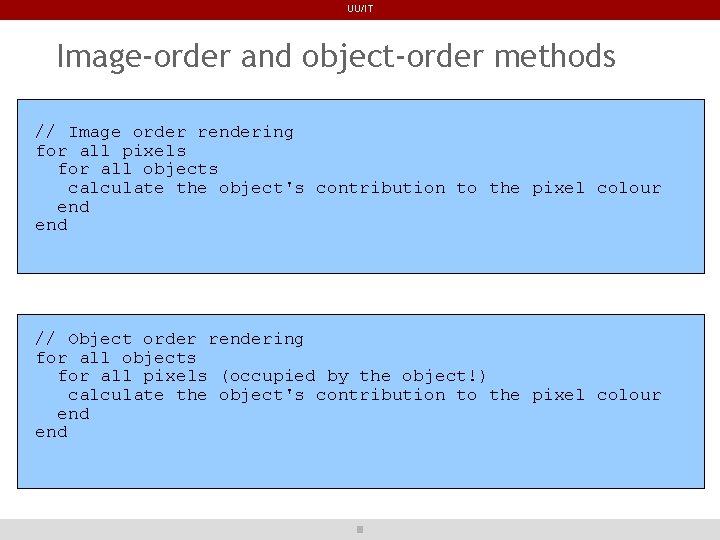
UU/IT Image-order and object-order methods Ray-tracing is an image-order process, determining what happens to each pixel (ray of light), one at a time An object-order process works by rendering each object, one at a time
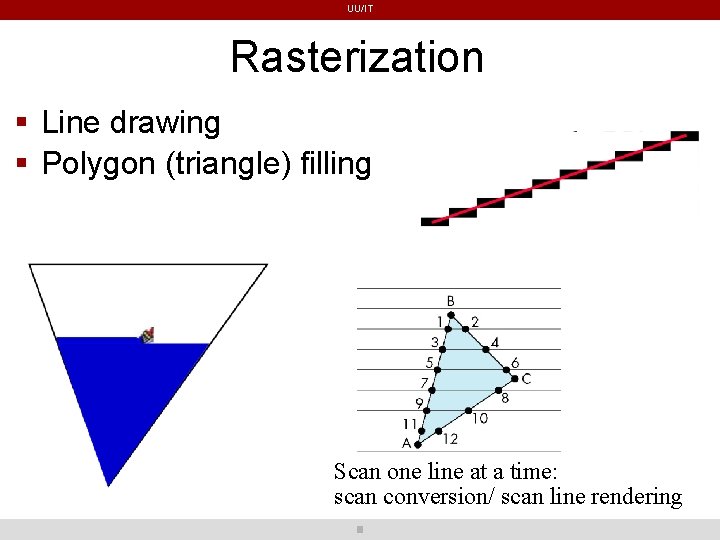
UU/IT Rasterization Line drawing Polygon (triangle) filling Scan one line at a time: scan conversion/ scan line rendering
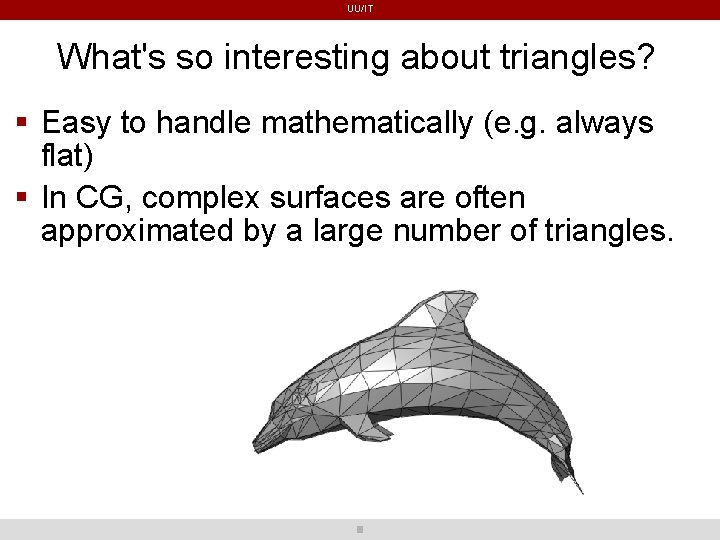
UU/IT What's so interesting about triangles? Easy to handle mathematically (e. g. always flat) In CG, complex surfaces are often approximated by a large number of triangles.
UU/IT Image-order and object-order methods // Image order rendering for all pixels for all objects calculate the object's contribution to the pixel colour end // Object order rendering for all objects for all pixels (occupied by the object!) calculate the object's contribution to the pixel colour end
UU/IT Lights in CG We simplify by assuming (infinitely distant) point-shaped light sources Light is emitted in all directions from a single point in space Far away implies that rays are parallel
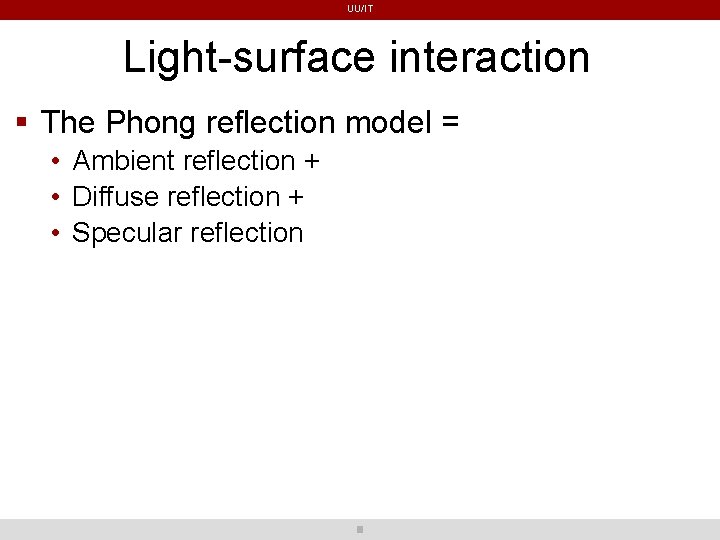
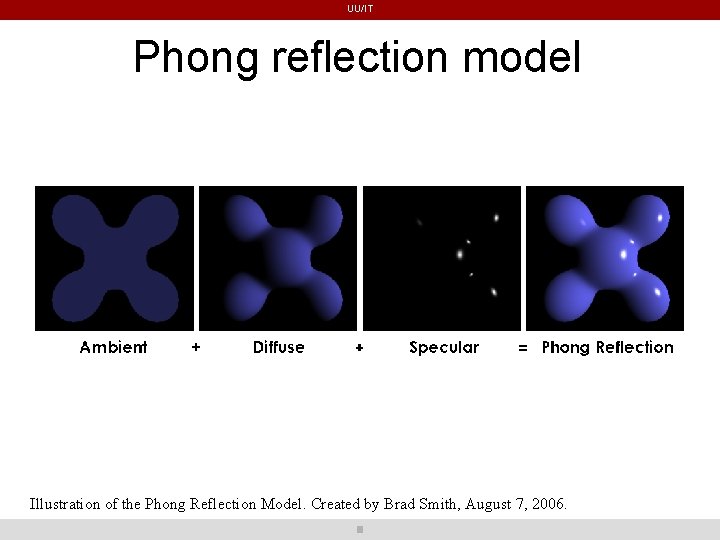
UU/IT Light-surface interaction The Phong reflection model = • Ambient reflection + • Diffuse reflection + • Specular reflection
UU/IT Phong reflection model Illustration of the Phong Reflection Model. Created by Brad Smith, August 7, 2006.
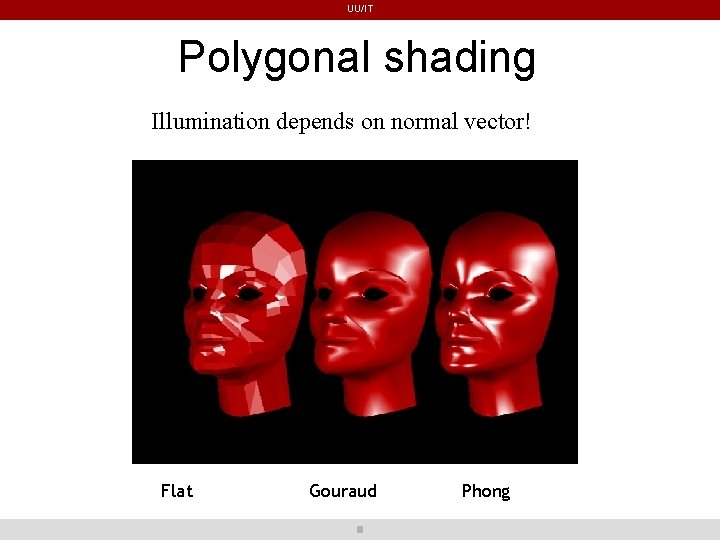
UU/IT Polygonal shading Illumination depends on normal vector! Flat Gouraud Phong
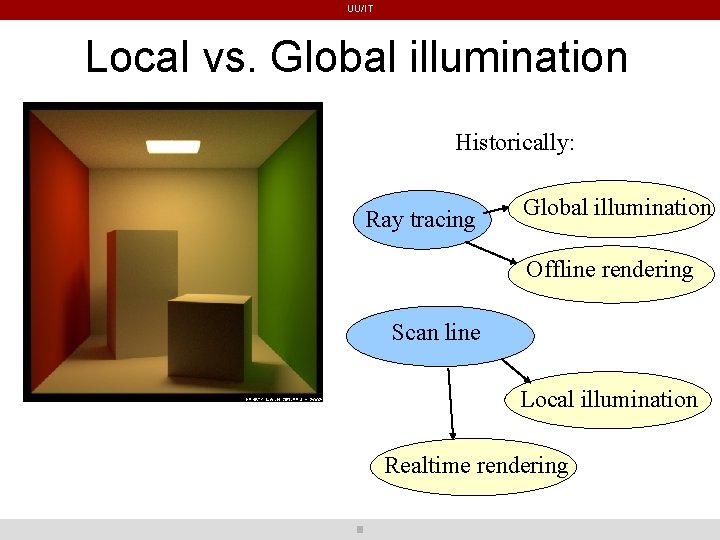
UU/IT Local vs. Global illumination Historically: Ray tracing Global illumination Offline rendering Scan line Local illumination Realtime rendering
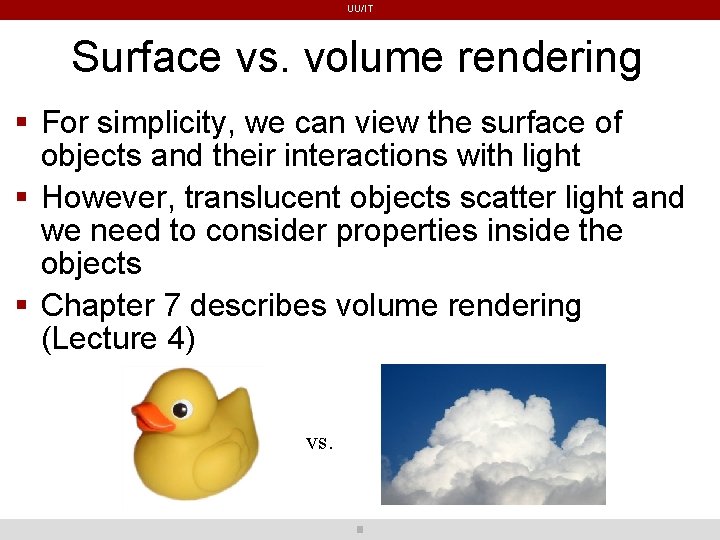
UU/IT Surface vs. volume rendering For simplicity, we can view the surface of objects and their interactions with light However, translucent objects scatter light and we need to consider properties inside the objects Chapter 7 describes volume rendering (Lecture 4) vs.
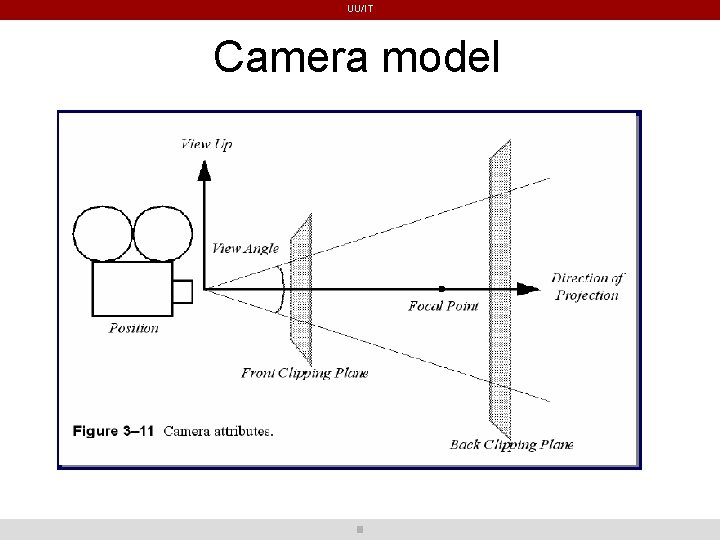
UU/IT Camera model
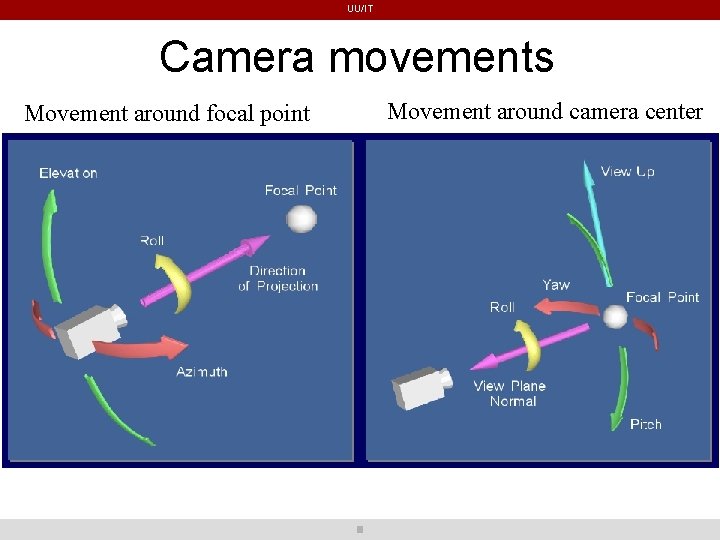
UU/IT Camera movements Movement around focal point Movement around camera center
UU/IT Coordinate systems 4 coordinate systems: Model: where the object is defined World: 3 D space where actors are positioned View: what is visible to the camera Display: (x, y) pixel locations See Figure 3 -14
UU/IT Coordinate transformations 3 D to 2 D Perspective Rotation, translation, scaling Homogeneous coordinates 4 x 4 transformation matrices
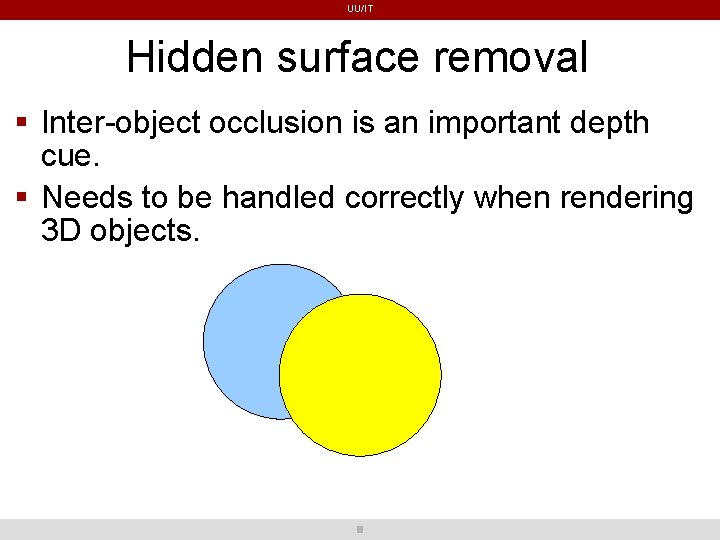
UU/IT Hidden surface removal Inter-object occlusion is an important depth cue. Needs to be handled correctly when rendering 3 D objects.
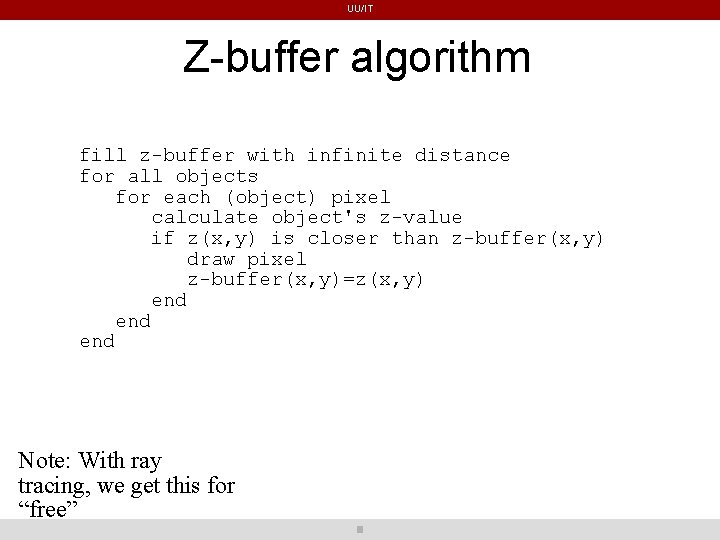
UU/IT Z-buffer algorithm fill z-buffer with infinite distance for all objects for each (object) pixel calculate object's z-value if z(x, y) is closer than z-buffer(x, y) draw pixel z-buffer(x, y)=z(x, y) end end Note: With ray tracing, we get this for “free”
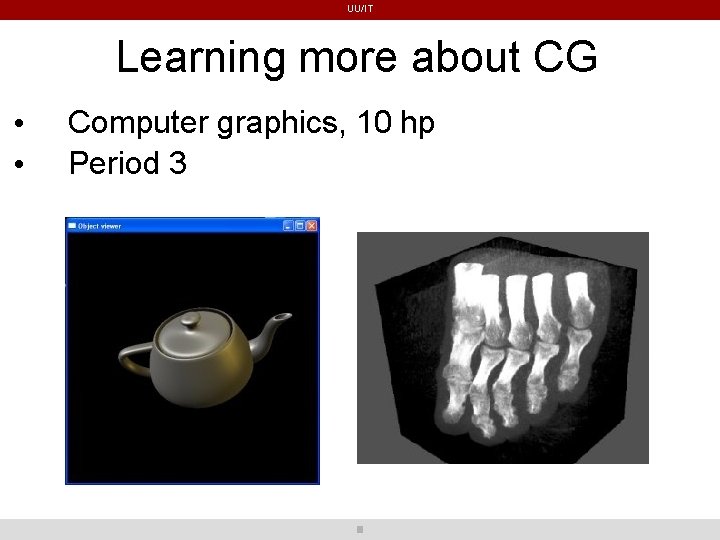
UU/IT Learning more about CG • • Computer graphics, 10 hp Period 3
UU/IT Ch 4. The visualization pipeline Computer graphics: Convert graphics primitives to images Visualization: Convert data to graphics primitives
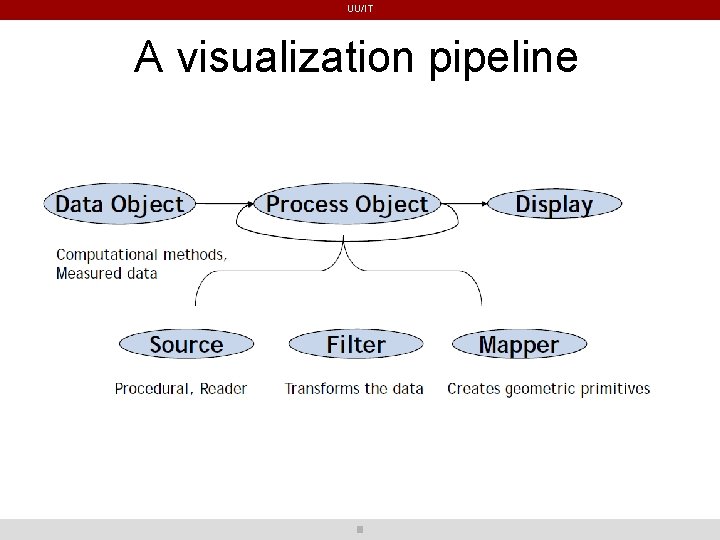
UU/IT Visualization pipeline The pipeline consists of objects to represent data objects to operate on data indicated direction of data flow (arrow connections between objects)
UU/IT Data objects Represent information Provide methods to create, access, and delete data To modify data is not really allowed; reserved for process objects
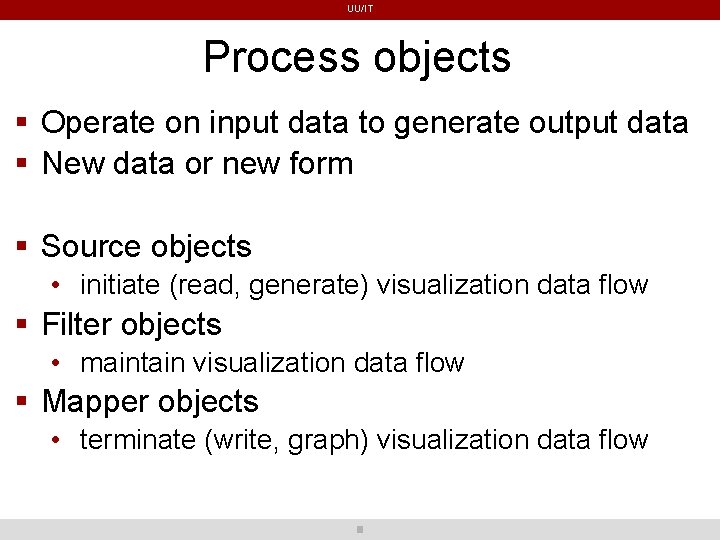
UU/IT Process objects Operate on input data to generate output data New data or new form Source objects • initiate (read, generate) visualization data flow Filter objects • maintain visualization data flow Mapper objects • terminate (write, graph) visualization data flow
UU/IT A visualization pipeline
UU/IT Pipeline topology How to connect data objects and process objects Pipeline connections • type concerns the form of data that process objects take as input or generate as output • multiplicity deals with # of input and # of output allowed Feedback loops • view intermediate results
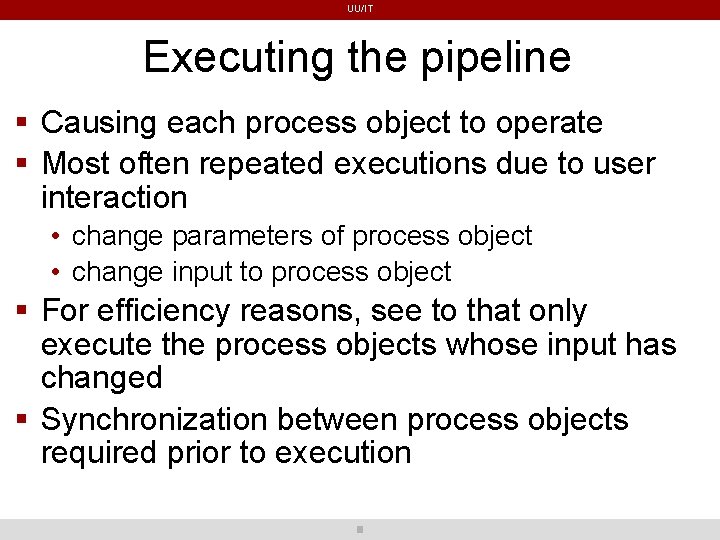
UU/IT Executing the pipeline Causing each process object to operate Most often repeated executions due to user interaction • change parameters of process object • change input to process object For efficiency reasons, see to that only execute the process objects whose input has changed Synchronization between process objects required prior to execution
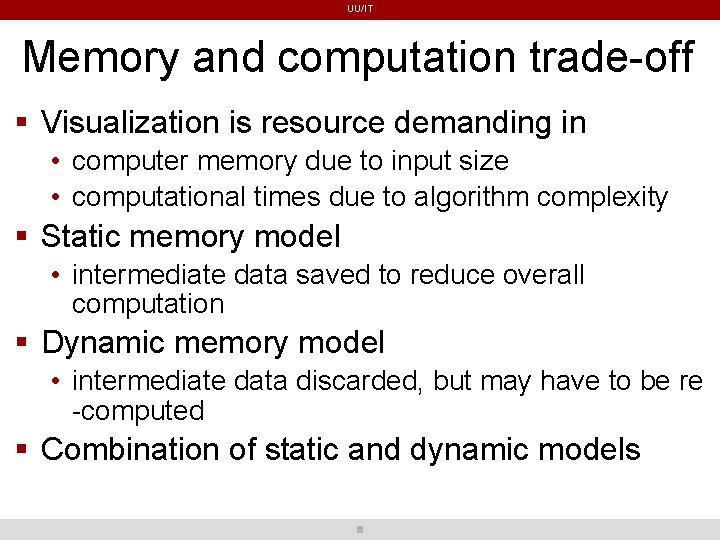
UU/IT Memory and computation trade-off Visualization is resource demanding in • computer memory due to input size • computational times due to algorithm complexity Static memory model • intermediate data saved to reduce overall computation Dynamic memory model • intermediate data discarded, but may have to be re -computed Combination of static and dynamic models
UU/IT Next lecture Intro to VTK and Python. More about the visualization pipeline, as implemented in VTK.
Scientific Visualization 5 hp Fall 2010 Ch 1. Introduction Ch 2. Computer Graphics primer Ch 4. The Visualization pipeline Filip Malmberg filip@cb. uu. se Uppsala universitet