Scientific Investigations The Scientific Process Outline copy the


- influenced science in")

 Experiments with a focus")


 variable (IV): condition or event under study, what you change")
 experimental group: group(s) subjected to the independent variable control group:")


… ◦ Set of instructions you will follow")

 for ONE prediction that you hypothesized on earlier. . :")
 Average number of fleas (t =")


 variable: condition or event under study (choose 1) Dependent (responding)")
 subjected to the independent variable control group: group not subjected to")


- Slides: 49
Scientific Investigations
The Scientific Process –Outline (copy the following but leave about a ¼ page between each section) I. What is Science? A. Background B. Goal of Science II. Scientific Design A. “Scientific Process” B. Hypotheses & Theories III. Scientific Method in Action Examples and Explanations
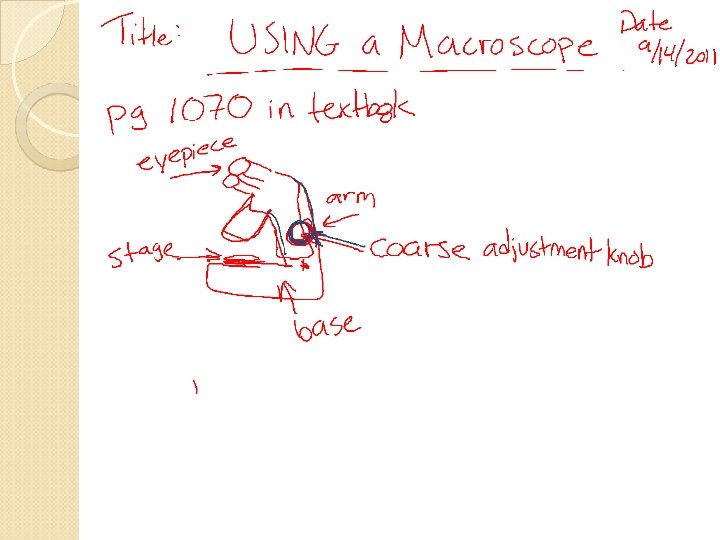
14/15 Sept 2011 Pick up: a copy of “Using a Macroscope”, Lab Safety Agreement, and your lab book. Begin reading the Lab Safety Agreement Title a new lab entry “Using a Macroscope” Follow directions for Using a Macroscope Lab.
16 September 2011 HAPPY FRIDAY!! Pick up a worksheet packet AND a textbook AND your lab notebook Pick up your mealworms WRITE TWO OBSERVATIONS OF YOUR MEALWORMS IN YOUR NOTEBOOK.
A. Background Aristotle- ancient Greek philosopher (384 BCE-322 BCE or BC)- influenced science in the Western world Science in ancient times focused on thought only True experimentation did not come about until…
19 September – Happy Monday!!! Pick up a Mealworm Lab Grade Sheet AND your Lab Notebook Pick up a Scientific Method Warm. Up ◦ Complete the warm up in the BACK of your lab book.
A. Background Galileo Galilei- the “father of modern science” (Einstein) Experiments with a focus on quantitative data
B. Goal of Science Organized way to investigate and understand the natural world To seek the truth in an objective and evidencebased manner Scientia (Latin) - “knowledge” or “to know”
II. Scientific Design A. “Scientific Process” An on: organized process scientists use which depends ◦ proposing a TESTABLE hypothesis ◦ Designing a CONTROLLED experiment which can be repeated ◦ Gathering OBSERVABLE, EMPIRICAL, and MEASURABLE data ◦ Composing an evidence-based conclusion after the analysis of that data No ONE way to do the “scientific method” Reduce bias on the part of the scientist
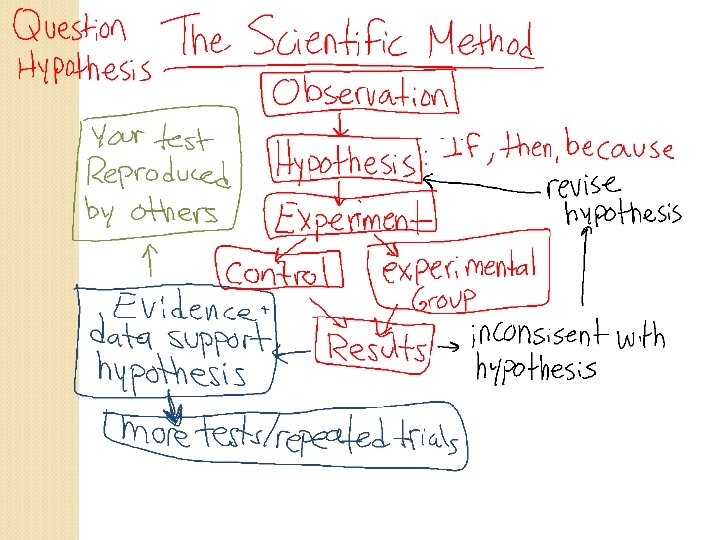
A. “Scientific Process” Steps: QUESTION/PROBLEM- based on observations HYPOTHESIS- statement about the relationship btween 2 things TESTING- controlled experiment or observations. RESULTS- analyze your Q/Q data CONCLUSION- confirm/reject your hypothesis; draw up significance of your results Report findings to others so they can repeat the experiment.
B. Theories and Laws What is the difference? ◦ HYPOTHESIS: Educated guess, based on observations, testable Limited statement regarding cause and effect in a specific situation “My car does not start because the battery is low…” ◦ THEORY: Enough evidence to accept a group of hypotheses- accept to be true based on evidence to date. Can be shown to be false if evidence disputes Explains WHY something occurs
Observation vs. Inference ◦ Observation Data we can take in through our senses. Very important to all steps of the scientific method Important that one take good observations and measurements ◦ Inference What we can figure out from that data.
Observation: when studying something describe only facts that you can see, touch, smell and hear. You are not making any guesses. THIS IS NOT AN OPINION!! Ohh… This liquid is green and it is leaking from a brown can. I also smell it.
Inference: using your observations to make a guess about an object or an outcome THIS CAN BE A SCIENTIFIC OPINION Based on my observations, I think that this can is old and is leaking a toxic substance.
Group Practice Give 2 observation on the following: Give 2 inferences on the following:
Make observation Scientific Method Ask question Develop hypothesis Test hypothesis with further experiments Test hypothesis with an experiment Revise hypothesis Analyze data and draw conclusions Hypothesis IS supported Wysession, Frank, Yancopoulos, Physical Science Concepts in Action , 2004, page 8 Hypothesis is NOT supported Develop theory
What did you notice about the hypothesis?
About hypotheses… Must be TESTABLE Relates two variables “If…then…because” ◦ IF a variable is manipulated a certain way, THEN another variable will respond this way BECAUSE of this reason. Forces you to think about what results in an experiment will look like SUPPORT or REJECTED!!
Choose two and write a plausible hypothesis from these predictions… Chocolate may cause pimples. Salt in soil may affect plant growth. Plant growth may be affected by the color of the light. Bacterial growth may be affected by temperature. Ultra violet light may cause skin cancer. Temperature may cause leaves to change color.
Important terms: Independent (manipulated) variable (IV): condition or event under study, what you change (manipulate) in the study Dependent (responding) variable (DV): condition that could change under the influence of the independent variable (measure this) Controlled variables (CV): conditions which could affect the outcome of the experiment so they must be held constant (unchanged) among groups.
Important terms (ctd. ) experimental group: group(s) subjected to the independent variable control group: group not subjected to the independent variable, used as measuring stick reproducibility: producing the same result consistently to verify result. Procedures should describe your experimental design in enough detail for others to perform the same experiment in the exact manner.
What does this look like? Problem: Does a certain brand of dog collar repel fleas? Hypothesis: If …, then…because…. a. IV: What is being manipulated? DV: What are we measuring? CV’s: What do we need to keep the same in order for the experiment to be valid?
What does this look like? Problem: Does a certain brand of dog collar repel fleas? Hypothesis: If this collar is used on dogs, then fleas will be repelled because fleas will respond in a negative way to chemicals on the collar. IV- having a collar DV- presence of fleas CV- list as many as you can!
Experimental group: ? Control group: ?
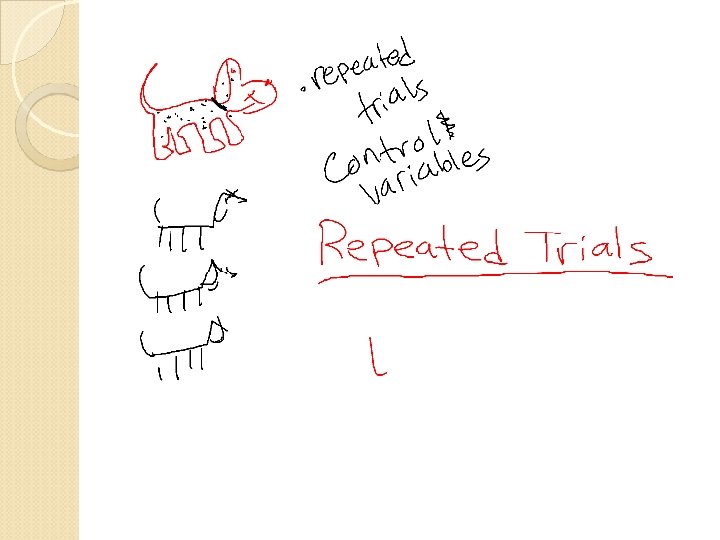
Now to test… Construct a flowchart (procedures)… ◦ Set of instructions you will follow ◦ Controlled experiment ◦ Will have IV, MV, and CV naturally included ◦ Will have some form of quantitative or qualitative data collection
Experimental Design Obtain 500 dogs of various breeds from local shelters. 2. Have vet weed out the 200 dogs with the most fleas. 3. Count number of fleas on dogs and average. 4. Randomly assign individuals to 2 groups. 1. ◦ ◦ Group A = experimental (those with King collars). Group B = control (no collars) Board dogs in identical environments. Give them identical amount and type of food. Give identical care. Only change the manipulated (independent) variable: one group gets to wear the King collar and the other group does not. 6. After two weeks count and average the number of fleas in Group A and B, separately. 5.
Experimental Design (Procedure) for ONE prediction that you hypothesized on earlier. . :
Data: Group Average number of fleas (t= 0) Average number of fleas (t = end of Week Two) Control group 500 515 Experimental group 500 50 Results: Dogs wearing the King collars were virtually free of fleas after the 2 wk period compared to the dogs without the collars which had about the same number of fleas as when the experiment began
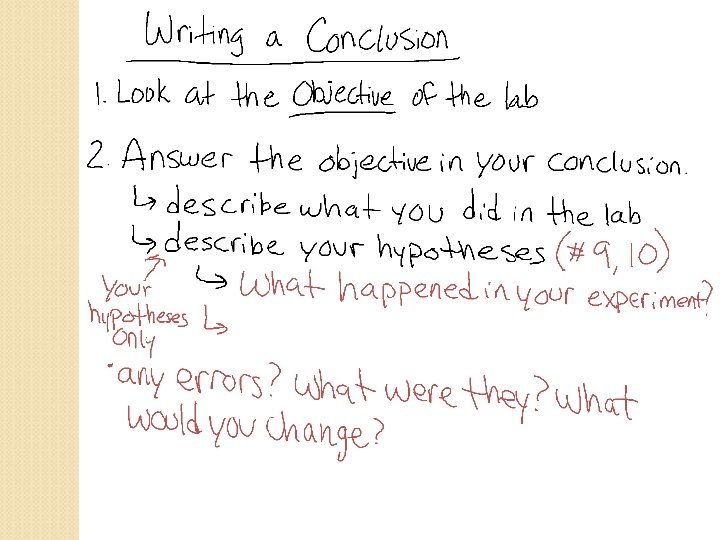
Conclusion Support or reject hypothesis Cite data from your data table ◦ Ex. As seen in the data table, the number of fleas in the treatment group with a collar decreased. Give value and meaning to the data and results Identify possible sources of error, explain how sources may have affected results.
What would a well-written conclusion to this experiment look like?
III. Scientific Method In Action I want to market a new type of cat food for cats that will make them shed less. But first I have to see if it really works.
I want to market a new flea collar for cats that is a natural remedy-no harsh chemicals. But first I have to see if it really works. GROUP WORK: 1. What are your MV and RV? 2. List possible CV. 3. If…then…because… hypothesis. 4. Flowchart (procedure) accounting for MV, RV, and CV. What type of data will you collect? 5. Data table. 6. Results analysis. 7. Support or reject hypothesis in conclusion.
Scientific Method Review ◦ ◦ Definition A procedure for processing and understanding certain types of information Steps ( KNOW THESE!!!) state the problem gather information(make observations) Formulate hypothesis perform experiments (record analyze the data) State a conclusion
Scientific Measurement ◦ ◦ ◦ In Scientific investigation we ALWAYS use the metric system Mass= Gram (g/mg) Weight= Newton (N) Length = meter (mm/cm/m) Volume= Liter (m. L/L)
Important terms: Independent (manipulated) variable: condition or event under study (choose 1) Dependent (responding) variable: condition that could change under the influence of the independent variable (measure this) Controlled variables: conditions which could effect the outcome of the expt so they must be held constant between groups.
experimental group: group(s) subjected to the independent variable control group: group not subjected to the independent variable, used as measuring stick reproducibility: producing the same result consistently to verify result. It is therefore important to describe your experimental design in enough detail for others to perform the same experiment.
Second Example Observation: polar bears are white, you wonder why this is so Hypotheses: Match arctic landscape for protection/predation White fur may reduce heat loss in warm-blooded animals Maybe polar bears are unable to produce melanin therefore they are white as result
Prediction: polar bears which are white will capture more prey than those which are dark ◦ IV: color of bears ◦ DV: number of prey Experimental Design: spray paint 5 polar bears dark(experimental Group)/leave 5 white(control group) Track prey capture for 8 weeks
Effect of Polar Bear coat color on prey capture Color of Bear Number of Prey White 12 Dark 7
Probability and Statistics Probability: an attempt to measure and predict the likelihood of an event Statistics: allow you to evaluate comparisons between experimental and control groups
Effect of Polar Bear coat color on prey capture Color of Bear Mean Number of Prey captured White 12 Dark 7 Mean: sum the values, divide by the number of values
Assumptions: factors thought to be true for the investigation but have not been verified or controlled ◦ Commonly accepted information ◦ Thought to be held constant but not controlled ◦ Factors beyond the investigators control because of technical or time considerations Incorrect assumptions invalidate an experiment!
Assumptions: 1. All of the bears are equally hungry 2. Spray painting the bears has no effect on their behavior etc. accept to make them stand out on the ice 3. Our sample of bears is a good representation of the polar bear population in general
Statistics Sample Size: # of observations necessary to have a reliable representation of a population Confidence Limits: estimates that reflect the reliability of your mean (average) ◦ Probability your sample is similar to other random samples of that population
On a new index card: Name: Birthday: Name a movie you would like to recommend: Name a book you read this summer: What kind of pets do you have? (What kind of pet would you like to have? ): Who is your favorite celebrity? What TV show do you always watch? What is your favorite restaurant?