Science Skills and Safety Scientific Literacy Science Lab

Science Skills and Safety • Scientific Literacy • Science Lab Safety – WHMIS, MSDS, HHPS • Observations vs. Inferences • Significant Digits/Figures • Scientific Notation • The Scientific Method • Metric Conversions

Scientific Literacy Charlatans - a person who falsely pretends to know or be something in order to deceive people

Scientific Literacy • What is Scientific Literacy? Look it up.

Scientific Literacy • Scientific literacy helps people to understand evaluate information relating to science and technology in the world so that they make better decisions • A general understanding of science is necessary to be an informed citizen – Why? • Specific scientific knowledge and skills are necessary for a wide range of careers – Like?


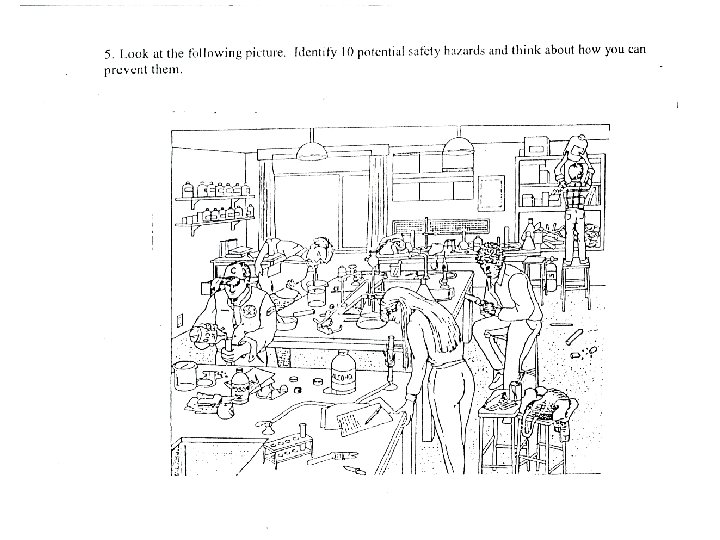
Science Lab Safety

Safety Video

Safety Challenge • Look at the picture given to you and list as many unsafe features of the lab as you can.

Lab Safety Handout

WHMIS • Stands for Workplace Hazardous Material Information System • The purpose of WHMIS is hazard identification and product classification, labeling, material safety data sheets, and worker training and education

WHMIS Symbols

MSDS • Stands for Material Safety Data Sheet • Are available for all used chemicals and contain important information

Sodium MSDS handout

HHPS • Stands for Hazardous Household Product Symbols • Found on virtually all potentially dangerous household products • Indicates both the type of danger and the degree of risk

Hazardous Household Product Symbols

All Possible HHP Symbols Poisonous Danger Warning Caution Flammable Explosive Corrosive

Prevent it – Safety Video


Observations and Inferences

OBSERVATIONS AND INFERENCES • Observation: statement of facts and occurrences that are made using our senses and sometimes by measurement with scientific instruments. – e. g. The surface of the lab. benches around the perimeter of the room are black and shiny. – The temperature of your grade 9 teacher’s coffee is 80 o. C. • Your own examples

OBSERVATIONS AND INFERENCES • Inference: statement based on reasoning from observations made. – e. g. The benches surfaces are probably smooth and cold ( based on seeing them black and shiny ) – The teacher’s coffee looks hot ( based on seeing steam rising from the cup ) • Your own examples

Try It 1. Give 2 observations from the picture. 2. Give 2 inferences from the picture.

")
Significant Digits (Figures)
 • Significant digits represent the amount of uncertainty in a measurement.")
Significant Digits (Figures) • Significant digits represent the amount of uncertainty in a measurement. Any digit that is actually measured or estimated will be considered significant. • E. g. The length of something is between 5. 2 and 5. 3 cm. Suppose we estimate it to be 5. 23 cm.
 are certain but the")
Significant Digits • The first 2 digits (5 and 2) are certain but the last digit (0. 03) was estimated. Therefore, the measurement 5. 23 has three significant digits.
 All non-zero digits (1 -9) are considered significant. e. g.")
Significant Digits Rules 1) All non-zero digits (1 -9) are considered significant. e. g. 123 m=3 s. d. , 23. 56=4 s. d.
 Zeros between non-zero digits are also significant. e. g. 1207")
Significant Digits Rules 2) Zeros between non-zero digits are also significant. e. g. 1207 m = 4 s. d. , 120. 5 km/h = 4 s. d.
 Any zero that follows a non-zero digit and is to")
Significant Digits Rules 3) Any zero that follows a non-zero digit and is to the right of the decimal point is significant. e. g. 12. 50 m/s = 4 s. d. because it shows that we actually measured that digit to be 0. 60. 00 km = 4 s. d.
 Zeros used to indicate the position of the decimal are")
Significant Digits Rules 4) Zeros used to indicate the position of the decimal are not significant. e. g. 500 km = 1 s. d. , 0. 325 m = 3 s. d. , 0. 00034 km = 2 s. d.
 All counting numbers have an infinite number of significant digits")
Significant Digits Rules 5) All counting numbers have an infinite number of significant digits because we are certain of the exact number e. g. 6 apples = infinite s. d.

Significant Digits

Homework • Significant Digits Worksheet


Scientific Notation
? 40 000")
How far away is the nearest Star besides our Sun (Proxima Centauri)? 40 000 000 km (13 zeros) This number is written in decimal notation. When numbers get this large, it is easier to write them in scientific notation.

Scientific Notation A number is expressed in scientific notation when it is in the form a x 10 n where a is between 1 and 10 and n is an integer (neg. and pos. whole number)

Write the distance to Proxima Centauri in scientific notation. 40 000 000 km Where is the decimal point now? After the last zero. Where would you put the decimal to make this number be between 1 and 10? Between the 4 and the 0

4. 0, 000, 000. How many decimal places did you move the decimal? 13 When the original number is more than 1, the exponent is positive. The answer in scientific notation is 4. 0 x 1013

Express 0. 0000000902 in scientific notation. Where would the decimal go to make the number be between 1 and 10? 9. 02 The decimal was moved how many places? 8 When the original number is less than 1, the exponent is negative. 9. 02 x 10 -8

Write 28750. 9 in scientific notation. 1. 2. 3. 4. 2. 87509 x 10 -5 2. 87509 x 10 -4 2. 87509 x 105
 •")
Example • Given: 289, 800, 000 • Use: 2. 898 (moved 8 places) • Answer: 2. 898 x 108
 • Answer:")
Example • Given: 0. 000567 • Use: 5. 67 (moved 4 places) • Answer: 5. 67 x 10 -4
")
Write in PROPER scientific notation. (Notice the number is not between 1 and 10) 1) 234. 6 x 10⁹ 2. 346 x 1011 2) 0. 0642 x 104 6. 42 x 102

Write 531. 42 x 105 in scientific notation. 1. 2. 3. 4. 5. 6. 7. . 53142 x 102 5. 3142 x 103 53. 142 x 104 531. 42 x 105 53. 142 x 106 5. 3142 x 107. 53142 x 108

We can also go the other way Express 1. 8 x 10 -4 in decimal notation. 0. 00018 Express 4. 58 x 106 in decimal notation. 4, 580, 000

Example • Given: 5. 093 x 106 • Answer: 5, 093, 000 (moved 6 places to the right)

Example • Given: 1. 976 x 10 -4 • Answer: 0. 0001976 (moved 4 places to the left)

Significant Digits and Scientific Notation • When trying to determine the number of significant digits within scientific notation we leave it the way it is and follow the same rules and pretend the x 10 n is not there. • E. g. – 0. 01130 x 10 -4 has 4 significant digits – 5. 3 x 10¹⁵ has 2 significant digits
 0. 14587 x 10 -4 answer in proper scientific notation to")
Try These 1) 0. 14587 x 10 -4 answer in proper scientific notation to 3 significant digits = 1. 46 x 10 -5 2) 0. 004566 x 105 answer in proper scientific notation to 3 significant digits = 4. 57 x 102

Homework • Scientific Notation and Sig Digs Worksheet 1 and Answers • Scientific Notation Significant Digits Worksheet 2 and Answers


The Scientific Method

The Scientific Method

The Ten Steps of the Scientific Method 1. 2. 3. 4. 5. 6. 7. 8. 9. 10. Questioning Controlling Variables Making a hypothesis Planning Performing Observing Analyzing Discussing Concluding Communicating
 Introduction & Question Introduction • Relevant observations, inferences, background knowledge is provided •")
1) Introduction & Question Introduction • Relevant observations, inferences, background knowledge is provided • Similar to brainstorming Question • Semi-formal • Question should interest you • Question can be about anything • E. g. Are taller people better at basketball than shorter people?
 Controlling the variables • Variables are factors that can affect the outcome of")
2) Controlling the variables • Variables are factors that can affect the outcome of an investigation: 1) Independent variable – variable that is changed 2) Dependent variable – variable that is affected by the independent variable 3) Controlled/Standardizing variable – variable that remains unchanged and does not affect the outcome 4) Control Group – Group that is not changed, normal conditions used to compare results
 An archer tests a bow by seeing how tightening the bow")
Try It 1) An archer tests a bow by seeing how tightening the bow changes how far the arrow can be launched. Independent variable is : Dependent variable is : 2) A student experiments to see if the length of a pendulum affects how fast it swings. Independent variable is : Dependent variable is : 3) A boy tries on different running shoes to see how much each one slides on ice. Independent variable is : Dependent variable is :

Practice Patty Power Mr. Krabbs wants to make Bikini Bottoms a nicer place to live. He has created a new sauce that he thinks will reduce the production of body gas associated with eating crabby patties from the Krusty Krab. He recruits 100 customers with a history of gas problems. He has 50 of them (Group A) eat crabby patties with the new sauce. The other 50 (Group B) eat crabby patties with sauce that looks just like new sauce but is really just mixture of mayonnaise and food coloring. Both groups were told that they were getting the sauce that would reduce gas production. What is the independent variable? _____________ What is the dependent variable? _____________ Which people are in the control group? _____________

Variables Worksheet 1
 Making a hypothesis • A Hypothesis is a tentative answer about the outcome")
3) Making a hypothesis • A Hypothesis is a tentative answer about the outcome of an experiment • Should be presented in an “if / then statement • Should indicate cause and effect relationship for your dependent and independent variables • Can usually be derived directly from your original question • Is an educated guess • Should be only a single sentence • Must be feasibly testable • “IF the independent variable changes in some way THEN it will affect the dependent variable in some way. ” • E. g. If someone is taller then they will be better at basketball.

Create a hypothesis for each of the following 1. Human age and the chance of getting a heart attack. Hypothesis: 2. Skin cancer and the amount of UV light. Hypothesis: 3. Leaf colour change and temperature. Hypothesis: 4. Amount of sleep per night and student test scores. Hypothesis:
 Planning • Identify all your variables • Consider equipment and materials – Make")
4) Planning • Identify all your variables • Consider equipment and materials – Make a materials list using bullet points • Write a clear procedure

Writing a procedure • A procedure is a sequential list of steps that are to be followed exactly during an experiment. Steps should be in order and numbered. • Hints: Be specific, be exact, watch your language. • Try this: – In a group of 2, write up a procedure for washing your hands. Starting from dry hands and ending with dry hands.
 Performing the experiment • Follow procedures exactly, if procedures are unclear ask •")
5) Performing the experiment • Follow procedures exactly, if procedures are unclear ask • Be safe • Record which variables are being changed and how they are being changed • Repeat experiment a minimum of three times. (Why? ) • Make careful notes of everything that occurs during your experiment, in addition to the data filling in charts and tables. Note possible sources of error
 Observing and recording data • Record all data/observations in an appropriate form. (Charts")
6) Observing and recording data • Record all data/observations in an appropriate form. (Charts or tables are most common) • Record all data as clearly and accurately as possible • Make careful notes of everything that occurs during your experiment. • Note possible sources of error in the experiment
 Analyzing results • When possible create graphs to represent numerical data, as it")
7) Analyzing results • When possible create graphs to represent numerical data, as it is easer to read and understand for others • Each table and graph contains a caption (i. e. Table 1, Figure 1 (graphs), etc. ) • Identify patterns and trends in results • Make conclusions • State what occurred/was found by referring to the tables and graphs (i. e. “According to Figure 1…”) • Do not discus the results, just state them.

Graphing Rules for Good Graphing 1. Always give your graph a title in the following form: "The dependence of (your dependent variable) on (your independent variable)”. • Let's say that you're doing a graph where you're studying the effect of temperature on the speed of a reaction. In this reaction, the speed will depend on the temperature – therefore, speed is the dependent variable and temperature is the independent variable. – As a result, the title of your graph will be "The dependence of reaction rate on temperature", 2. The x-axis of a graph is always your independent variable and the y-axis is the dependent variable. For the graph described above, temperature would be on the x-axis (the on the bottom of the graph), and the reaction rate would be on the y-axis (the on the side of the graph)

3. Always label the x and y axes and give units. E. g. temperature on the x-axis would be – Temperature (°C). On the y-axis you would put – Time (s). 4. Make a line graph unless told otherwise but don’t connect the dots. 5. Most of the time, you do not connect the dots on your graph! Instead, do a line of best fit which can be straight or curved but doesn’t go from one dot to another. 6. Make sure your data is graphed as large as possible in the space you've been given.
 There's no title.")
Examples of Graphing Let's see what's wrong with this graph: 1) There's no title. 2) There are no labels on the x or y axis. 3) There are no units on the x or y axis. 4) The dots are connected.

GRAPHING RULES CHECKLIST All graphs made in this course must meet the requirements outlined in the following checklist. 1. Graph paper is used for all graphs ( not lined or plain paper ). 2. Your name and date are to be printed at the top right corner of the page. 3. The axes should be spread out enough to fill at least 2/3 rds of the available space. 4. Title - located above the graph - written in pen - underlined - provides information that relates the dependent variable to the independent variable 5. Axes labels - written in pen - name of variable with units in brackets e. g. mass (kg) 6. Scale – written in pencil - equal mathematical intervals for equal grid squares - horizontal and vertical axes do not necessarily have to be the same scale 7. Points – plot using either ‘ X ’ through the point or circle the point 8. Line of best fit - usually a straight line through at least two plots with equal # of plots above the line and below the line

Determine if the axis are labelled correctly or if they are reversed

Check your answers
 Discussion • Results are discussed and interpreted • Sources of error are identified,")
8) Discussion • Results are discussed and interpreted • Sources of error are identified, discussed in terms of how the results could have been affected, and suggestions of how to improve if the experiment was repeated – do not say human error – be specific • Written in past tense and 3 rd person.
 Conclusion • Hypothesis is restated • Results are summarized • State whether hypothesis")
9) Conclusion • Hypothesis is restated • Results are summarized • State whether hypothesis is accepted or rejected 10) Communicating • Share your process and finding with others by writing a report

Your Lab Reports Introduction: Topic/issue overview and Question Hypothesis: Variables: Materials: Procedure: Results: State what was found by referring to graphs and tables Discussion: Conclusion: **ALL MUST BE DONE IN PAST TENSE AND IN THE THIRD PERSON**

Writing your report • There should be no: – I, We, Our found within your lab report! – E. g. The mouse was placed in the maze not, We placed the mouse in the maze.


Metric Conversions

Metric and Unit Conversions • Metric and Unit conversions are necessary in science since results within experiments may be measured using different equipment. In order to accurately compare results, it is important that we ensure that the units on the measurements match up. • Also, at times it is not practical to use certain units to determine certain quantities e. g. long distances in cm.

How it works • How many millimetres are in 3. 5 metres? We have 3. 5 metres We want millimetres
 • How many mm are in a m? • Answer:")
Conversions (1 st Way) • How many mm are in a m? • Answer: 1000 mm = 1 m • How many mm are in 3. 5 m? ? mm = 1000 mm multiply both sides by 3. 5 m 1 m ? mm (3. 5 m) = 1000 mm (3. 5 m) ? = 3 500 mm 3. 5 m 1 m Therefore there are 3. 5 m in 3 500 mm
 • How many cm are in 2. 45 m? •")
Conversions (1 st Way) • How many cm are in 2. 45 m? • 100 cm = 1 m ? cm = 100 cm multiply both sides by 2. 45 m 1 m ? mm (2. 45 m) = 100 cm (2. 45 m) ? = 245 cm 2. 45 m 1 m Therefore there are 245 cm in 2. 45 m

Conversions • Metric Conversions worksheet • Answer the problems provided
- Slides: 85