Schooling Migration Groupings of fishes Schooling characteristics Fish


")


")


- Slides: 45
Schooling & Migration Groupings of fishes Schooling characteristics Fish migrations Examples
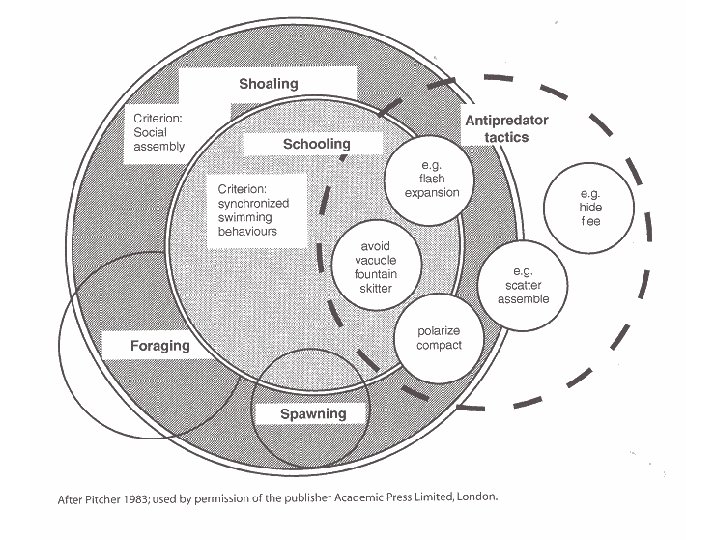
Grouping of Fishes • Social grouping of fishes – Shoals: unorganized – Schools: organized & with polarized swimming • Groupings caused due to resources – Aggregations • Feeding • Spawning
Social Groupings
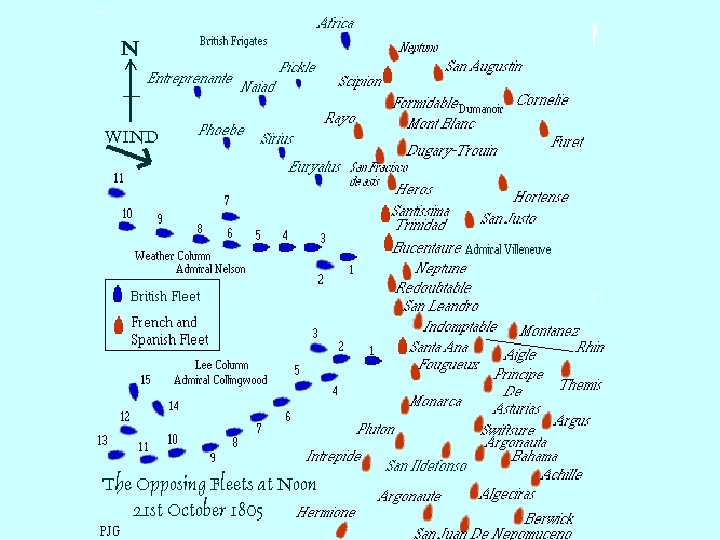
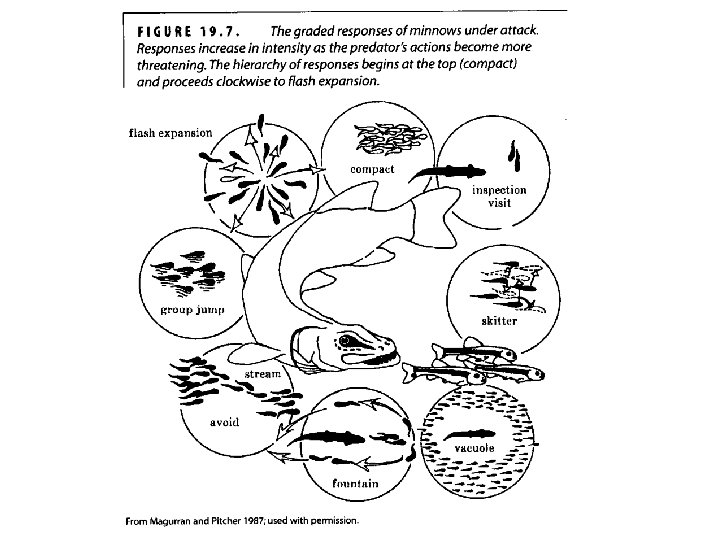
Why of Schools? • Predation avoidance – Dilution effect – Trafalgar effect – Confusion effect
Battle of Trafalgar – Admiral Nelson
Why of Schools? • Reduction of predatory success – Dilution effect – Trafalgar effect – Confusion effect • Increase feeding efficiency
Why of Aggregations? • Reduction of predatory success – Dilution effect – Trafalgar effect – Confusion effect • Increase feeding efficiency • Synchronize spawning activities
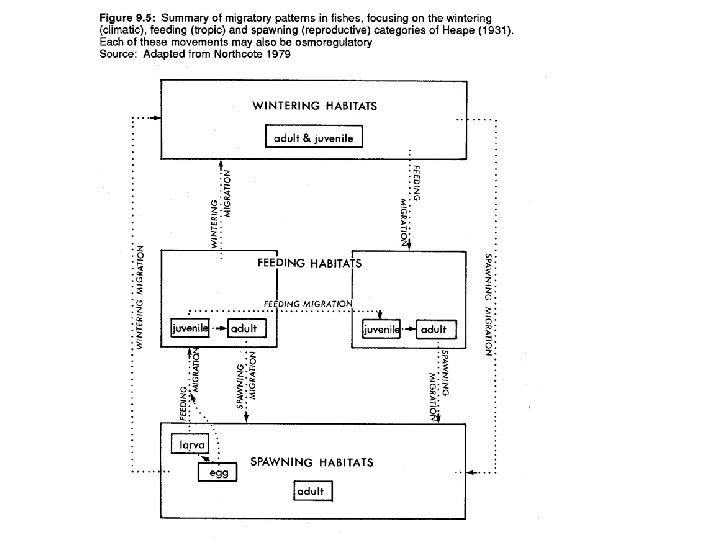
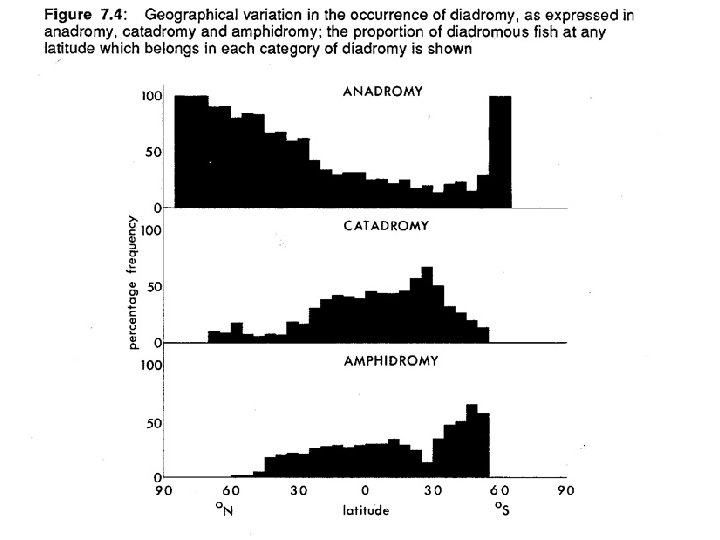
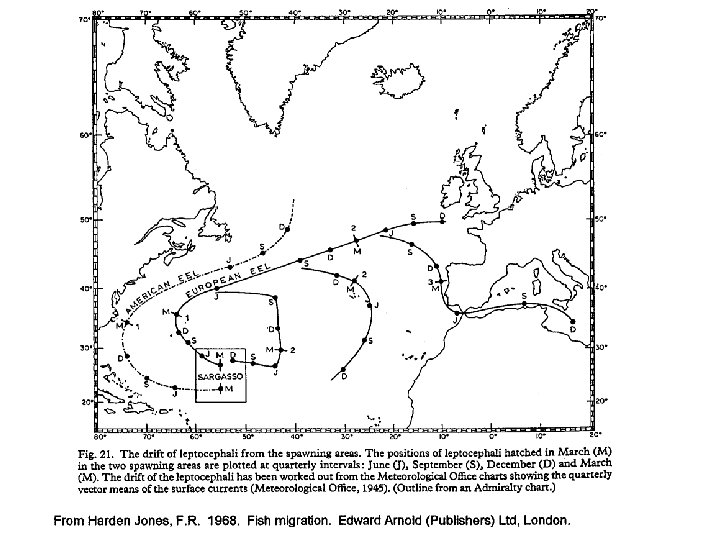
Fish Migrations Mass movement between habitats – Regular in time – According to life history • Oceanodromy (SW) • Potamodromy (FW) • Diadromy – Anadromy (to FW to breed) – Catadromy (to SW to breed) – Amphidromy (not to breed, between SE &FW)
Oceanodromy Scombridae Albacore Thunnus alalunga
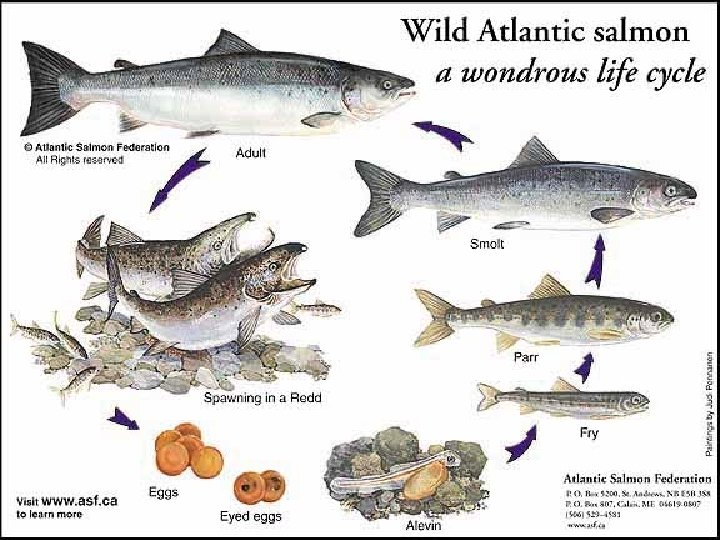
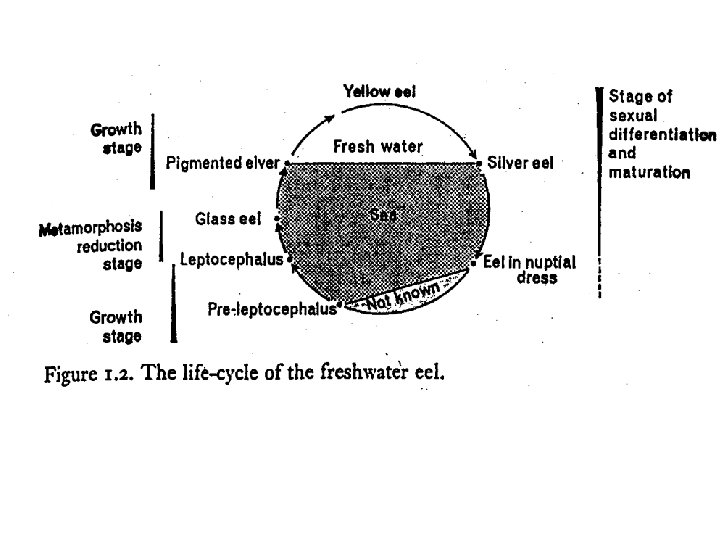
Diadromy (Birth, Growth, Reprod. )
Migration Benefits & Costs • Benefits – Feeding – Avoidance of adverse conditions – Reproduction • Costs – Energy expenditure • Shad up Connecticut River: 50% energy reserves – Increased predation For migration to evolve and be maintained, benefits must exceed costs
Why Diadromy? • Rapid Growth to Adult Size – High Oceanic Productivity at high latitudes – Low Oceanic Productivity at low latitudes • Survival benefits of offspring
Tsukamoto et al. 20002
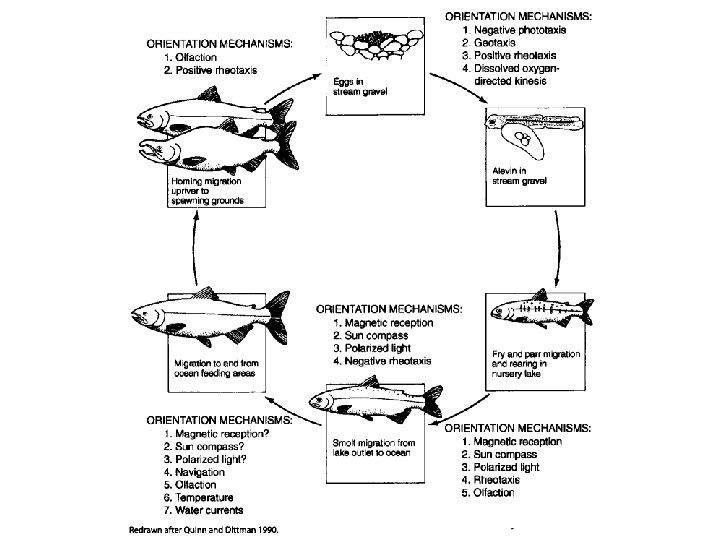
General Oncorhinchus spp. migration path
How do fish orient themselves? • • • Sun position and polarized light Geomagnetic and geoelectric fields Currents (rheotaxis) Olfaction Temperature isolines
Metamorphosis of leptocephalus larva into glass eel stage and then to early pigmented eel stage
Tsukamoto et al. 20002
Tsukamoto et al. 20002
Tsukamoto et al. 20002
Tsukamoto et al. 20002
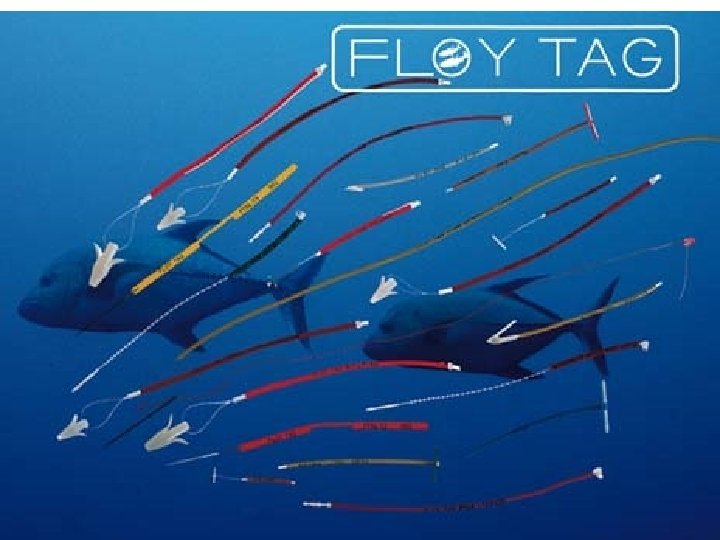
Tagging as a way of studying migrations • Recovery tags – – Spaghetti tags Pit tags, binary code bars Recorder Tags Body markings • Paint marks • Otolith marking • Satellite Pop-Tags
Black Marlin sport fishery tagging
Estimates of Population Size • Proportional sampling • Rp = size of the range of the population (Rp), (uniform distribution) • Rs = size of sampling a region • Ns/Np = Rs/Rp. • Np = (Ns Rp)/Rs = Population Abundance No Accuracy Estimate
Estimates of Population Size • Mark & Recapture – mark – release - recapture • Np = population abundance • M = number of individuals that are marked • n = size of the second sample of organisms • R: number of marked organisms in second sample Np = (M*n)/R Accuracy Estimates Available
Binary Code Tag Pit Tag
Otolith marking
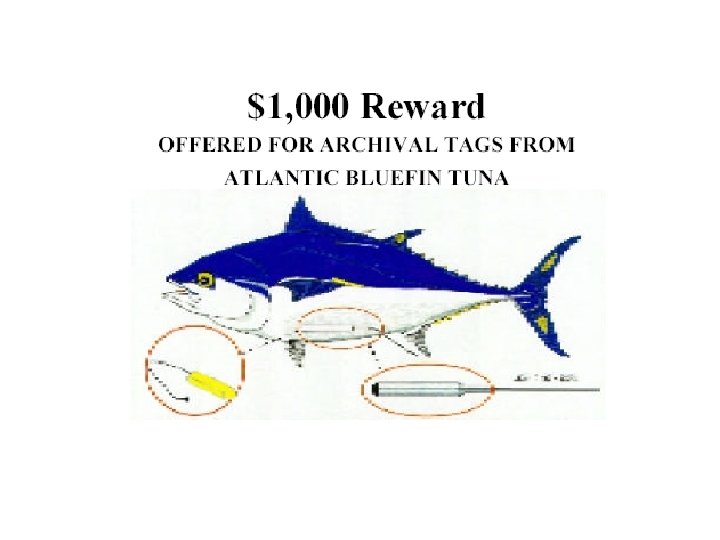
Bluefin Tuna – Archival tags Traditional tagging (need to recapture fish)
PURSE SEINE Average Annual Catches of Yellowfin tuna 1996 -98
Pop-up satellite tags
Pop-up satellite tags
Pop-up Satellite tags