School Segregation An Example of Structure Desegregation Some

: segregated schools were equal • Brown")

: Supreme Court ruled against desegregation plan")

 Whites 51. 5% Blacks 15. 4% Latinos")
 Orfield et al, 2014, p.")


: 177 -205")
 • The parents in the study obtained little firsthand information about the")

- Slides: 26
School Segregation: An Example of Structure
Desegregation: Some History • Plessy v. Ferguson (1896): segregated schools were equal • Brown v. the Board of Education (1954): segregated schools were unequal Thurgood Marshall and two other lawyers who argued for Brown, 1954
Desegregation: Some History • Segregated school system in the South remained intact a full decade after the Brown decision • In the North, schools remained segregated until the mid-1970 s • Because of the 1964 Civil Rights Act, passed by US Congress, the South was more desegregated than any other region in the country by 1970
Paring Back Desegregation • Milliken v. Bradley (1974): Supreme Court ruled against desegregation plan in Detroit that included both the city and surrounding suburbs • Courts have continued to roll back desegregation orders (1991 -1995) • June 2007: The Supreme Court forbade most existing voluntary local efforts to integrate schools
“Schools Resegregate, Study Finds” New York Times 21 January 2003 • Charlotte, North Carolina: the end of unified school districts • Table 3, Orfield et al, 2014, p. 10
Ethnicity of Public School-age Population (2011 -2012) Whites 51. 5% Blacks 15. 4% Latinos 24. 3% Asian-Americans 5. 1% Native Americans 1. 1%
Racial Composition of School Attended by Average: (2011 -2012) Orfield et al, 2014, p. 12 Percentage White Black race in each School Latino Asian % White 72. 5 27. 6 25. 1 38. 9 % Black 8. 3 48. 8 10. 9 10. 7 % Latino 11. 8 17. 1 56. 8 22. 1 % Asian 3. 9 3. 6 4. 7 24. 5 % N. Am. and Multiracial 3. 5 2. 9 2. 5 3. 8
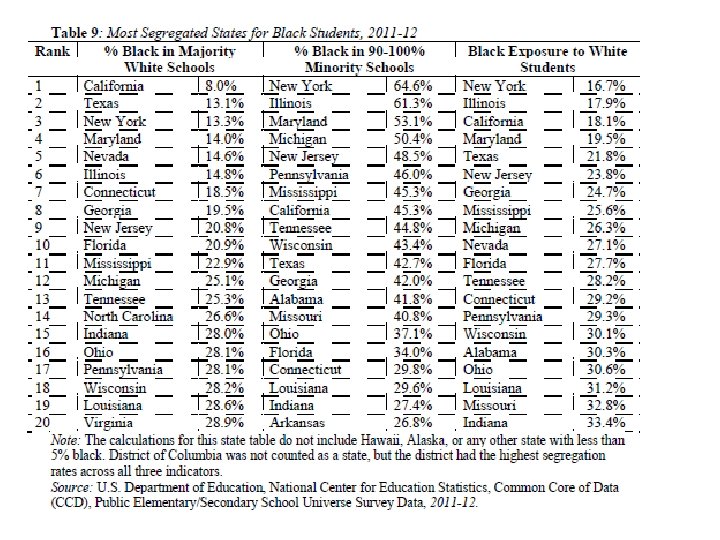
• Table 10
New Jersey is the fifth most segregated state for Black students and Latino students. This has not changed much over time because like other states in the Northeast and Midwest, New Jersey never effectively desegregated.
Why? • One reason New Jersey has such segregated schools is because it has so many small and highly fragmented school districts (N= 616) • Not by county, but townships • Also a matter of diversity • Orfield and Lee advocate for desegregation plans that involve metropolitan areas—cities and suburbs—not just for the city itself
These disparities are clustered according to social class and race. While these are distinct processes, there is also some relationship between them.
18% of children live in poverty* but they tend to live in areas and go to schools where poor children are in the majority. *Federal poverty threshold = $19, 350 for family of four in 2005; Orfield is using reduced or free lunch as the indicator of family National Center for Children in poverty, which goes up to Poverty, Columbia University, “Low-Income Children in the $22, 290 for family of four United States, ” January 2006. (2005 -2006)
Orfield et al, Table 7, p. 16
Relationship between Concentrated Poverty & School Achievement • Loss of successful role models: Adults that a child sees are unemployed or working lowpaying jobs • Loss of access to networks to get jobs • Loss of resources to support high-quality schools • Schools with many poor children need even more services (language training, special education, social work and counseling) but generally are more poorly funded than schools serving middle-class students
What Is At Stake • Giving African-American and Latino students access to the resources White students have, which can lead to higher aspirations, academic achievement, and life chances • Changes in attitudes of all students towards living and working in multiracial settings and an increased sense of civic engagement
The underlying problem is neighborhood segregation, by class and race. Schools reflect that segregation, but do not create it.
Neighborhoods Provide and determine: • education • recreational facilities • insurance rates • employment • transportation • safety • health
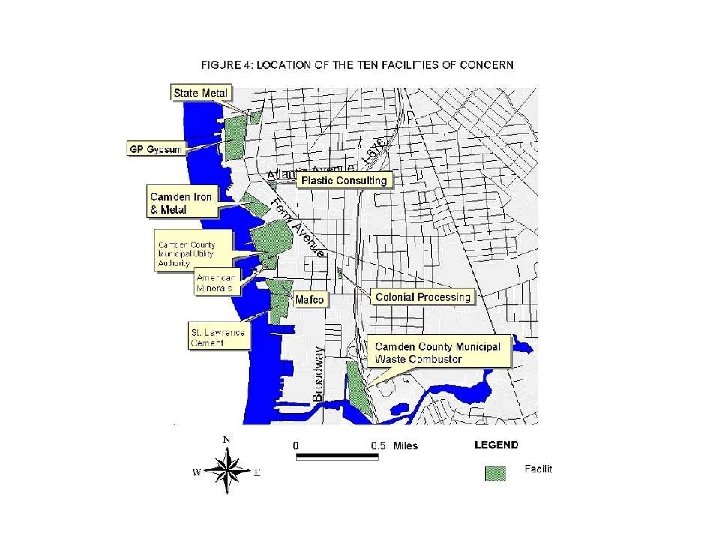
What happens when poor people are concentrated together? • Loss of businesses: grocery stores, banks, etc • Loss of political power: environmental discrimination (waste processing facilities and chemical plants) • Lower property values: deteriorating buildings and unsavory facilities (jails) • Loss of medical facilities and clinics • Loss of revenue for public schools Massey, Douglas S. 1990. “American Apartheid: Segregation and the Making of the Underclass. American Journal of Sociology 96(2): 329 -357
While the majority of poor people are white, they are less likely than poor African-Americans and Latinos to live in neighborhoods of concentrated poverty.
Racial discrimination combines with class segregation for African-Americans and Latinos to produce “hyper-segregation, ” particularly in old industrial areas of the Midwest and Northeast.
Three-quarters of African. Americans live in highly segregated neighborhoods today, whereas 90 -100% of other groups experience only moderate levels of segregation. Massey, Douglas S. and Mary J. Fischer. 2000. “How Segregation Concentrates Poverty. ” Ethnic and Racial Studies 23(4): 670 -691.
Jennifer Holme. 2002. “Buying Homes, Buying Schools, ” Harvard Educational Review 72(2): 177 -205 • Her study of the home-buying habits of mostly white upper-middle class parents in California found that they chose the neighborhood/school based not on the quality of the school (test scores, etc) but on the class and race of the children attending that school.
Holme (2002) • The parents in the study obtained little firsthand information about the schools they chose or rejected before deciding to move “for the schools, ” relying instead on their social networks (other parents) for school information. • Through those networks, parents felt that schools serving whiter, wealthier students were, in fact, better schools.
Three routes that activists and the courts have taken to remedy disparities between school districts: • Busing and school desegregation • Equal funding between districts • Affordable and mixed-income housing Facing the State Capitol, Wendell Harris of Philadelphia Home and School Council addressed hundreds of Philadelphians who rallied for school funding May 5, 2003.