
School of Psychology Dpt Experimental Psychology Design and
- Slides: 17
School of Psychology Dpt. Experimental Psychology Design and Data Analysis in Psychology I English group (A) Salvador Chacón Moscoso Susana Sanduvete Chaves Milagrosa Sánchez Martín
Design and Data Analysis in Psychology I Lesson 1 Fundamental concepts
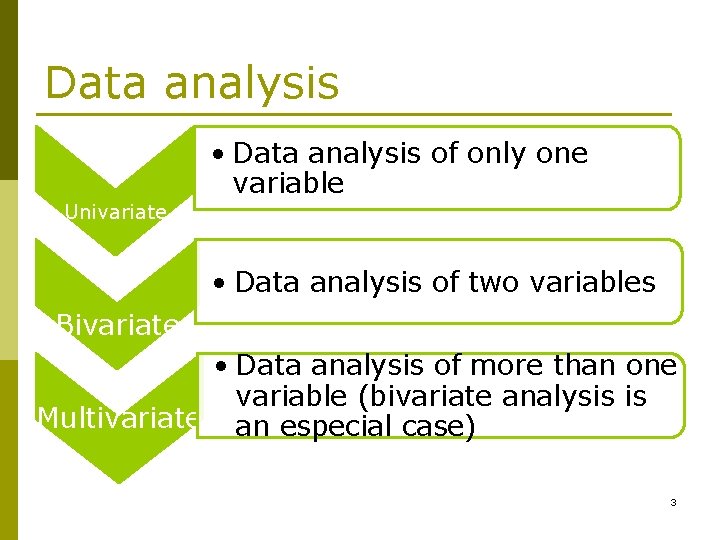
Data analysis Univariate • Data analysis of only one variable • Data analysis of two variables Bivariate • Data analysis of more than one variable (bivariate analysis is Multivariate an especial case) 3
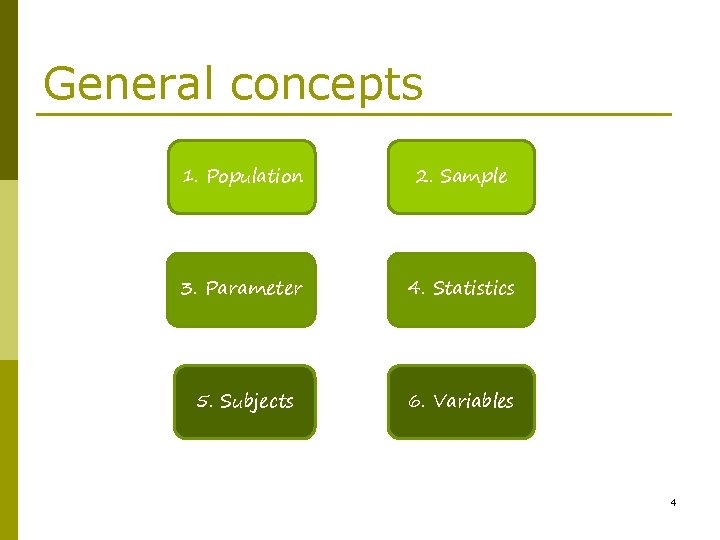
General concepts 1. Population 2. Sample 3. Parameter 4. Statistics 5. Subjects 6. Variables 4
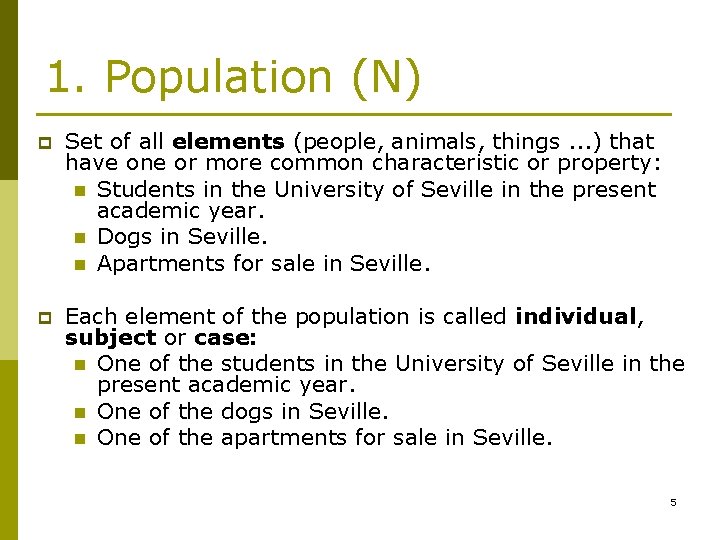
1. Population (N) p Set of all elements (people, animals, things. . . ) that have one or more common characteristic or property: n Students in the University of Seville in the present academic year. n Dogs in Seville. n Apartments for sale in Seville. p Each element of the population is called individual, subject or case: n One of the students in the University of Seville in the present academic year. n One of the dogs in Seville. n One of the apartments for sale in Seville. 5
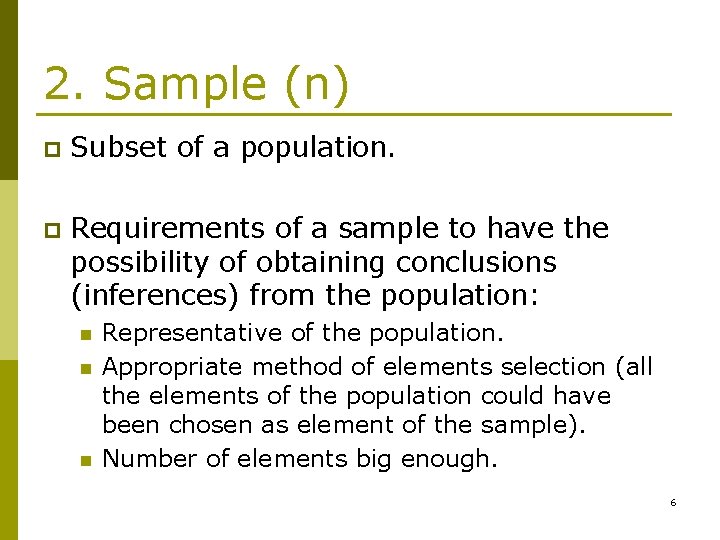
2. Sample (n) p Subset of a population. p Requirements of a sample to have the possibility of obtaining conclusions (inferences) from the population: n n n Representative of the population. Appropriate method of elements selection (all the elements of the population could have been chosen as element of the sample). Number of elements big enough. 6
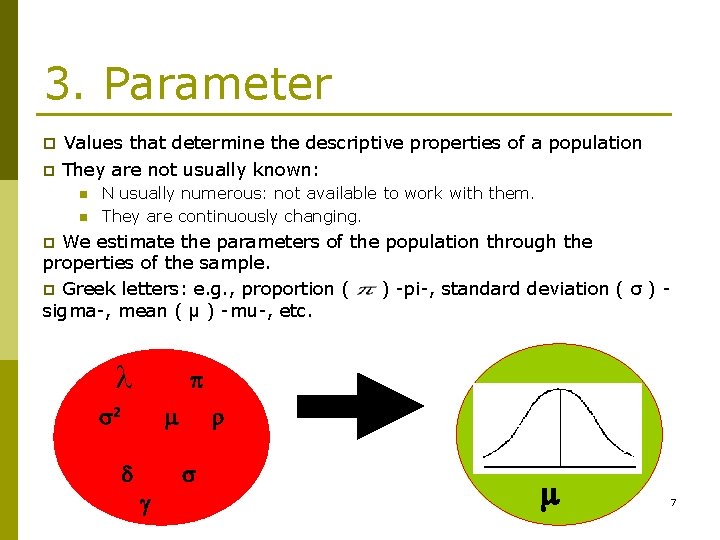
3. Parameter p Values that determine the descriptive properties of a population p They are not usually known: n n N usually numerous: not available to work with them. They are continuously changing. We estimate the parameters of the population through the properties of the sample. p Greek letters: e. g. , proportion ( ) -pi-, standard deviation ( σ ) sigma-, mean ( μ ) -mu-, etc. p l 2 7
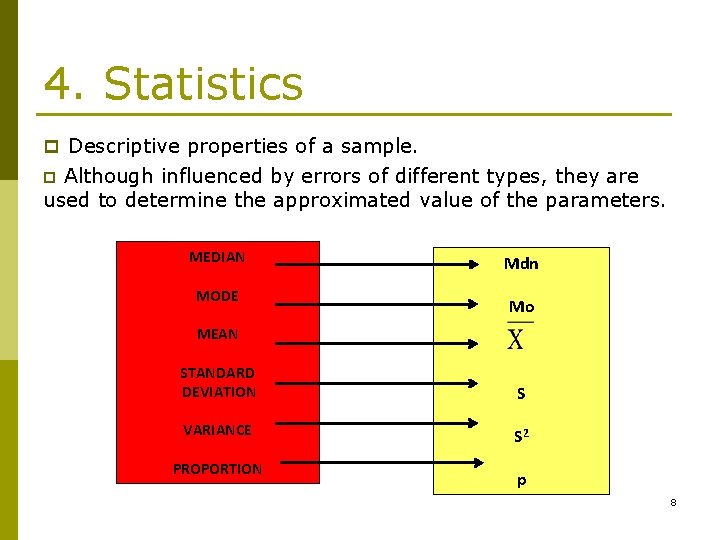
4. Statistics p Descriptive properties of a sample. Although influenced by errors of different types, they are used to determine the approximated value of the parameters. p MEDIAN MODE Mdn Mo MEAN STANDARD DEVIATION S VARIANCE S 2 PROPORTION p 8
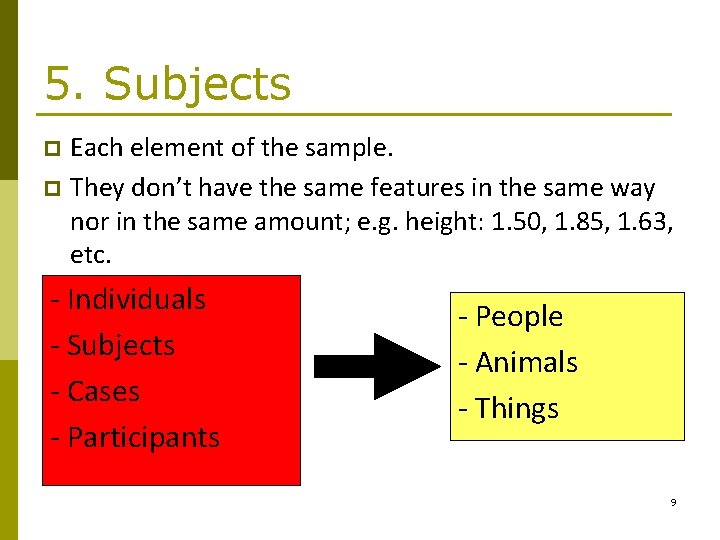
5. Subjects Each element of the sample. p They don’t have the same features in the same way nor in the same amount; e. g. height: 1. 50, 1. 85, 1. 63, etc. p - Individuals - Subjects - Cases - Participants - People - Animals - Things 9
6. Variables p A set of different values. p A constant has only one value. n Height, marital status, size, etc. p They can be measured with statistical techniques. p There is a classification of variables according to the type of mathematical operations that we are allowed to do with the assigned numbers (Stevens’ classification). 10
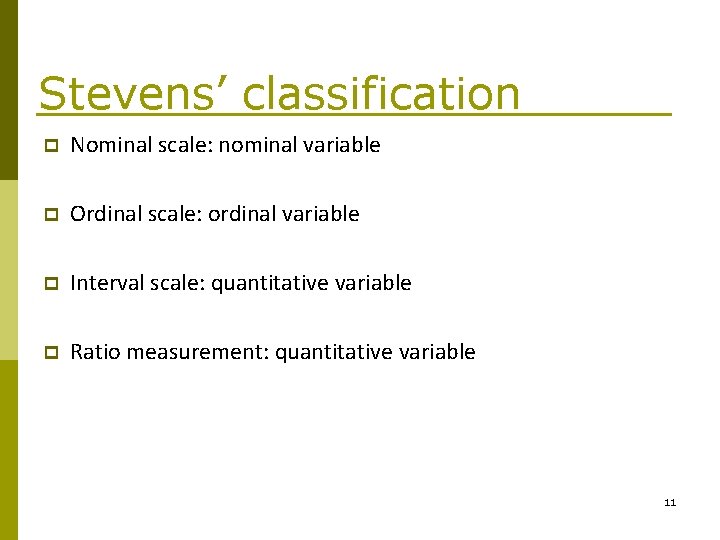
Stevens’ classification p Nominal scale: nominal variable p Ordinal scale: ordinal variable p Interval scale: quantitative variable p Ratio measurement: quantitative variable 11
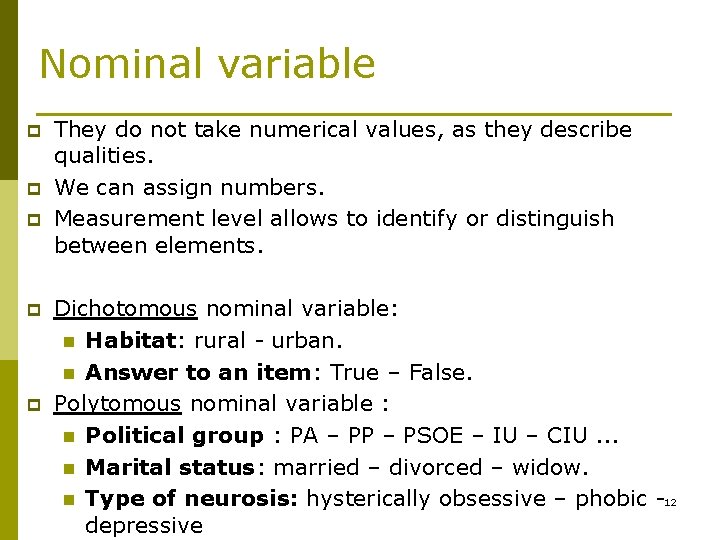
Nominal variable p p p They do not take numerical values, as they describe qualities. We can assign numbers. Measurement level allows to identify or distinguish between elements. Dichotomous nominal variable: n Habitat: rural - urban. n Answer to an item: True – False. Polytomous nominal variable : n Political group : PA – PP – PSOE – IU – CIU. . . n Marital status: married – divorced – widow. n Type of neurosis: hysterically obsessive – phobic -12 depressive
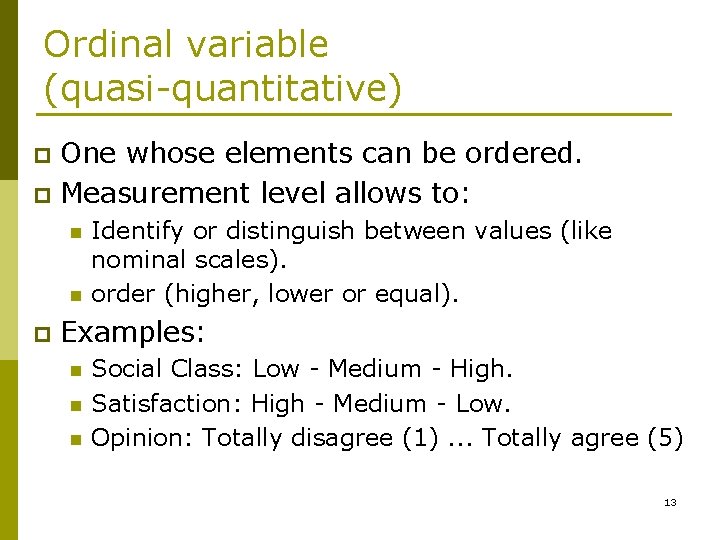
Ordinal variable (quasi-quantitative) One whose elements can be ordered. p Measurement level allows to: p n n p Identify or distinguish between values (like nominal scales). order (higher, lower or equal). Examples: n n n Social Class: Low - Medium - High. Satisfaction: High - Medium - Low. Opinion: Totally disagree (1). . . Totally agree (5) 13
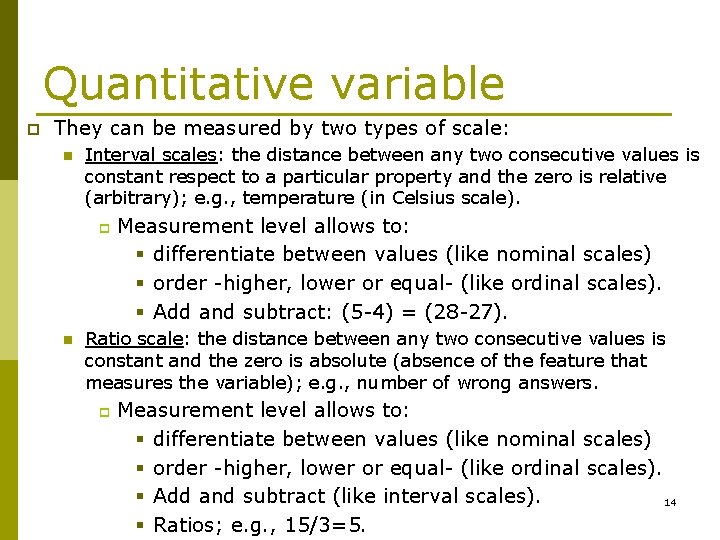
Quantitative variable p They can be measured by two types of scale: n Interval scales: the distance between any two consecutive values is constant respect to a particular property and the zero is relative (arbitrary); e. g. , temperature (in Celsius scale). p n Measurement level allows to: § differentiate between values (like nominal scales) § order -higher, lower or equal- (like ordinal scales). § Add and subtract: (5 -4) = (28 -27). Ratio scale: the distance between any two consecutive values is constant and the zero is absolute (absence of the feature that measures the variable); e. g. , number of wrong answers. p Measurement level allows to: § differentiate between values (like nominal scales) § order -higher, lower or equal- (like ordinal scales). § Add and subtract (like interval scales). 14 § Ratios; e. g. , 15/3=5.
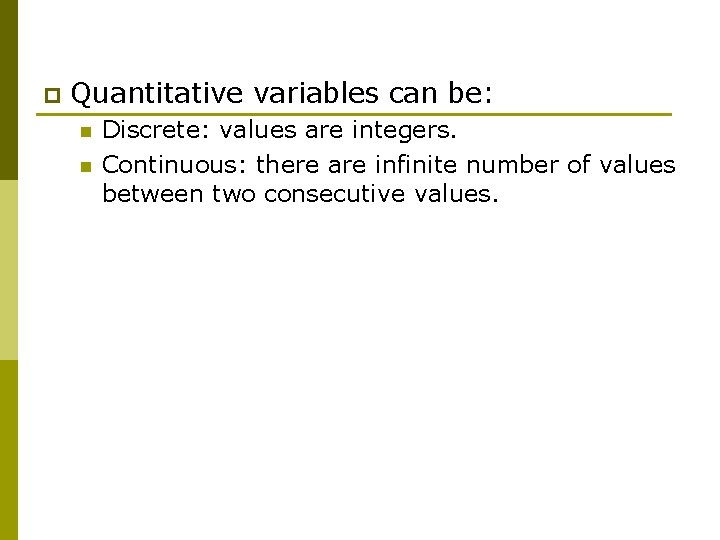
p Quantitative variables can be: n n Discrete: values are integers. Continuous: there are infinite number of values between two consecutive values.
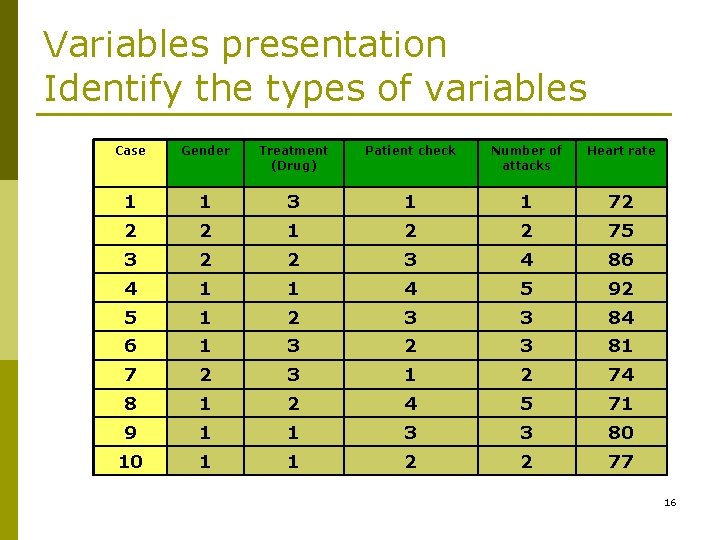
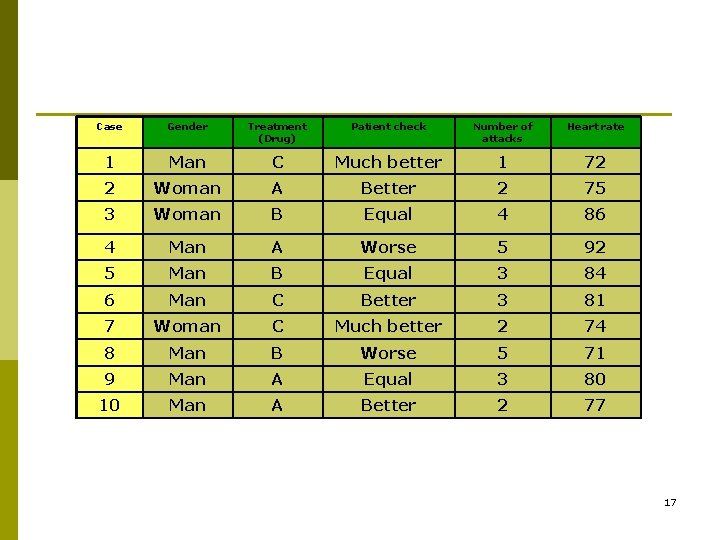
Variables presentation Identify the types of variables Case Gender Treatment (Drug) Patient check Number of attacks Heart rate 1 1 3 1 1 72 2 2 1 2 2 75 3 2 2 3 4 86 4 1 1 4 5 92 5 1 2 3 3 84 6 1 3 2 3 81 7 2 3 1 2 74 8 1 2 4 5 71 9 1 1 3 3 80 10 1 1 2 2 77 16
Case Gender Treatment (Drug) Patient check Number of attacks Heart rate 1 Man C Much better 1 72 2 Woman A Better 2 75 3 Woman B Equal 4 86 4 Man A Worse 5 92 5 Man B Equal 3 84 6 Man C Better 3 81 7 Woman C Much better 2 74 8 Man B Worse 5 71 9 Man A Equal 3 80 10 Man A Better 2 77 17