
School Based Leadership Team Year Two Day Two
School Based Leadership Team Year Two, Day Two A collaborative project between the Florida Department of Education and the University of South Florida. Rt. I. usf. edu
Advance Organizer Data & Homework Review Tier 1 Data Indicating Tier 2 Needs Tier 2 Defined & Characterized Standard Treatment Protocol Strategies for Identifying Tier 2/Standard Protocol Needs Tier 2 and the K-12 Reading Plan Decision Making at Tier 2 Exercises - Determining Needs, Grouping Students Homework
Tier I Problem Identification Worksheet Feedback Activity 1. What components of Tier I Problem Identification did your School-Based Leadership Team (SBLT) master? 2. For which components did your SBLT have more difficulty? 3. How much Tier I Problem-Solving do you believe is occurring at your school? 4. What additional training and practice do staff at your school need to be able to engage in Tier I Problem Identification?
Homework Review What descriptions did you develop for: § Facilitator § Timekeeper § Recorder Who did you assign to each and why?
Tier I Problem Solving Implementation Activity 1. How much progress occurred in Tier I and II implementation of PS/Rt. I practices as evidenced by permanent products (i. e. , documentation) from data meetings 2. How consistent are the data from the Tier I/II Critical Components Checklist with your team’s perception of how much implementation occurred? 3. What are some potential reasons for differences in the team’s perception versus what was reflected in permanent products? 4. Based on the data you’ve been provided and your discussions today, what are some implications for your School-Based Leadership Team when you return to your school?
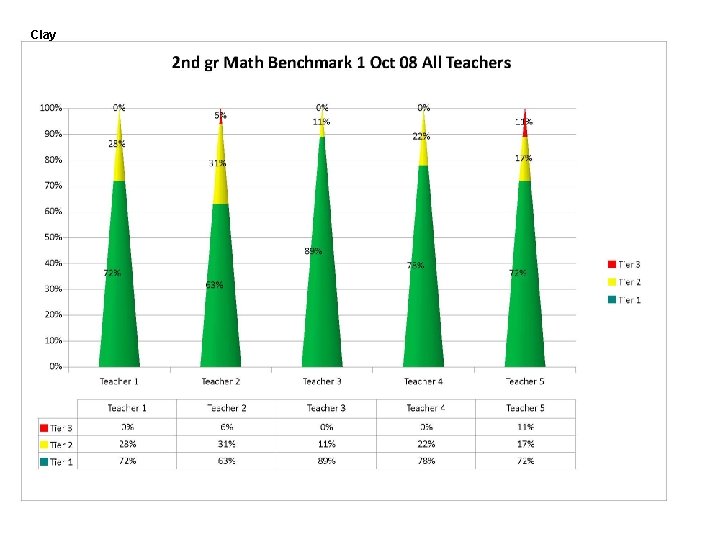
Tier I Data Examples
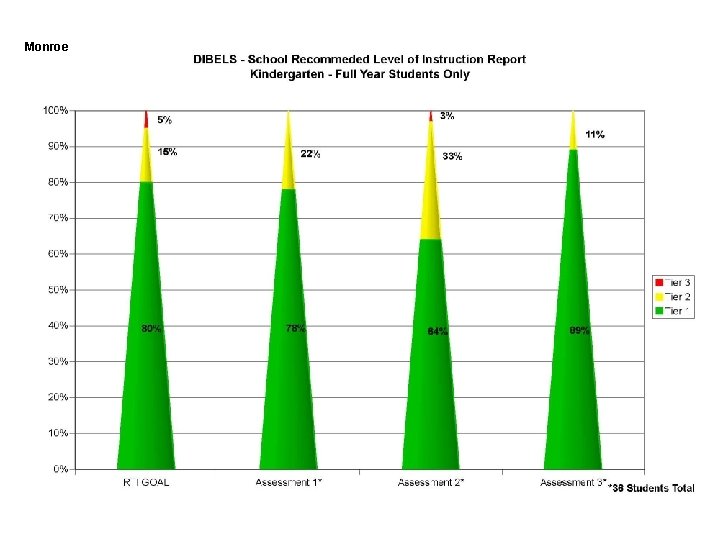
Monroe
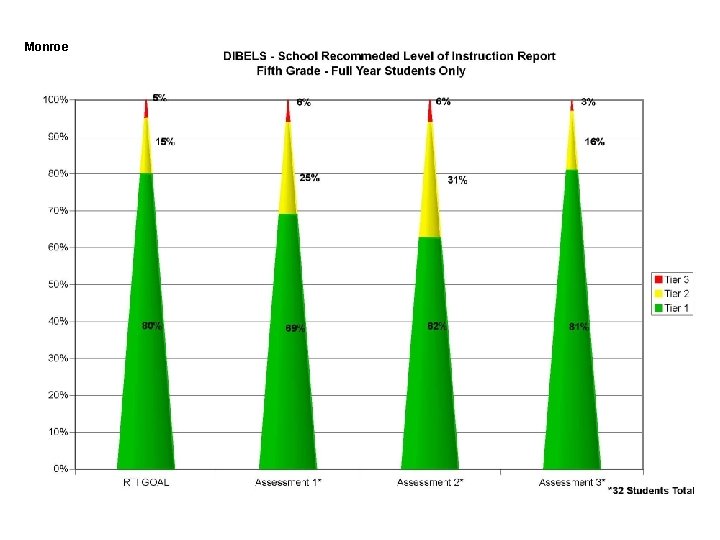
Monroe
Clay
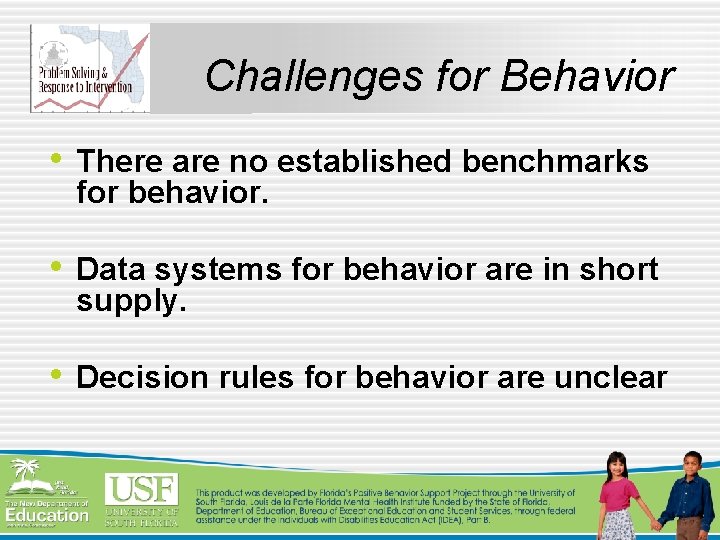
Challenges for Behavior • There are no established benchmarks for behavior. • Data systems for behavior are in short supply. • Decision rules for behavior are unclear
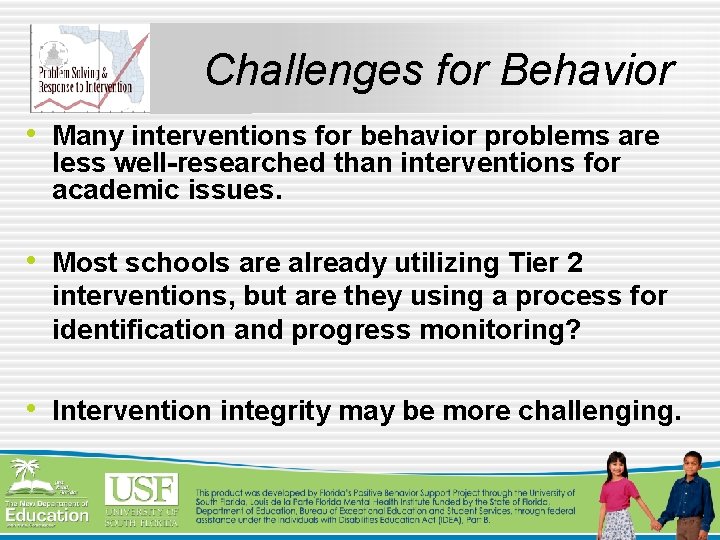
Challenges for Behavior • Many interventions for behavior problems are less well-researched than interventions for academic issues. • Most schools are already utilizing Tier 2 interventions, but are they using a process for identification and progress monitoring? • Intervention integrity may be more challenging.
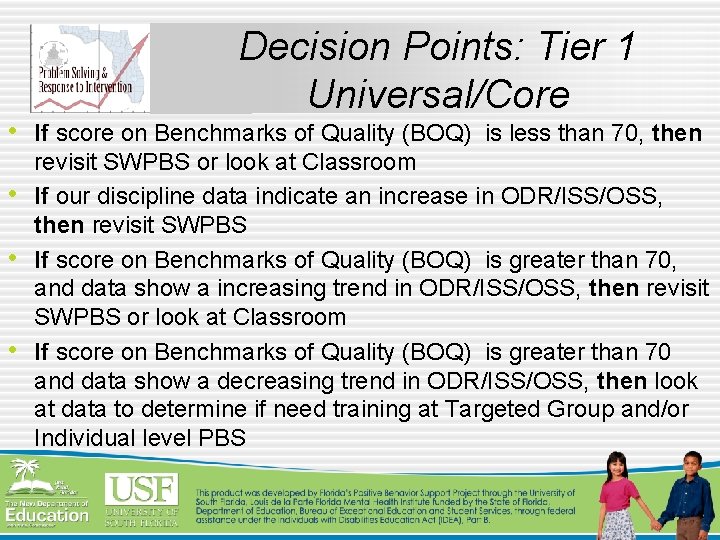
Decision Points: Tier 1 Universal/Core • If score on Benchmarks of Quality (BOQ) is less than 70, then • • • revisit SWPBS or look at Classroom If our discipline data indicate an increase in ODR/ISS/OSS, then revisit SWPBS If score on Benchmarks of Quality (BOQ) is greater than 70, and data show a increasing trend in ODR/ISS/OSS, then revisit SWPBS or look at Classroom If score on Benchmarks of Quality (BOQ) is greater than 70 and data show a decreasing trend in ODR/ISS/OSS, then look at data to determine if need training at Targeted Group and/or Individual level PBS
Decision Points: Tier 1/2 Classroom • If most of ODRs (over 50%) are coming from many classrooms, • • then revisit SWPBS application in all classrooms If a few classrooms are responsible for the majority of ODRs, then look at Classroom PBS using the Classroom Consultation Guide If score on Benchmarks of Quality (BOQ) is less than 70, then revisit SWPBS or look at Classroom PBS using the Classroom Consultation Guide If our discipline data indicate an increase in ODR/ISS/OSS and most of the referrals are coming from many classrooms, then revisit SWPBS application in all classrooms If a classroom has received support, the interventions were done with fidelity and the behavior of the student has not improved, then consider Tier 2 supports for the student
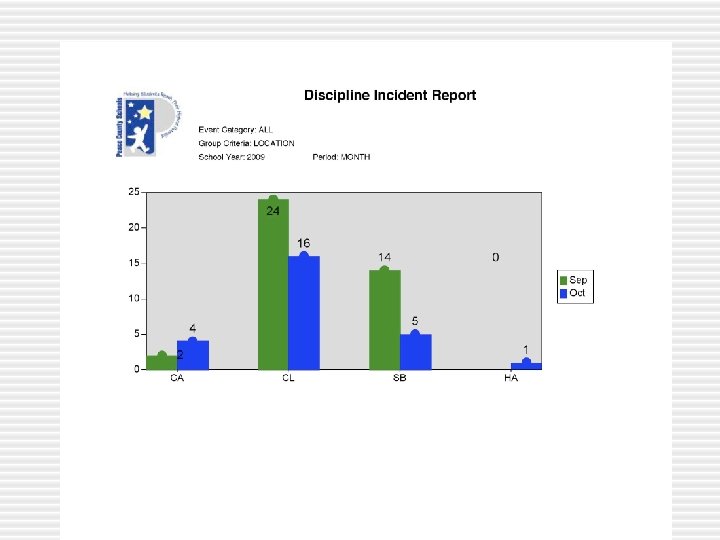
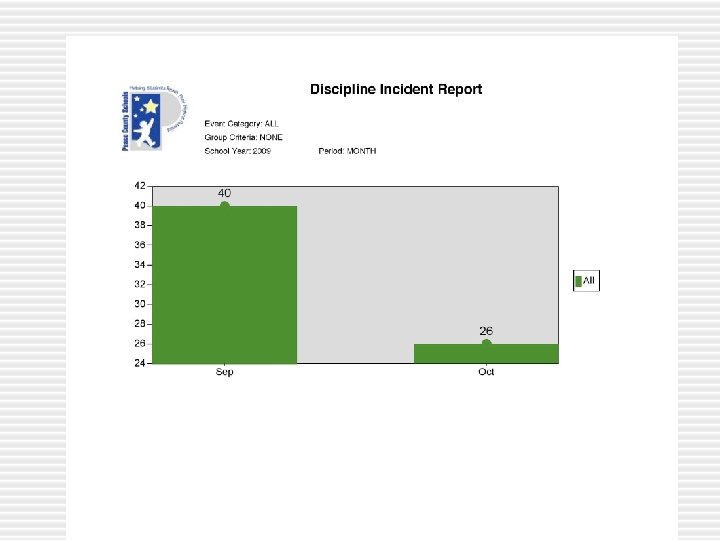
Identifying Students in Need of Tier 2 Supports • • • Office Discipline Referrals Nomination Process Minor/Classroom Referral Forms EBD referrals Parent nominations
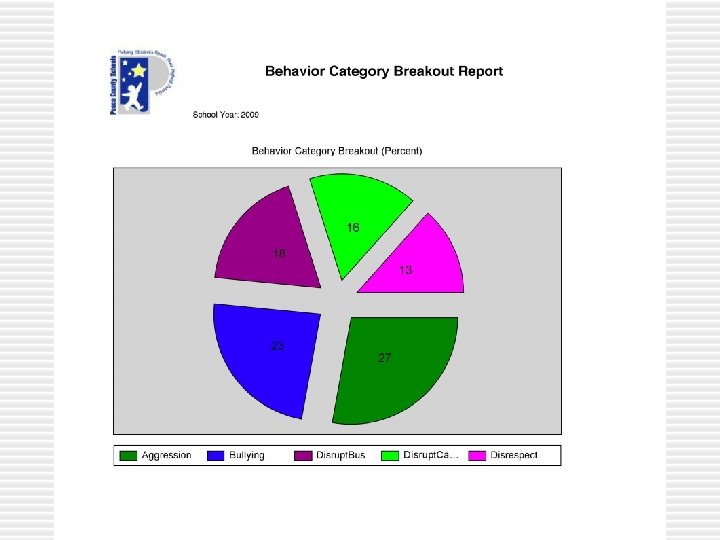
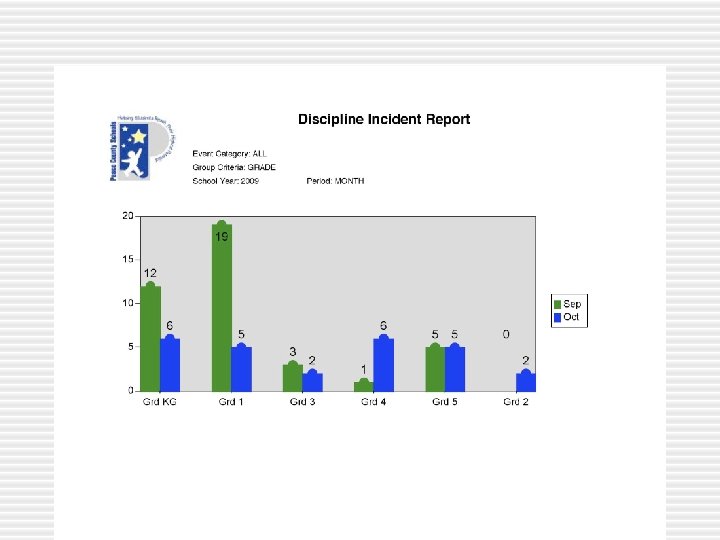
Identifying Students of Concern • 2 -3 times/year teachers “nominate” and rank students based on behaviors of concern • Identify top 3 students § Externalizing § Internalizing
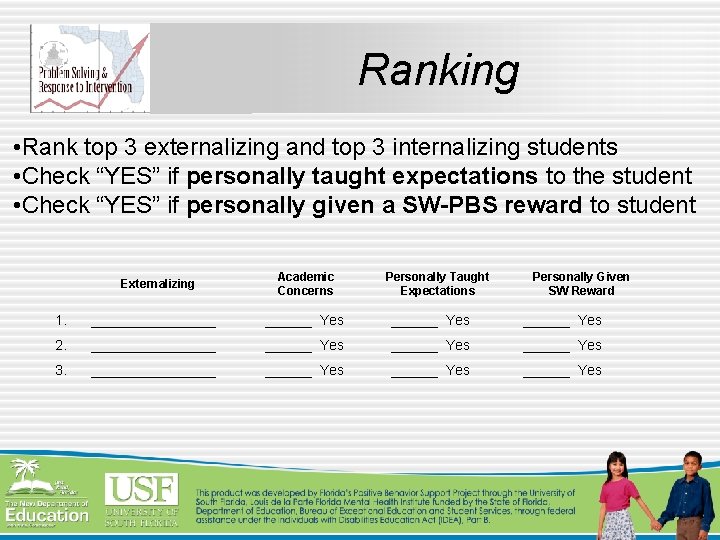
Ranking • Rank top 3 externalizing and top 3 internalizing students • Check “YES” if personally taught expectations to the student • Check “YES” if personally given a SW-PBS reward to student Externalizing Academic Concerns Personally Taught Expectations Personally Given SW Reward 1. ________ Yes ______ Yes 2. ________ Yes ______ Yes 3. ________ Yes ______ Yes
Suggestions • Individual Teacher Approach § Every teacher identifies top 3 internalizers/3 externalizers § Need to prioritize students • Team/Grade Level Approach § Each team/grade level identifies top 3 internalizers/3 externalizers § May not need to prioritize students • Prioritizing Students § Based on data collected (see Student Identification Worksheet blank Problem Solving Guide, pg 2)
Summary of Identifying Students • ODRs and nomination processes are easy and effective • Nominations should occur at least 2 times a year but with • • opportunities for new students or situations School-based teams or individual teachers may nominate One school team member will summarize data from nomination process and ODR data Grade level teams may still wish to prioritize students in need of limited resources Minor/Classroom Forms • For more information: flpbs. fmhi. usf. edu
Tier 2 Defined & Characterized
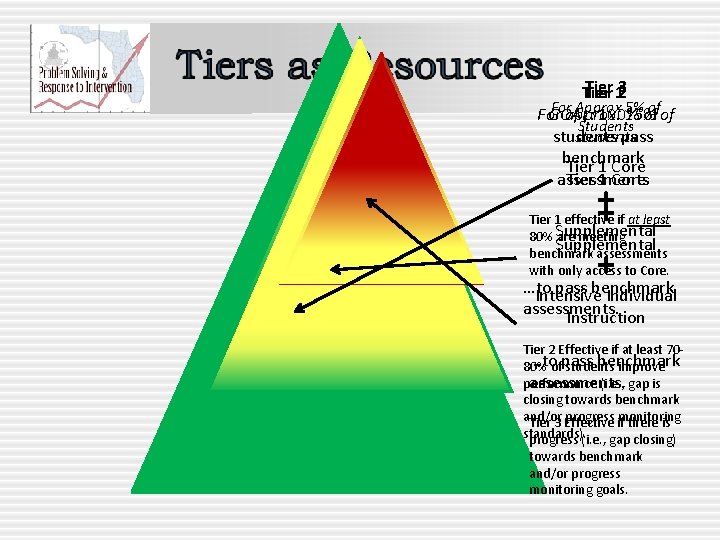
Tier 13 2 Forapprox. Approx 5%of ofof GOAL: 100% For 15% Students students pass students benchmark Tier 1 Core assessments Tier 1 Core ++ Supplemental + …to pass benchmark Tier 1 effective if at least 80% are meeting benchmark assessments with only access to Core. Intensive Individual assessments. Instruction Tier 2 Effective if at least 70…toofpass benchmark 80% students improve performance (i. e. , gap is assessments. closing towards benchmark and/or progress ifmonitoring Tier 3 Effective there is standards). progress (i. e. , gap closing) towards benchmark and/or progress monitoring goals.
Vicks Analogy
Tier 2 Defined • Office of Special Education Programs (OSEP) § “Tier Two is small-group supplemental instruction (ratio of up to one teacher to five students, 1: 5) provided by a specialist, tutor, or special education teacher to students who fail to make adequate progress in the general classroom. Tier Two includes programs, strategies, and procedures designed and employed to supplement, enhance, and support Tier One instruction to all students. ”
Tier 2 Characterized • Resources = Knowledge, Strategies, • • • Programs, Time, Materials, and Personnel. DOES NOT have to be a packaged program produced by a publishing company. But it should be research-validated. OSEP: (http: //www. osepideasthatwork. org/toolkit/ta_responsiveness_intervention. asp) § “Tier Two includes programs, strategies, and procedures designed and employed to supplement, enhance, and support Tier One instruction to all students. “
Tier 2 Characterized • In coordination with and supplemental to healthy Tier 1 • • instruction Available in general education settings Increasingly Intensified Service: § § § Instruction and Assessments matched to student needs More time to practice/increased practice items Increase Academic Engaged Time (AET) Focused/Narrow skills or content Direct Instruction of content Increased frequency of progress monitoring/assessment • Provided as soon as students identified as “at-risk” through benchmark/screening assessments.
Tier Two Approaches to Interventions • Problem Solving • Standard Treatment Protocol • Blended approach
Standard Protocol approach • Standard, research-based interventions • Small groups, similar needs • Common skill deficits, predictable patterns
Standard Protocol approach • Select from “intervention bank” • Often “scripted” interventions • Typically 3 -5 x/week, 20 -40 minutes duration • Supported by PS team
Standard Protocol approach • Screen all students • Identify students needing support in given skill area/similar needs • Provide pre-determined, researchbased interventions • Monitor progress
Problem Solving approach • Screen all students • Identify students needing support • Explore reasons for problem occurrence • Develop/implement interventions based on individual needs • Monitor progress
Blended approach • Screen all students • Identify students needing additional • • • support - minimal problem analysis Implement pre-determined, research-based interventions (standard protocol) Monitor progress If poor response, return to problem solving steps to customize intervention
Problem Solving vs. Standard Protocol? • Both designed to reach targets/goals • Both support student learning Biggest differences: • Tier Two • Level of Problem Analysis
So… IF: Both problem solving and standard protocol are part of larger, Problem Solving System… THEN: Rt. I-Problem Analysis and Rt. I-Standard Protocol may be less confusing, more accurate (Christ, Burns, & Ysseldyke, 2005)
Rt. I-Problem Analysis • Use assessment process to • Identify interventions that are • Linked to problem occurrence and that • Have high likelihood of successful outcome
Rt. I-Standard Protocol • Minimal assessment used to • Group students by similar need • Administer common, predetermined interventions with proven effectiveness
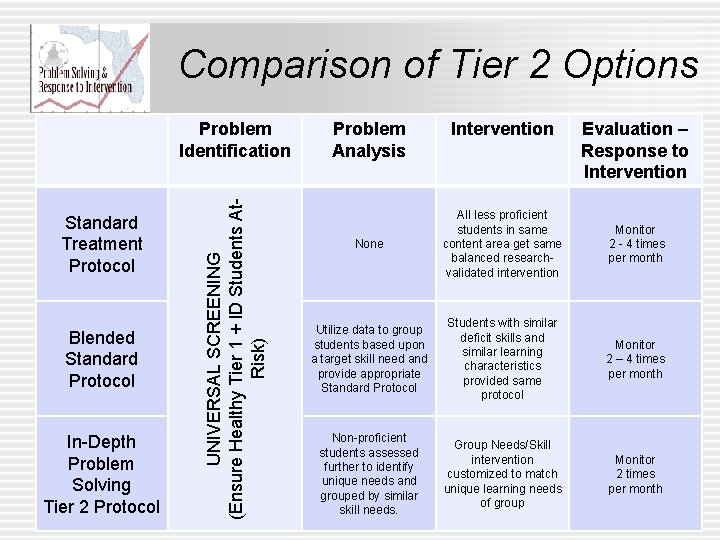
Comparison of Tier 2 Options Standard Treatment Protocol Blended Standard Protocol In-Depth Problem Solving Tier 2 Protocol UNIVERSAL SCREENING (Ensure Healthy Tier 1 + ID Students At. Risk) Problem Identification Problem Analysis Intervention Evaluation – Response to Intervention None All less proficient students in same content area get same balanced researchvalidated intervention Monitor 2 - 4 times per month Utilize data to group students based upon a target skill need and provide appropriate Standard Protocol Students with similar deficit skills and similar learning characteristics provided same protocol Monitor 2 – 4 times per month Non-proficient students assessed further to identify unique needs and grouped by similar skill needs. Group Needs/Skill intervention customized to match unique learning needs of group Monitor 2 times per month
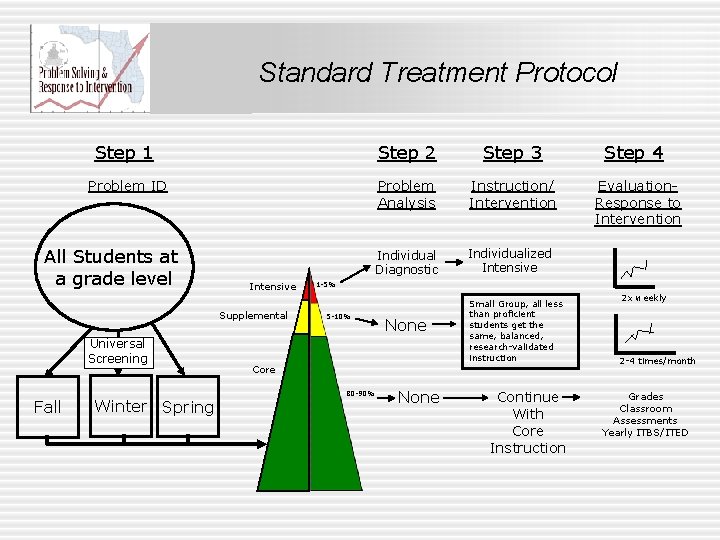
Standard Treatment Protocol Step 1 Step 2 Step 3 Step 4 Problem ID Problem Analysis Instruction/ Intervention Evaluation. Response to Intervention Individual Diagnostic Individualized Intensive All Students at a grade level Intensive Supplemental Universal Screening Fall Winter Spring 1 -5% 5 -10% None Small Group, all less than proficient students get the same, balanced, research-validated instruction Core 80 -90% None Continue With Core Instruction 2 x weekly 2 -4 times/month Grades Classroom Assessments Yearly ITBS/ITED
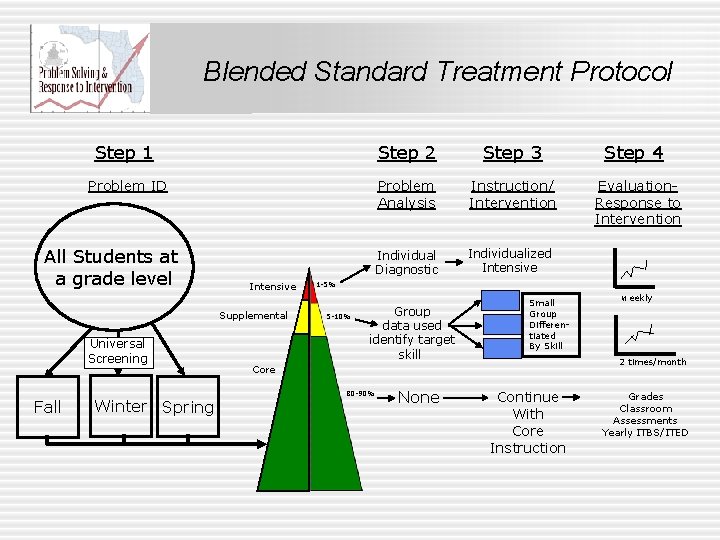
Blended Standard Treatment Protocol Step 1 Step 2 Step 3 Step 4 Problem ID Problem Analysis Instruction/ Intervention Evaluation. Response to Intervention Individual Diagnostic Individualized Intensive All Students at a grade level Intensive Supplemental Universal Screening Fall Winter Spring 1 -5% 5 -10% Group data used identify target skill Small Group Differentiated By Skill 2 times/month Core 80 -90% None weekly Continue With Core Instruction Grades Classroom Assessments Yearly ITBS/ITED
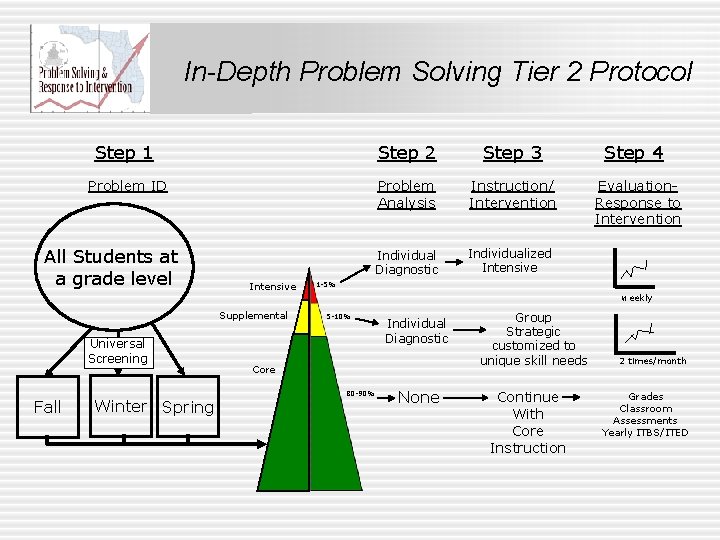
In-Depth Problem Solving Tier 2 Protocol Step 1 Step 2 Step 3 Step 4 Problem ID Problem Analysis Instruction/ Intervention Evaluation. Response to Intervention Individual Diagnostic Individualized Intensive All Students at a grade level Intensive Supplemental Universal Screening Fall Winter Spring 1 -5% weekly 5 -10% Individual Diagnostic Core 80 -90% None Group Strategic customized to unique skill needs Continue With Core Instruction 2 times/month Grades Classroom Assessments Yearly ITBS/ITED
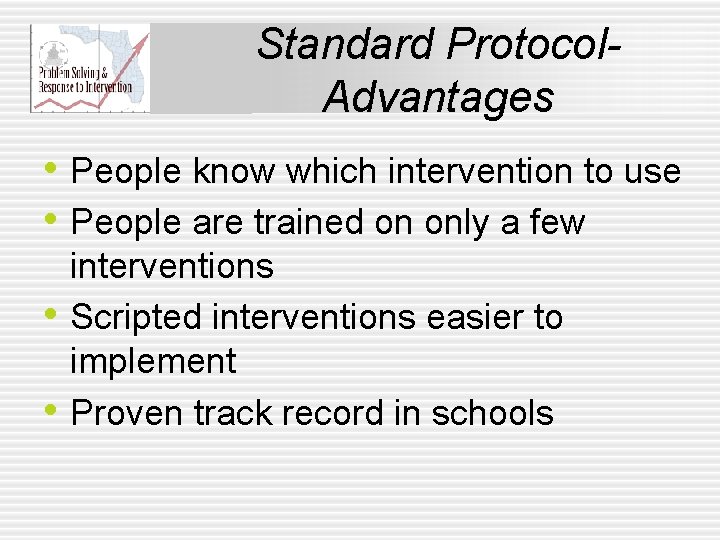
Standard Protocol. Advantages • People know which intervention to use • People are trained on only a few • • interventions Scripted interventions easier to implement Proven track record in schools
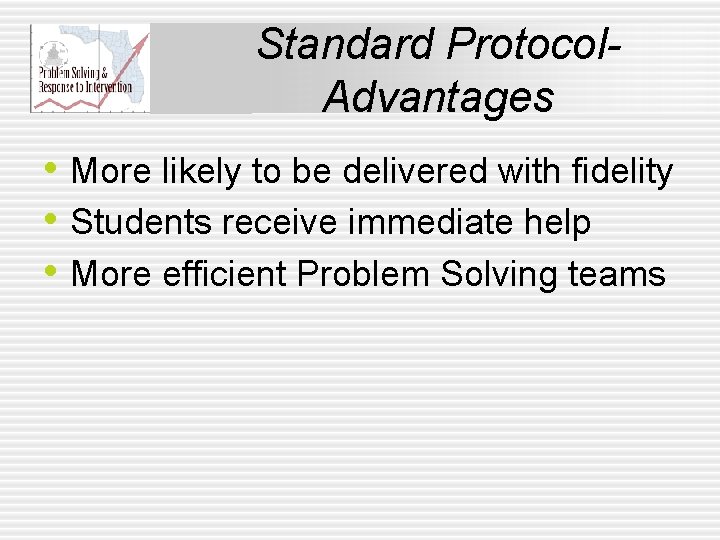
Standard Protocol. Advantages • More likely to be delivered with fidelity • Students receive immediate help • More efficient Problem Solving teams
Standard Protocol. Disadvantages • No single strategy can address all deficits • Not applicable for some problems • Increased dependency on correct Problem • • Identification, Problem Analysis, Intervention Design May require changes to schedule for small groups Less team Problem-Solving
Intervention Banks • School teams identify research-based • • • interventions designed for commonly occurring problems Identify school-based resources look at “best fit” for school/teachers/students Everyone uses same intervention(s) Saves time
Example: • 1 st grade teacher analyzes Phonological • • Awareness Literacy Screening (PALS) data 20% of class below grade-level standard Particular difficulty with Phonemic Awareness Confers with other 1 st grade teachers Decide to supplement literacy curriculum for students (12) not meeting standard
Example (cont. ): • 12 students-Standard Protocol intervention • • • --Road to the Code 4 x/week, 20 min. , classroom teacher Targeted skills: initial and final phoneme segmentation and blending of 2 -3 phonemes Progress monitored with weekly probes
Example (cont. ) After 5 weeks: • 2 students met target, exited from intervention • 6 students on track to meet goal at end of ten weeks • 4 students demonstrated limited progress, their interventions were intensified
Example (cont. ): After 10 weeks: • 8 students met target • 2 students did not demonstrate progress, were brought to Problem Solving team
Data-based Decisions Data source(s) should: • provide sufficient information to select appropriate Standard Protocol. • allow you to group students with similar needs • depend on the Standard Protocols you have in place.
Discussion… In the absence of in-depth Problem Analysis, what data might allow you to make decisions about grouping students for Standard Protocol interventions?
Intervention Infrastructure
Using Existing Data to Predict Intervention Needs • Previous referral history predicts future referral history • How do we interpret teacher referrals? • Previous intervention history predicts future intervention history • How do we use this information to establish an infrastructure for change?
Data-Driven Infrastructure: Establishing a Building Baseline • Code referrals (reasons) for past 2 -3 years § Identifies problems teachers feel they do not have the skills/support to handle § Referral pattern reflects skill pattern of the staff, the resources currently in place and the “history” of what constitutes a referral in that building § Identifies likely referral types for next 2 years § Identifies focus of Professional Development Activities AND potential Tier II and III interventions § Present data to staff. Reinforces “Need” concept
Data-Driven Infrastructure: Establishing a Building Baseline • Assess current “Supplemental Interventions” § Identify all students receiving supplemental interventions § For those interventions, identify • Type and Focus (academic, direct instruction, etc) • Duration (minutes/week) • Provider § Aggregate • Identifies instructional support types in building • This constitutes Tier II and III intervention needs
Data-Driven Infrastructure: Establishing a Building Baseline • Identify current progress monitoring assessment practices § Determine if they meet needs/criteria § Strengthen with additional methods, if necessary • Identify how data are used, organized and interpreted currently § Determine how to use technology to support
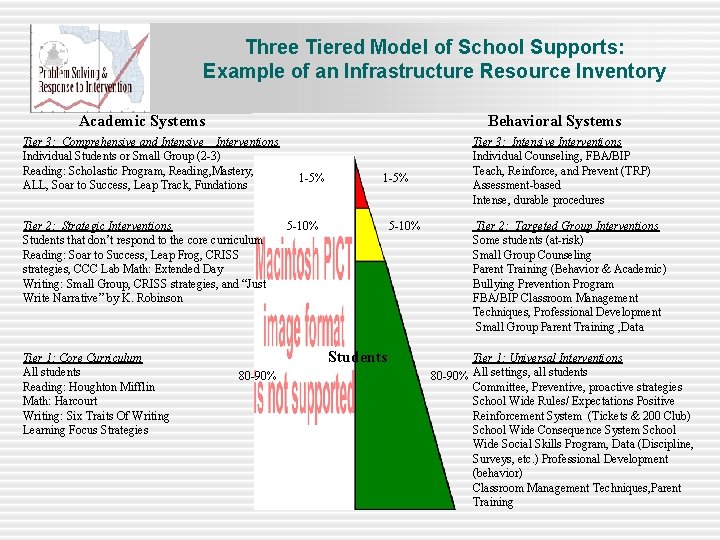
Three Tiered Model of School Supports: Example of an Infrastructure Resource Inventory Behavioral Systems Academic Systems Tier 3: Comprehensive and Intensive Interventions Individual Students or Small Group (2 -3) Reading: Scholastic Program, Reading, Mastery, ALL, Soar to Success, Leap Track, Fundations Tier 2: Strategic Interventions Students that don’t respond to the core curriculum Reading: Soar to Success, Leap Frog, CRISS strategies, CCC Lab Math: Extended Day Writing: Small Group, CRISS strategies, and “Just Write Narrative” by K. Robinson Tier 1: Core Curriculum All students Reading: Houghton Mifflin Math: Harcourt Writing: Six Traits Of Writing Learning Focus Strategies 1 -5% 5 -10% Students 80 -90% Tier 3: Intensive Interventions Individual Counseling, FBA/BIP Teach, Reinforce, and Prevent (TRP) Assessment-based Intense, durable procedures Tier 2: Targeted Group Interventions Some students (at-risk) Small Group Counseling Parent Training (Behavior & Academic) Bullying Prevention Program FBA/BIP Classroom Management Techniques, Professional Development Small Group Parent Training , Data Tier 1: Universal Interventions 80 -90% All settings, all students Committee, Preventive, proactive strategies School Wide Rules/ Expectations Positive Reinforcement System (Tickets & 200 Club) School Wide Consequence System School Wide Social Skills Program, Data (Discipline, Surveys, etc. ) Professional Development (behavior) Classroom Management Techniques, Parent Training
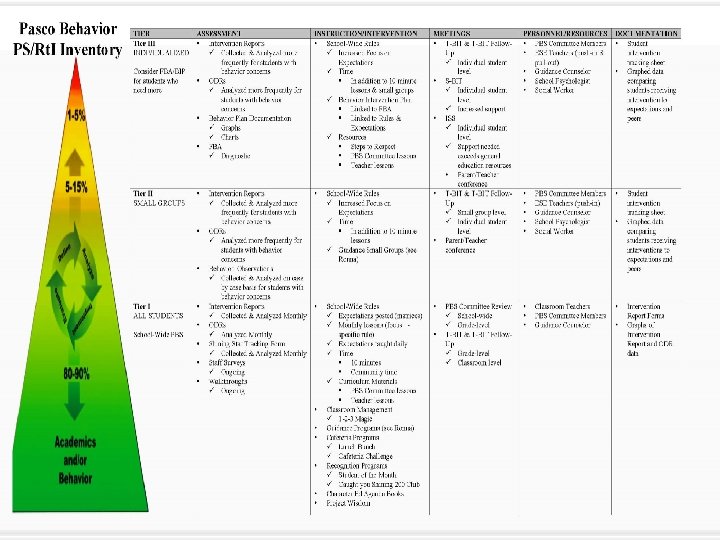
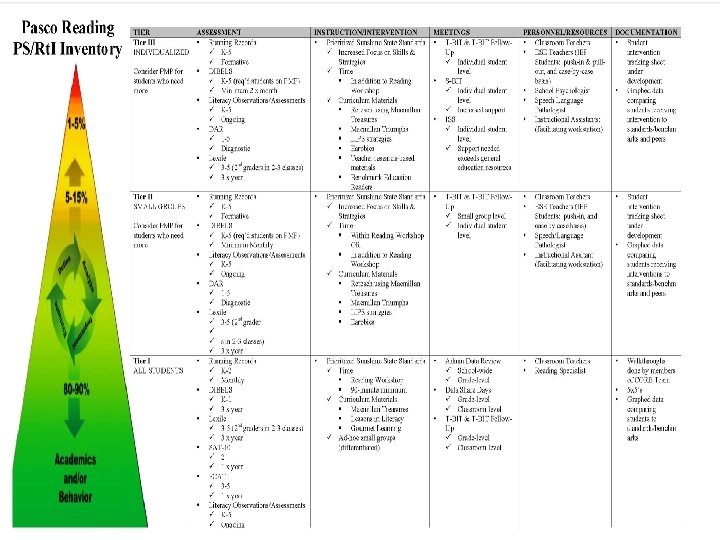
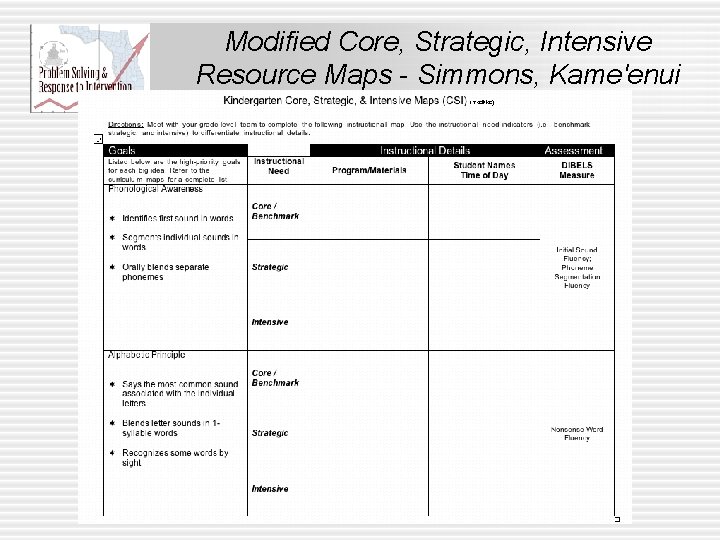
Modified Core, Strategic, Intensive Resource Maps - Simmons, Kame'enui
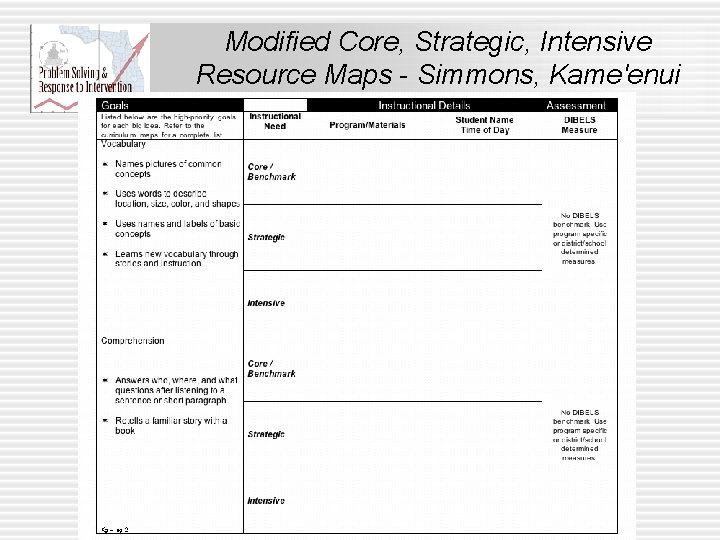
Modified Core, Strategic, Intensive Resource Maps - Simmons, Kame'enui
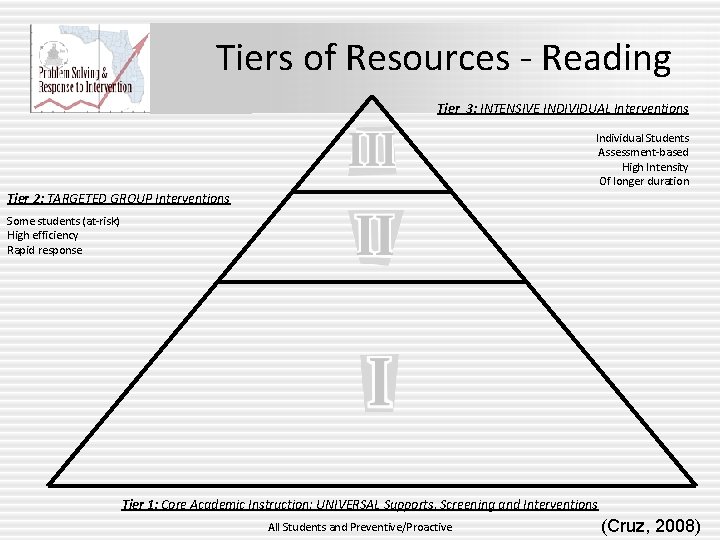
Tiers of Resources - Reading Tier 3: INTENSIVE INDIVIDUAL Interventions Individual Students Assessment-based High Intensity Of longer duration Tier 2: TARGETED GROUP Interventions Some students (at-risk) High efficiency Rapid response Tier 1: Core Academic Instruction; UNIVERSAL Supports, Screening and Interventions All Students and Preventive/Proactive (Cruz, 2008)
Group Discussion: • What resources exist in your school/district • • that could be used in delivering Standard Protocol interventions? Where can you look for additional resources? How do you determine “best fit” between Standard Protocol interventions and your students/teachers/school?
Rt. I and the K-12 Reading Plan
Don’t reinvent the wheel “The guidelines provided for districts, schools, principals, and teachers within the K-12 Comprehensive Research-Based Reading Plan are aligned with the most important goals of the Problem/Solving Response to Intervention (Rt. I) approach. ” (2008 -09 K-12 Reading Plan Guidance)
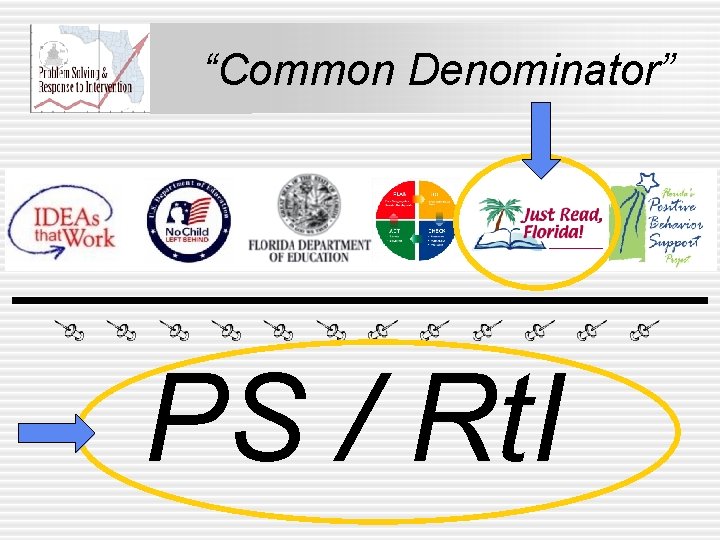
“Common Denominator” PS / Rt. I
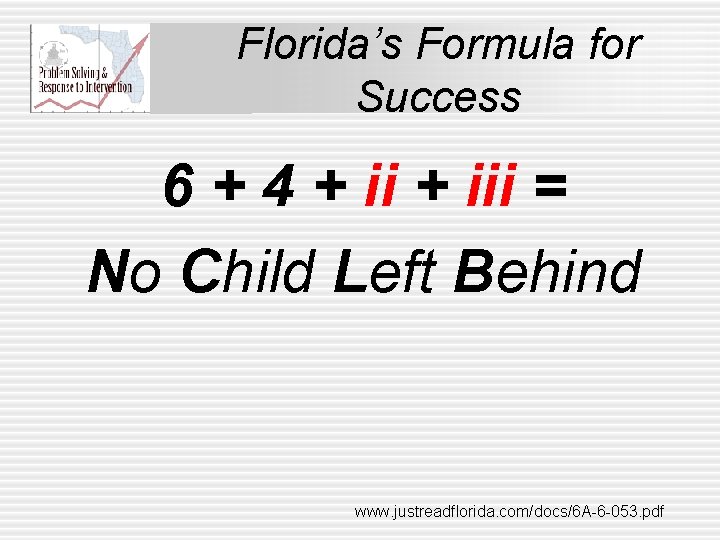
Florida’s Formula for Success 6 + 4 + iii = No Child Left Behind www. justreadflorida. com/docs/6 A-6 -053. pdf
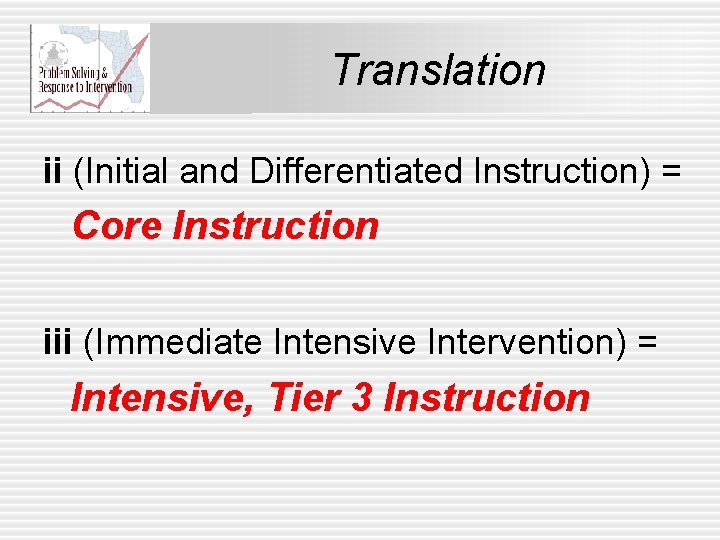
Translation ii (Initial and Differentiated Instruction) = Core Instruction iii (Immediate Intensive Intervention) = Intensive, Tier 3 Instruction
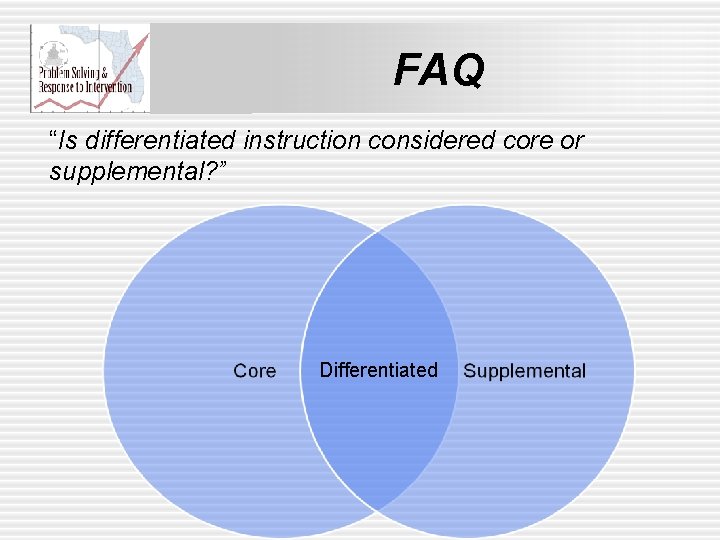
FAQ “Is differentiated instruction considered core or supplemental? ” Differentiated
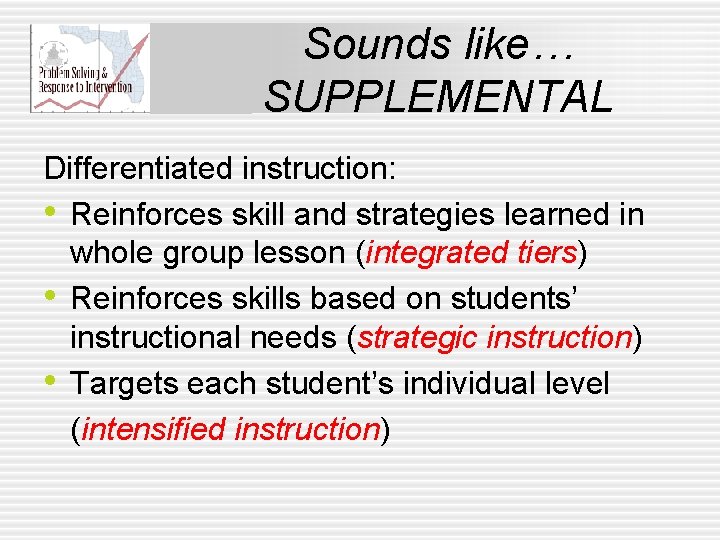
Sounds like… SUPPLEMENTAL Differentiated instruction: • Reinforces skill and strategies learned in whole group lesson (integrated tiers) • Reinforces skills based on students’ instructional needs (strategic instruction) • Targets each student’s individual level (intensified instruction)
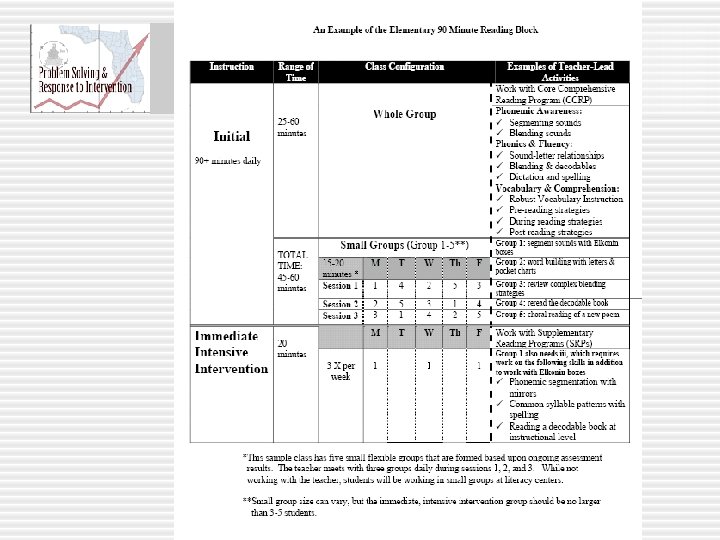
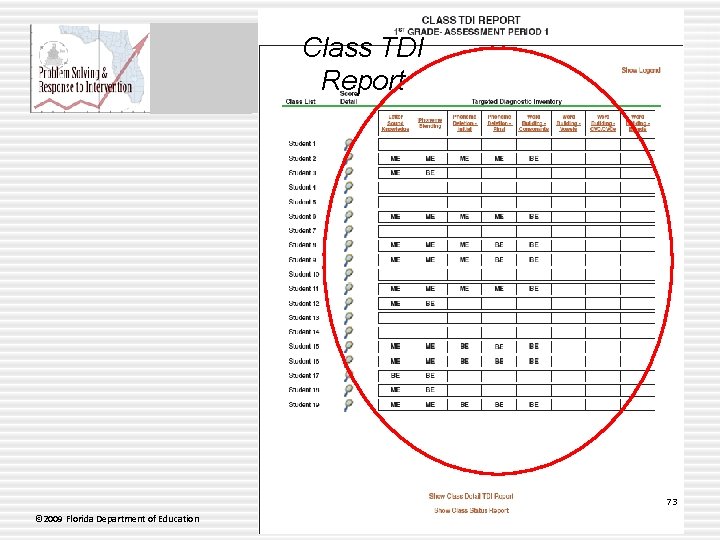
Class TDI Report 73 © 2009 Florida Department of Education 73
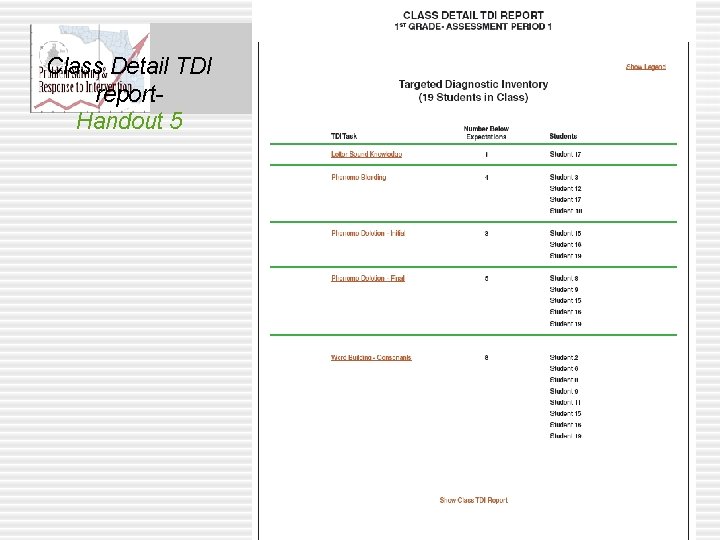
Class Detail TDI report. Handout 5
Decision Making at Tier 2
Making Decisions at Tier 2 An Overview • What are you going to use to monitor • • progress? How often will you monitor progress? How will you measure integrity of interventions provided? How will data be analyzed/displayed? What decision options are available?
Collecting Data at Tier 2 • Basic types of PM: § General Outcome Measures (GOMs); e. g. , DIBELS/Curriculum-Based Measurement § Mastery Measurement (e. g. , Precision Teaching) § Curriculum-based Assessment (e. g. , finding instructional levels) § Resources: http: //www. studentprogress. org/chart. asp http: //www. rtinetwork. org/Essential/Assessment • Two functions to progress monitoring § Assess student performance § Evaluate effectiveness of interventions
Frequency of Progress Monitoring • Varies: § Weekly § Bi-weekly § Monthly • Matched to student needs • General rule: More intense the problem(i. e. , size of • gap), the more frequent we should assess student performance and intervention effectiveness More frequent assessment allows for quickest decision making § i. e. , how soon can reliable trendline be established? • If using Uniform Standard Protocol then more frequent is preferred (e. g. , 2 x month).
Variables Influencing Frequency of PM • Infrastructure Variables: § § Who is available to collect this data? What materials are available to support PM? How does schedule affect PM activities? What assessments are being used? (Who is trained to use them? ) § Where will students be assessed? • Intervention Variables § Uniform Standard approach ? § Diagnostic Standard approach? • Student Variables: § How large is the gap between students and performance goals? § How often are students accessing Tier 2 supports?
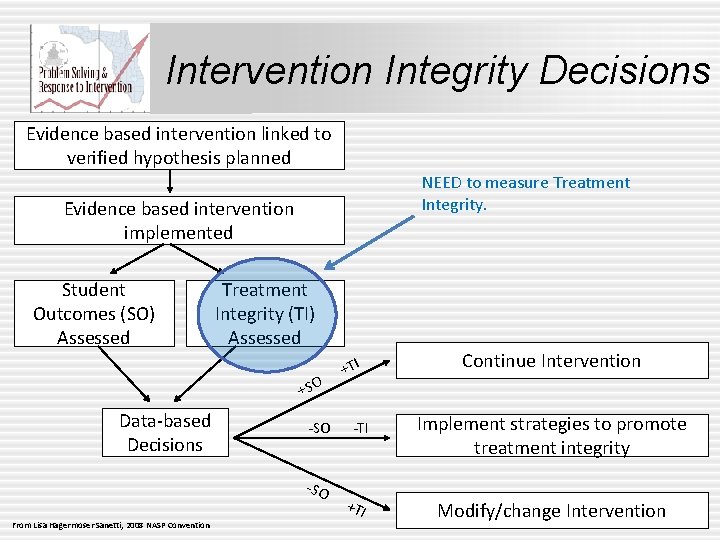
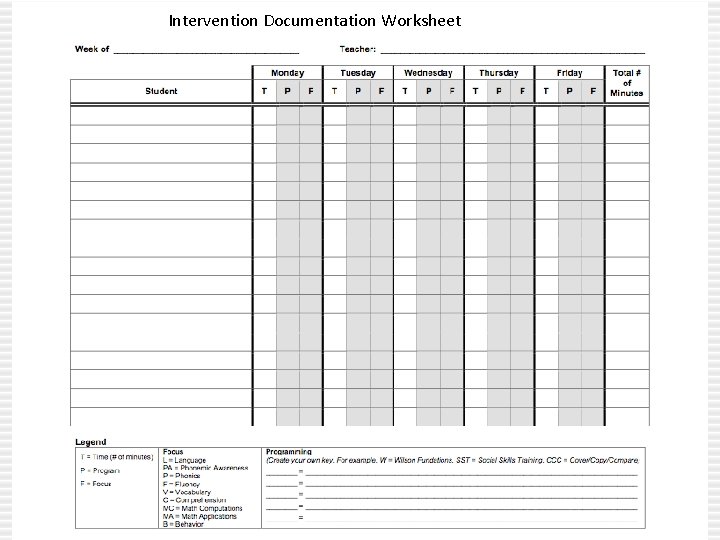
Measuring Integrity of Standard Protocol • Why is this important and how will integrity be measured? § Allow for decisions to be made about effectiveness of intervention. § Was plan followed as designed by team? § Was Standard Protocol implemented as designed?
Intervention Integrity Decisions Evidence based intervention linked to verified hypothesis planned NEED to measure Treatment Integrity. Evidence based intervention implemented Student Outcomes (SO) Assessed Treatment Integrity (TI) Assessed +SO Data-based Decisions -SO From Lisa Hagermoser Sanetti, 2008 NASP Convention +TI -TI +TI Continue Intervention Implement strategies to promote treatment integrity Modify/change Intervention
Measuring Integrity of Standard Protocol • How will integrity be measured? • Documentation? § Ex. Intervention Documentation Worksheet
Intervention Documentation Worksheet
Measuring Integrity of Standard Protocol • How will integrity be measured? • Documentation? § Ex. Intervention Documentation Worksheet § Develop based on the unique needs of building and student needs. • Remember – Documentation must also include: § § Who is responsible? What will be done? When will it occur? How will data be shared?
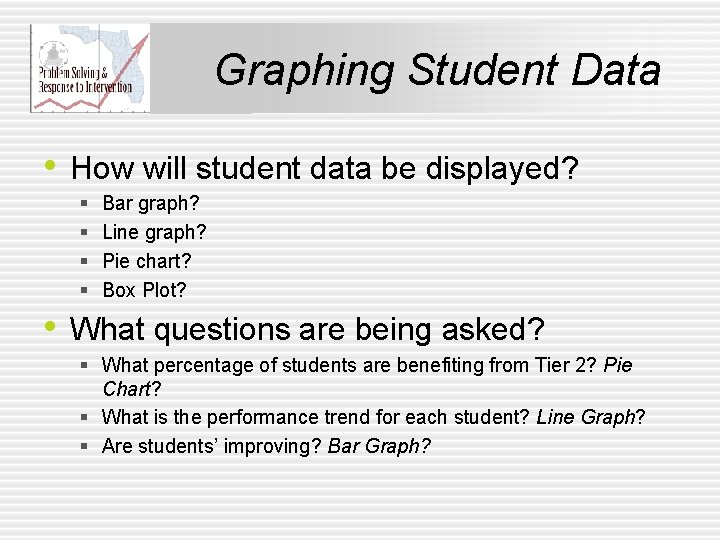
Graphing Student Data • How will student data be displayed? § § Bar graph? Line graph? Pie chart? Box Plot? • What questions are being asked? § What percentage of students are benefiting from Tier 2? Pie Chart? § What is the performance trend for each student? Line Graph? § Are students’ improving? Bar Graph?
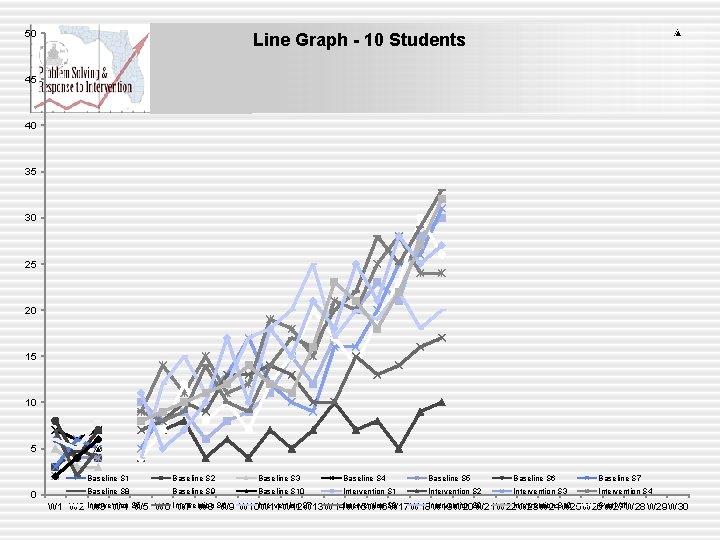
50 Line Graph - 10 Students 45 40 35 30 25 20 15 10 5 0 Baseline S 1 Baseline S 2 Baseline S 3 Baseline S 4 Baseline S 5 Baseline S 6 Baseline S 7 Baseline S 8 Baseline S 9 Baseline S 10 Intervention S 1 Intervention S 2 Intervention S 3 Intervention S 4 Intervention S 7 Intervention S 8 Intervention S 9 Intervention S 10 Goal All W 1 W 2 Intervention W 3 W 4 S 5 W 6 Intervention W 7 W 8 S 6 W 9 W 10 W 11 W 12 W 13 W 14 W 15 W 16 W 17 W 18 W 19 W 20 W 21 W 22 W 23 W 24 W 25 W 26 W 27 W 28 W 29 W 30
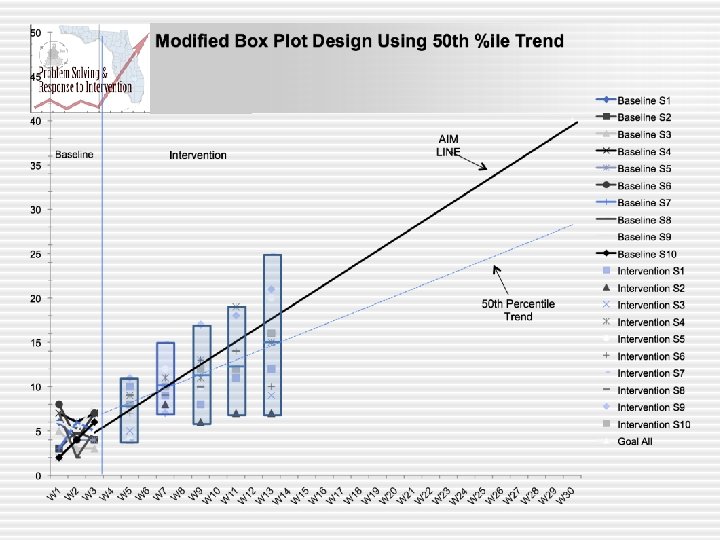
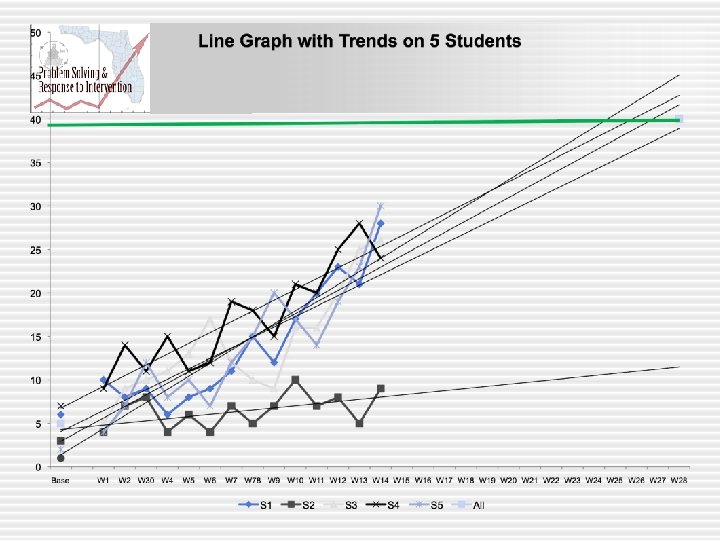
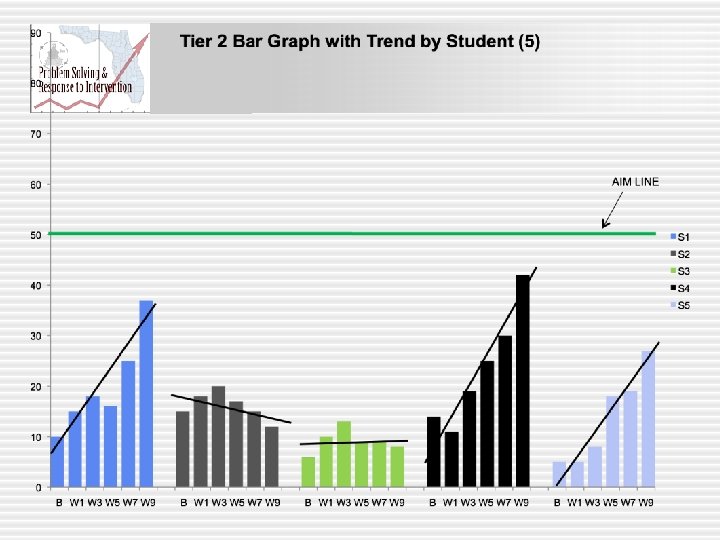
Is Tier 2 Effective? • At least 70% - 80% of students should • benefit from Tier 2 if effective. Decision Making Options: § Similar to options shared with Tier 1. § Integrity + Rate of Response • poor, questionable, good? § Unit of analysis is the group of students • % who are benefiting from Tier 2 supports.
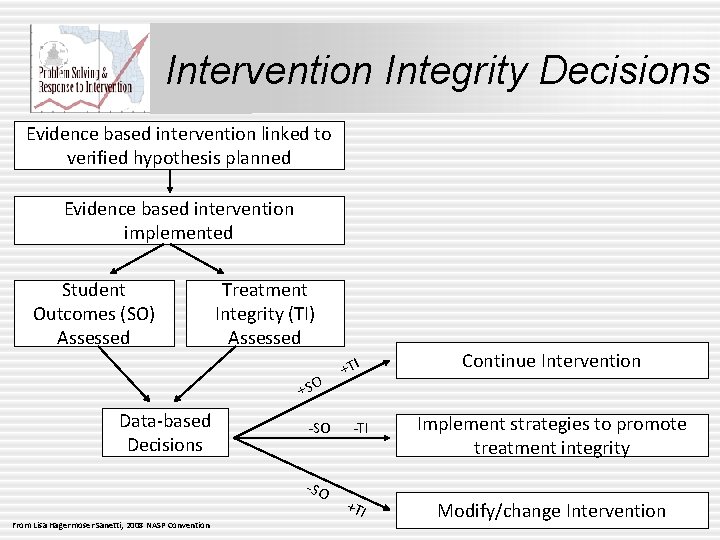
Intervention Integrity Decisions Evidence based intervention linked to verified hypothesis planned Evidence based intervention implemented Student Outcomes (SO) Assessed Treatment Integrity (TI) Assessed +SO Data-based Decisions -SO From Lisa Hagermoser Sanetti, 2008 NASP Convention +TI -TI +TI Continue Intervention Implement strategies to promote treatment integrity Modify/change Intervention
If 70% to 80% are Improving • Continue Tier 2 Intervention • Engage in PS steps with in depth Problem • • • Analysis for student(s) not improving. Check for intervention fidelity/integrity as it relates to student(s) not improving. Check for match of intervention to student needs for those not improving. Consider supplement/increased intensity for students not benefiting.
If about half are improving… • Check treatment integrity § Is standard protocol implemented as designed? § Is data on student performance reliable? § Was intervention given enough time? • Check match of intervention to student needs • Check dosage of intervention • Consider in-depth PS for students not • improving. Consider elements of intervention to be modified.
If none are improving… • Check treatment fidelity/integrity. § If integrity data is +, then Tier 2 not effective for student needs. § If integrity data is -, then re-implement with integrity. § Was intervention given enough time? § Check for reliability of student performance data. • Check match to student needs. • Consider replacement or modifications to Tier 2 • plan. Do not yet consider individual Tier 3 plans.
Prioritizing Decisions • Benchmark Assessments vs. Progress Monitoring Data § “It is about assessing what we do, not who we do it to” – Ken Howell § First, are we closing the gap on skill(s) assessed through Progress Monitoring Assessments? § Is increased performance on subskills leading to increases in performance on Benchmark Assessment • Ex. Benchmark Reading (comprehension); PM phonics.
Student Data Review Skills Assessment • No ID required • Review data for each set of questions and answer questions Part I - Determining Common Student Needs Part II - Placing Students in Interventions • Work as a team – only 1 form needs to be completed.
Homework for SBLT • Using the skills exercised today • Identify a group of students in need of Tier 2 intervention on your campus and identify a matching standard treatment protocol. • Bring this with you to the next session
Final Thoughts Problem Solving & Response to
- Slides: 98