
School Accountability 2015 16 Agenda Objectives High School

School Accountability 2015 -16
Agenda • Objectives • High School Performance Scores • Planning, Support, and Resources • Contacts Louisiana Believes 2
Objectives Session Overview and Objectives The school performance score (SPS) represents student performance including important indicators of assessment and readiness, graduation, diploma strength, and progress. This presentation will: • Review parts of student performance that make up the SPS and policies associated with the SPS calculations for 2015 -2016 (2016 SPS) • Highlight policy updates related to the calculation of school performance scores • Highlight resources that will facilitate planning and understanding of school accountability Louisiana Believes 3
Agenda • Objectives • High School Performance Scores • Planning, Support, and Resources • Contacts Louisiana Believes 4
Calculators • http: //www. louisianabelieves. com/resources/libra ry/data-center Louisiana Believes 5

High School SPS: Accountability System Overview For schools with grades 9 -12, the accountability system includes student assessment performance on both EOC and ACT, progress points, cohort graduation rate, and strength of diploma (graduation index). Grades 9 -12 Assessment 25% ACT 25% Cohort Graduation Rate 25% Strength of Diploma (Graduation Index) 25% + Progress Points
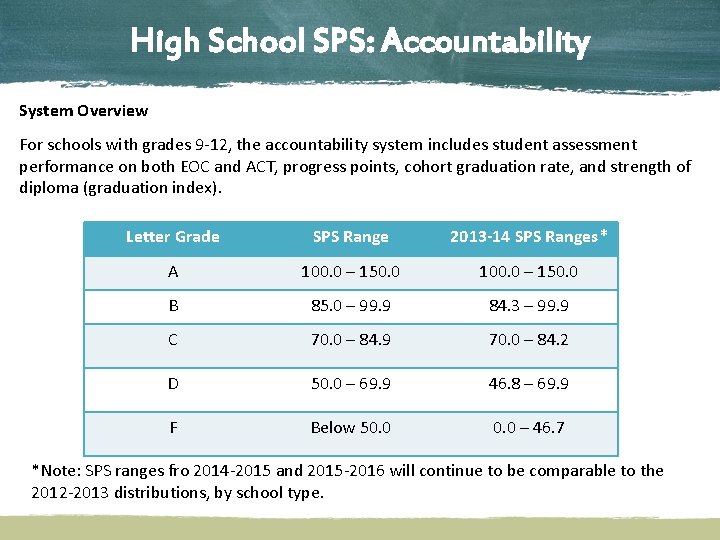
High School SPS: Accountability System Overview For schools with grades 9 -12, the accountability system includes student assessment performance on both EOC and ACT, progress points, cohort graduation rate, and strength of diploma (graduation index). Letter Grade SPS Range 2013 -14 SPS Ranges* A 100. 0 – 150. 0 B 85. 0 – 99. 9 84. 3 – 99. 9 C 70. 0 – 84. 9 70. 0 – 84. 2 D 50. 0 – 69. 9 46. 8 – 69. 9 F Below 50. 0 – 46. 7 *Note: SPS ranges fro 2014 -2015 and 2015 -2016 will continue to be comparable to the 2012 -2013 distributions, by school type.
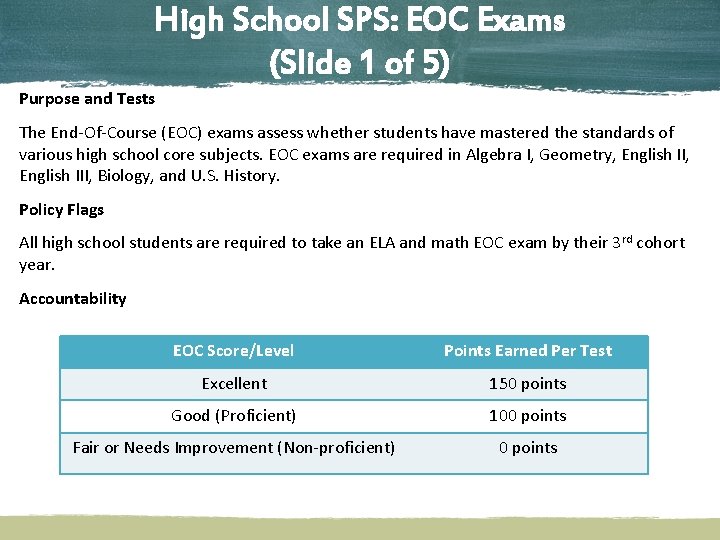
High School SPS: EOC Exams (Slide 1 of 5) Purpose and Tests The End-Of-Course (EOC) exams assess whether students have mastered the standards of various high school core subjects. EOC exams are required in Algebra I, Geometry, English III, Biology, and U. S. History. Policy Flags All high school students are required to take an ELA and math EOC exam by their 3 rd cohort year. Accountability EOC Score/Level Points Earned Per Test Excellent 150 points Good (Proficient) 100 points Fair or Needs Improvement (Non-proficient) 0 points
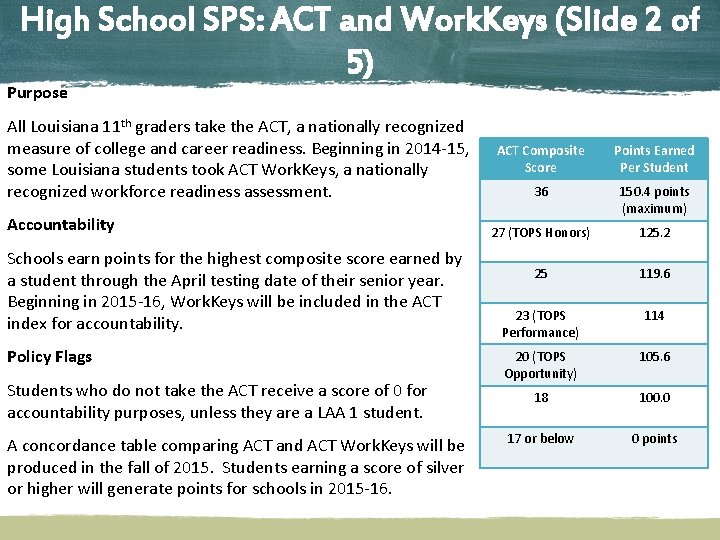
High School SPS: ACT and Work. Keys (Slide 2 of 5) Purpose All Louisiana 11 th graders take the ACT, a nationally recognized measure of college and career readiness. Beginning in 2014 -15, some Louisiana students took ACT Work. Keys, a nationally recognized workforce readiness assessment. Accountability Schools earn points for the highest composite score earned by a student through the April testing date of their senior year. Beginning in 2015 -16, Work. Keys will be included in the ACT index for accountability. Policy Flags Students who do not take the ACT receive a score of 0 for accountability purposes, unless they are a LAA 1 student. A concordance table comparing ACT and ACT Work. Keys will be produced in the fall of 2015. Students earning a score of silver or higher will generate points for schools in 2015 -16. ACT Composite Score Points Earned Per Student 36 150. 4 points (maximum) 27 (TOPS Honors) 125. 2 25 119. 6 23 (TOPS Performance) 114 20 (TOPS Opportunity) 105. 6 18 100. 0 17 or below 0 points
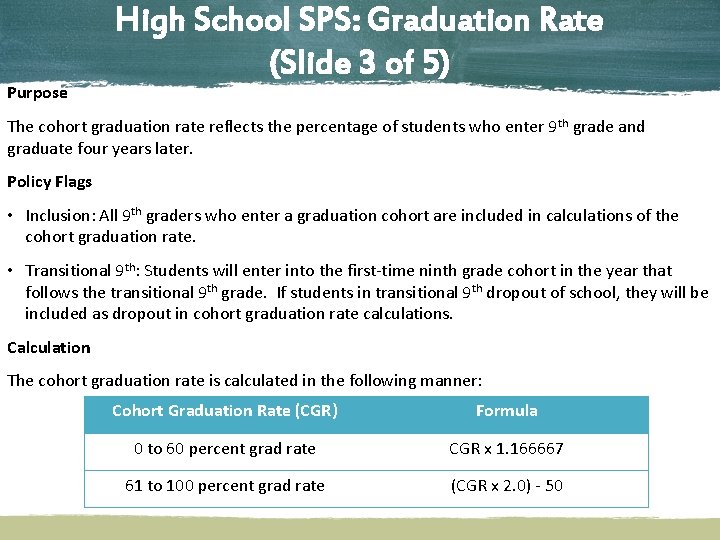
Purpose High School SPS: Graduation Rate (Slide 3 of 5) The cohort graduation rate reflects the percentage of students who enter 9 th grade and graduate four years later. Policy Flags • Inclusion: All 9 th graders who enter a graduation cohort are included in calculations of the cohort graduation rate. • Transitional 9 th: Students will enter into the first-time ninth grade cohort in the year that follows the transitional 9 th grade. If students in transitional 9 th dropout of school, they will be included as dropout in cohort graduation rate calculations. Calculation The cohort graduation rate is calculated in the following manner: Cohort Graduation Rate (CGR) Formula 0 to 60 percent grad rate CGR x 1. 166667 61 to 100 percent grad rate (CGR x 2. 0) - 50
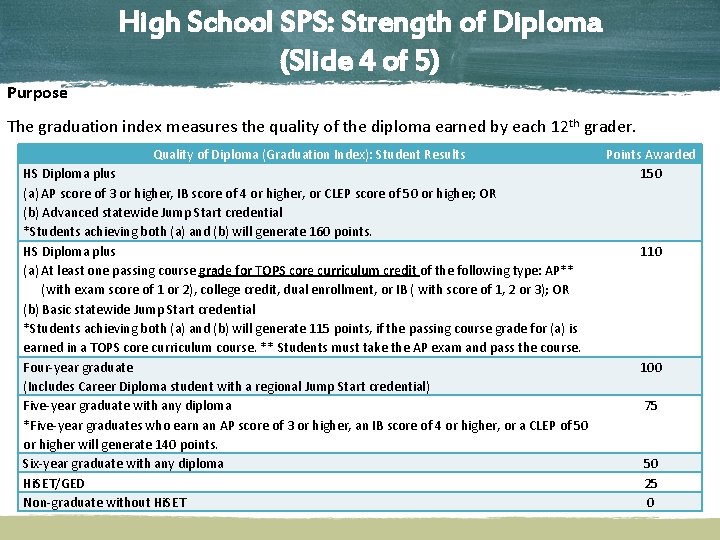
High School SPS: Strength of Diploma (Slide 4 of 5) Purpose The graduation index measures the quality of the diploma earned by each 12 th grader. Quality of Diploma (Graduation Index): Student Results HS Diploma plus (a) AP score of 3 or higher, IB score of 4 or higher, or CLEP score of 50 or higher; OR (b) Advanced statewide Jump Start credential *Students achieving both (a) and (b) will generate 160 points. HS Diploma plus (a) At least one passing course grade for TOPS core curriculum credit of the following type: AP** (with exam score of 1 or 2), college credit, dual enrollment, or IB ( with score of 1, 2 or 3); OR (b) Basic statewide Jump Start credential *Students achieving both (a) and (b) will generate 115 points, if the passing course grade for (a) is earned in a TOPS core curriculum course. ** Students must take the AP exam and pass the course. Four-year graduate (Includes Career Diploma student with a regional Jump Start credential) Five-year graduate with any diploma *Five-year graduates who earn an AP score of 3 or higher, an IB score of 4 or higher, or a CLEP of 50 or higher will generate 140 points. Six-year graduate with any diploma Hi. SET/GED Non-graduate without Hi. SET Points Awarded 150 110 100 75 50 25 0
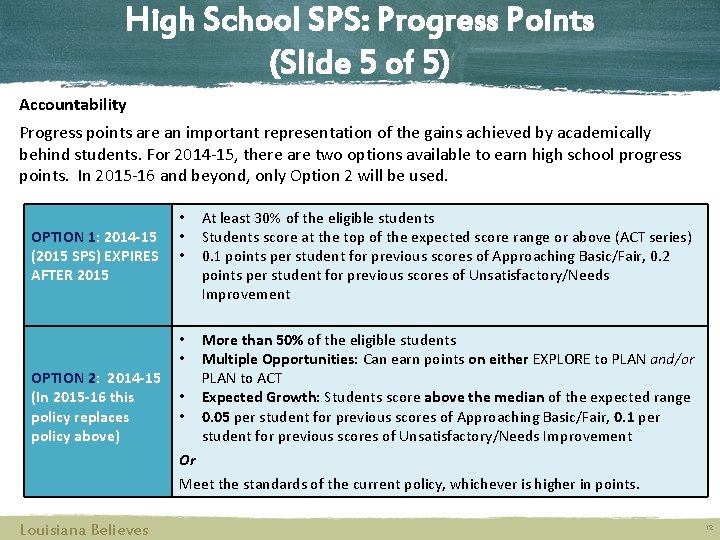
High School SPS: Progress Points (Slide 5 of 5) Accountability Progress points are an important representation of the gains achieved by academically behind students. For 2014 -15, there are two options available to earn high school progress points. In 2015 -16 and beyond, only Option 2 will be used. OPTION 1: 2014 -15 (2015 SPS) EXPIRES AFTER 2015 OPTION 2: 2014 -15 (In 2015 -16 this policy replaces policy above) • • • At least 30% of the eligible students Students score at the top of the expected score range or above (ACT series) 0. 1 points per student for previous scores of Approaching Basic/Fair, 0. 2 points per student for previous scores of Unsatisfactory/Needs Improvement • • More than 50% of the eligible students Multiple Opportunities: Can earn points on either EXPLORE to PLAN and/or PLAN to ACT Expected Growth: Students score above the median of the expected range 0. 05 per student for previous scores of Approaching Basic/Fair, 0. 1 per student for previous scores of Unsatisfactory/Needs Improvement • • Or Meet the standards of the current policy, whichever is higher in points. Louisiana Believes 12
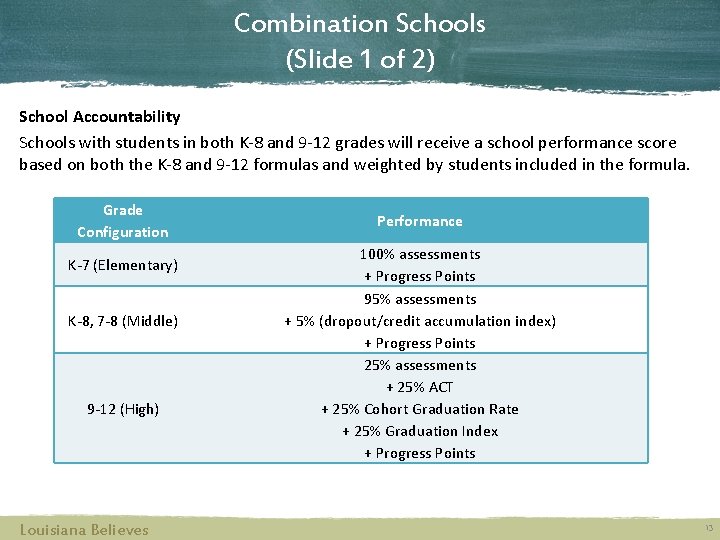
Combination Schools (Slide 1 of 2) School Accountability Schools with students in both K-8 and 9 -12 grades will receive a school performance score based on both the K-8 and 9 -12 formulas and weighted by students included in the formula. Grade Configuration K-7 (Elementary) K-8, 7 -8 (Middle) 9 -12 (High) Louisiana Believes Performance 100% assessments + Progress Points 95% assessments + 5% (dropout/credit accumulation index) + Progress Points 25% assessments + 25% ACT + 25% Cohort Graduation Rate + 25% Graduation Index + Progress Points 13
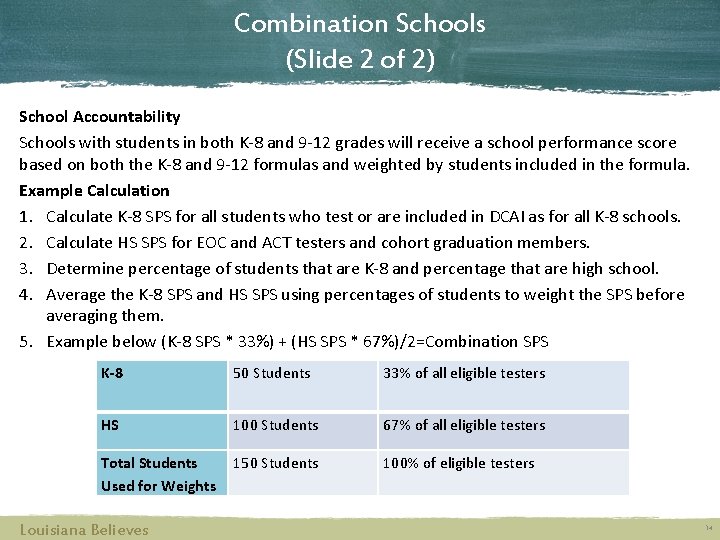
Combination Schools (Slide 2 of 2) School Accountability Schools with students in both K-8 and 9 -12 grades will receive a school performance score based on both the K-8 and 9 -12 formulas and weighted by students included in the formula. Example Calculation 1. Calculate K-8 SPS for all students who test or are included in DCAI as for all K-8 schools. 2. Calculate HS SPS for EOC and ACT testers and cohort graduation members. 3. Determine percentage of students that are K-8 and percentage that are high school. 4. Average the K-8 SPS and HS SPS using percentages of students to weight the SPS before averaging them. 5. Example below (K-8 SPS * 33%) + (HS SPS * 67%)/2=Combination SPS K-8 50 Students 33% of all eligible testers HS 100 Students 67% of all eligible testers Total Students Used for Weights 150 Students 100% of eligible testers Louisiana Believes 14
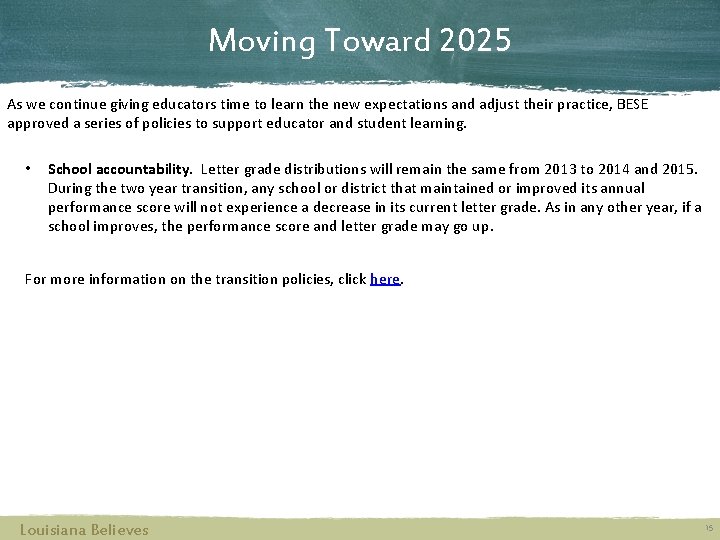
Moving Toward 2025 As we continue giving educators time to learn the new expectations and adjust their practice, BESE approved a series of policies to support educator and student learning. • School accountability. Letter grade distributions will remain the same from 2013 to 2014 and 2015. During the two year transition, any school or district that maintained or improved its annual performance score will not experience a decrease in its current letter grade. As in any other year, if a school improves, the performance score and letter grade may go up. For more information on the transition policies, click here. Louisiana Believes 15
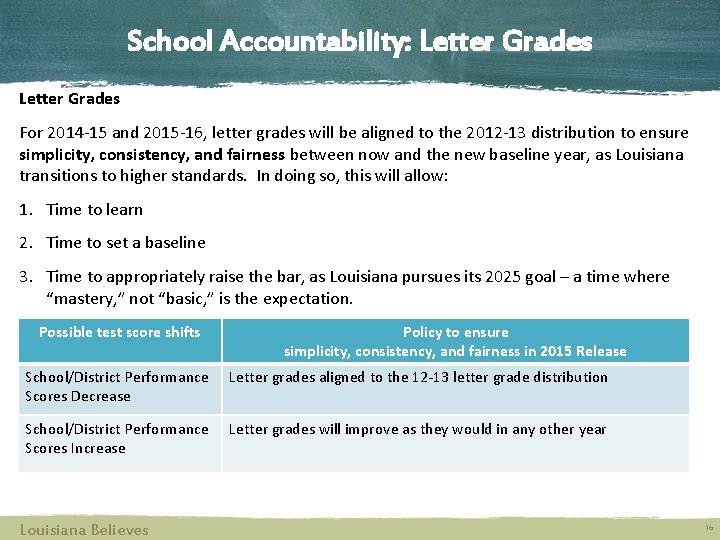
School Accountability: Letter Grades For 2014 -15 and 2015 -16, letter grades will be aligned to the 2012 -13 distribution to ensure simplicity, consistency, and fairness between now and the new baseline year, as Louisiana transitions to higher standards. In doing so, this will allow: 1. Time to learn 2. Time to set a baseline 3. Time to appropriately raise the bar, as Louisiana pursues its 2025 goal – a time where “mastery, ” not “basic, ” is the expectation. Possible test score shifts Policy to ensure simplicity, consistency, and fairness in 2015 Release School/District Performance Letter grades aligned to the 12 -13 letter grade distribution School/District Performance Scores Increase Letter grades will improve as they would in any other year Approved BESE Policy for the 2013 -14 and 2014 -15 school years Scores Decrease Louisiana Believes 16
Agenda • Objectives • High School Performance Scores • Planning, Support, and Resources • Contacts Louisiana Believes 17
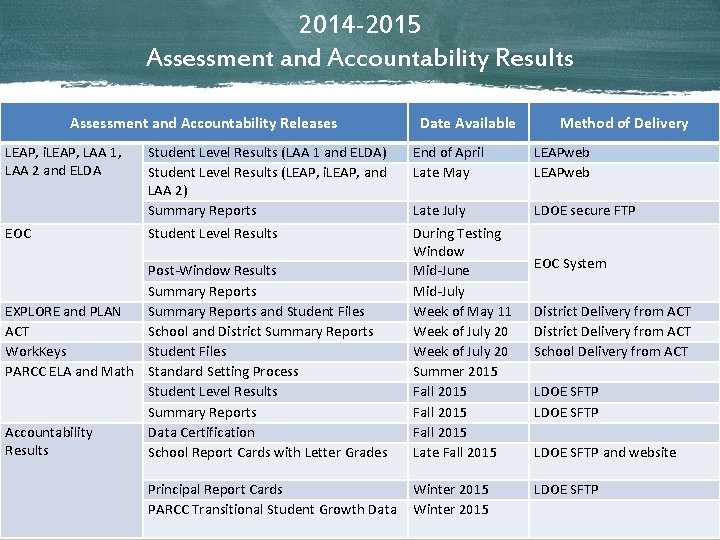
2014 -2015 Assessment and Accountability Results Assessment and Accountability Releases LEAP, i. LEAP, LAA 1, LAA 2 and ELDA EOC Date Available Method of Delivery Student Level Results (LAA 1 and ELDA) Student Level Results (LEAP, i. LEAP, and LAA 2) Summary Reports End of April Late May LEAPweb Late July LDOE secure FTP Student Level Results During Testing Window Mid-June Mid-July Week of May 11 Week of July 20 Summer 2015 Fall 2015 Late Fall 2015 Post-Window Results Summary Reports EXPLORE and PLAN Summary Reports and Student Files ACT School and District Summary Reports Work. Keys Student Files PARCC ELA and Math Standard Setting Process Student Level Results Summary Reports Accountability Data Certification Results School Report Cards with Letter Grades Principal Report Cards PARCC Transitional Student Growth Data Louisiana Believes Winter 2015 EOC System District Delivery from ACT School Delivery from ACT LDOE SFTP and website LDOE SFTP 18
Resources SPS Calculator The calculators are designed for educators to input school level data in order to estimate school performance scores. There are two calculators available in the accountability toolbox: a K-8 and a K-12 calculator. High School Resources • Transitional 9 th Grade Guide: This guide is designed to help district identify, plan, and improve the academic achievement of struggling 8 th grade students. • High School Guide: This guide is designed to help counselors and school staff plan the pathways and goals for all students. • Jump Start Fact Sheet: The one-page document reflects a set of “quick facts” on the implications of Jump Start and the career path on accountability. • Jump. Start Graduation Pathways: Fact sheets outline requirements by pathway • Jump. Start Certification Fact Sheets: Fact sheets outline requirements for certifications
Agenda • Objectives • High School Performance Scores • Planning, Support, and Resources • Contacts Louisiana Believes 20
Accountability Contacts If you have any additional questions, please send them to assessment@la. gov.
- Slides: 21