SCHEMATIC REPORTS Center for Professional Communication Schematic Reports


 ü")


")


- Slides: 29
SCHEMATIC REPORTS Center for Professional Communication
Schematic Reports Present arguments in a visual and creative way The pages have a presentation-like style rather than a pure narrative style � Mix of narrative and visuals � This style emphasizes pictures, tables, charts, and images rather than relying on words alone The pages are produced using presentation software such as Power. Point
Designing & Creating the Schematic Report
Style Focus on graphical elements: � Tables � Charts � Images � Strong graphical design � But, do not ignore text altogether Every page should contain at least 25 -50% text Narrative text font size 11 or 12 pt.
Style Remember: The report is intended to be read, not listened to You will not be present to explain what a graph or table means Thus, the report must be more explicit than slides accompanying an oral presentation
Style Rule of Thumb Each slide should have: ü 25% white space (margins) ü 25 to 50% text ü 25 to 50% graphics
Format & Layout � Create a design template 4 rules for design Organization Elements Navigation Headings Portrait versus landscape?
Create the Design Template Use the 4 Rules of Design Make a few basic decisions and stick to them You may use company colors and logo Use Power. Point to create your report Use one of the templates � Office Button New Presentations Business Pitchbook OR create your own using slide master � Design View Slide Master
Contrast The basic rule: If two items are not exactly the same, then make them really different Adds visual interest Aids in organization of information
Repetition Unify Add visual interest Help readers understand information more efficiently The key is consistency Design templates in reports and presentations are examples of the repetition principle
Alignment Unify l Connect and Interrelate l Organize Nothing should be placed on the page arbitrarily Every element should have some visual connection with another element on the page Avoid Using too many different alignments on a page The center alignment habit
Proximity Organize When several items are in close proximity to one another, they become one visual unit Items relating to each other should be grouped Avoid too many separate elements on a page � Count visual units: 3 -5
Organizational Elements An important aspect of the design template is an area (or areas) designed to help the reader: � Assess current location � Easily find other locations � Organize the sections Page numbers are the simplest example Section numbers, headings, headers and footers are other examples Navigation bar Fly Pages
Navigation tools Help the reader navigate through the report � Where you are � Where you have been � Where you are going Makes the structure clear on every page Navigation bar should include all level one headings
Rules for Headings Headings are NOT part of the text Headings must never be complete sentences Headings must be self-explanatory Headings must be both precise and concise Headings should not be overly fussy or cute Headings often benefit from a different font Headings should have parallel structure
Navigation Bar Heading 1 Heading 2 Heading 3 Schematic Style Professional Reports © Robert Heckman
Navigation Bar Heading 1 Heading 2
Fly Out Pages: Transitions Fly pages create a clear break between main sections of the report Provide a transition between sections Provide overview of the proceeding section Use title slides to create fly pages � Same style as title page
Schematic Style Professional Reports © Robert Heckman
Schematic Style Professional Reports © Robert Heckman
Portrait or Landscape Portrait More familiar reading style Easier to present textual blocks Landscape Better for double duty (stand-up presentations) Can be better for graphical elements (complex graphics are often horizontal)
Schematic Style Professional Reports © Robert Heckman
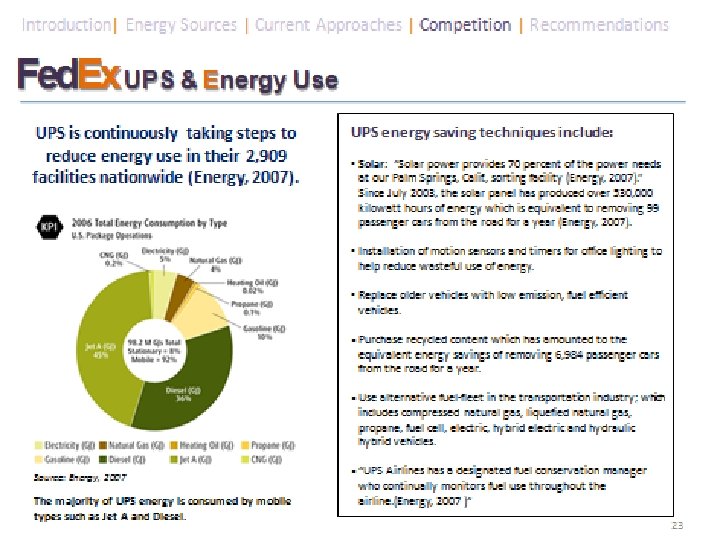
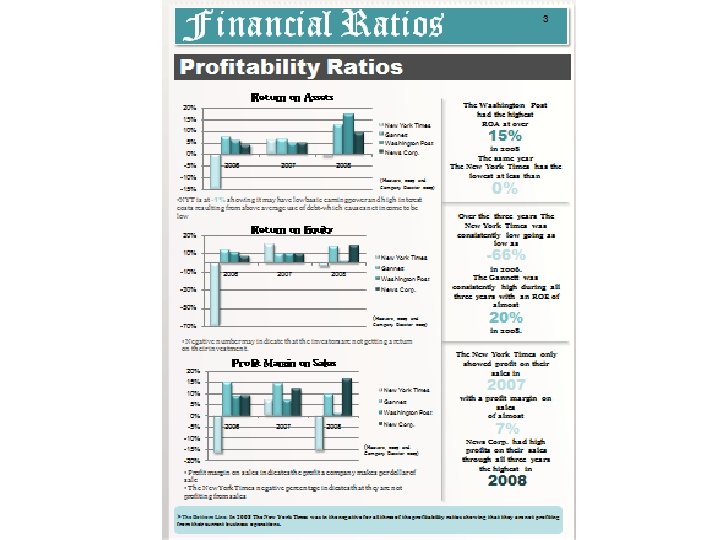
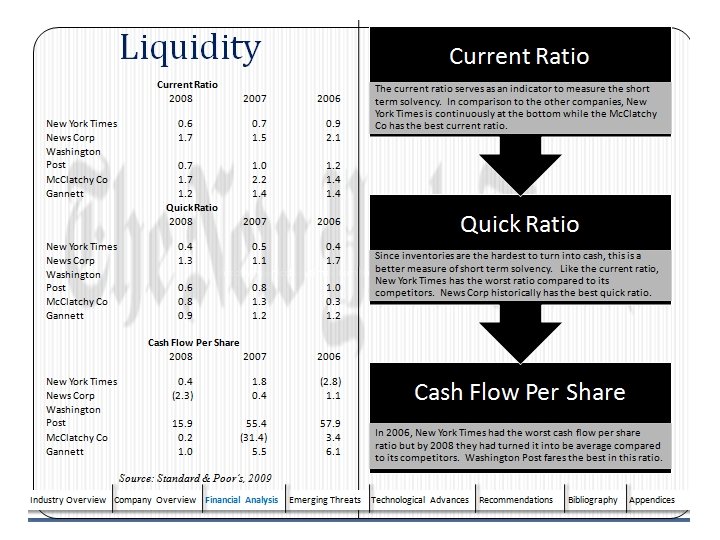
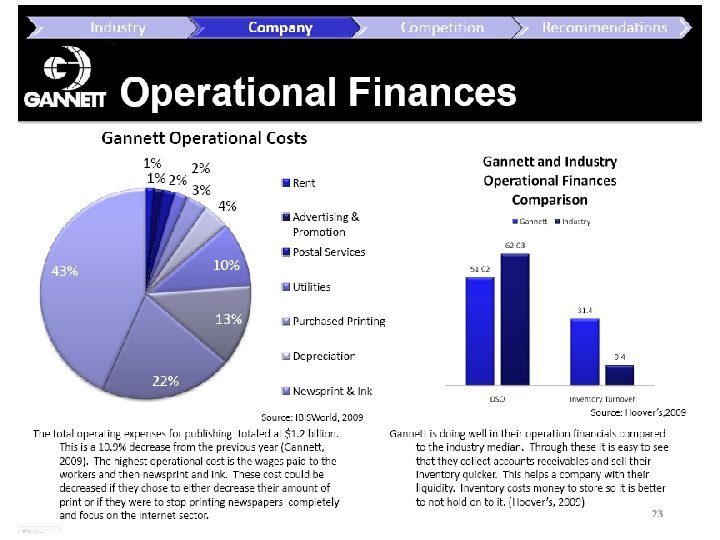
Final Thoughts Think through your design Think through your structure Be consistent Be professional Schematic reports are meant to be read: explain the take away from your graphs Use the template as a guide EDIT, EDIT!