Scenario Arctic Ice The dramatic changes in sea


 1. Go to ISI and search for literature relating to")
 2. Refine ISI search 2. “polar sea ice extent” 238")
 1. New tactic, search PO. DAAC and/or NSIDC web sites")


- Slides: 12
Scenario Arctic Ice The dramatic changes in sea ice have caught the attention of the nation. You are interested in seeing what all the hoopla is about. You want to look at changes in the polar oceans, both sea ice and variables that influence sea ice, such as ocean temperature, wind speeds, atmospheric pressure, and atmospheric temperature. Things you might also be interested in: How rapid are changes (week to week changes, month to month changes)? Are there any changes to primary production from changing sea ice? How is the land snow / sea ice freeze and thaw cycle changing from season to season?
Strategy • Check ISI for publications on this topic • Check PO. DAAC web page • Check NSIDC web page Priorities • Polar sea ice data • Sea surface temperatures • Surface wind stress
Event Log 1. Go to ISI and search for literature relating to sea ice extent. 1. “sea ice extent” 1630 hits, 380 oceanographic Pabi, S. , G. L. van Dijken, and K. R. Arrigo (2008), Primary production in the Arctic Ocean, 1998– 2006, J. Geophys. Res. , 113, C 08005, doi: 10. 1029/2007 JC 004578 This research was supported by a NASA Earth Systems Science fellowship to S. Pabi (ESSF/04 -0000 -0293) and NASA grant NNG 05 GC 92 G to K. Arrigo. We would like to thank Jean-Eric Tremblay and the SBI investigators who made their data available for algorithm validation. We would like to thank Lindsey Kropuenske for comments on an earlier version of this manuscript. Markus, T. , and B. A. Burns (1995), A method to estimate subpixel-scale coastal polynyas with satellite passive microwave data, J. Geophys. Res. , 100, 4473– 4487, doi: 10. 1029/94 JC 02278 The authorsg ratefullya cknowledg. Te homas. Viehoffa nd. A ining Li of the Alfred Wegener. In stitutef or providingthe SAR and. A VHRR data, B ob. W hrithnero f Scripps. In stitutionof Oceanographyfo r the SSM/I and. O LS data, J ohn. K ing of. British Antarctic Survey for the Halley Station data, and NSIDC forthed aily averaged. S SM/I datao n CD-ROM. Use primary productivity to assess ice thickness changes. No route to data given.
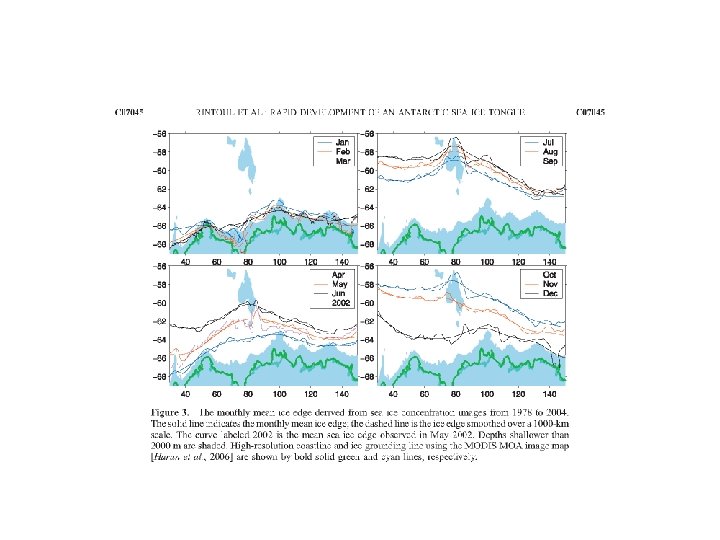
Event Log (cont. ) 1. Go to ISI and search for literature relating to sea ice extent (cont. ) 2. Next likely “hit” Rintoul, S. R. , S. Sokolov, and R. A. Massom (2008), Rapid development and persistence of a massive Antarctic sea ice tongue, J. Geophys. Res. , 113, C 07045, doi: 10. 1029/2007 JC 004541. Information on the detailed structure of the WIST is obtained from enhanced-resolution sigma-0 imagery from the. Sea. Winds 13. 4 GHz (Kuband) radar scatterometer onboard the Quik. SCAT satellite [Early and Long, 2001], distributed by NASA's Scatterometer Climate Record Pathfinder. The nominal pixel dimension is 4. 45 km. Sea ice concentration data from the Nimbus-7 Scanning Multichannel Microwave Radiometer (SMMR) and Defense Meteorological Satellite Program (DMSP) Special Sensor Microwave/Imager (SSM/I) were obtained from the National Snow and Ice Data Center (NSIDC) [Cavalieri et al. , 2006]. We used daily and monthly averaged data at a grid cell size of 25 × 25 km (the daily data cover the period 1997– 2004; monthly data span the period 1978– 2004). Daily sea ice motion vector data, computed from NOAA Advanced Very high-Resolution Radiometer (AVHRR), SMMR and SSM/I data, were obtained from the Polar Pathfinder data set at the NSIDC [Fowler, 2003]. We thank Tony Worby, Ian Allison, and two anonymous reviewers for their comments on the manuscript. This work is a contribution to CSIRO's Climate Change Research Program and was supported in part by the Australian Government's Cooperative Research. Centres Programme through the Antarctic Climate and Ecosystems Cooperative Research Centre. S. R. and S. S. were supported by the CSIRO Wealth From Oceans National Research Flagship. NCEP/NCAR Reanalysis 2 data were acquired from NOAA http: //www. cdc. noaa. gov/cdc/reanalysis. shtml. MOA Antarctic coastline and grounding line data, as well as SMMR and SSM/I ice concentration and ice motion data, were obtained from the NASA Earth Observing System Distributed Active Archive Center at the U. S. National Snow and Ice Data Center, University of Colorado, Boulder (http: //www. nsidc. org). Quik. SCAT data were obtained from NASA's Scatterometer Climate Record Pathfinder data set at Brigham Young University's Center for Remote Sensing. We also wish to thank the Sea. Wi. FS Project (code 970. 2) and the Distributed Active Archive Centre (code 902) at the NASA Goddard Space Flight Centre for the production and distribution of the Sea. Wi. FS data, respectively (http: //daac. gsfc. nasa. gov/dataset/SEAWIFS).
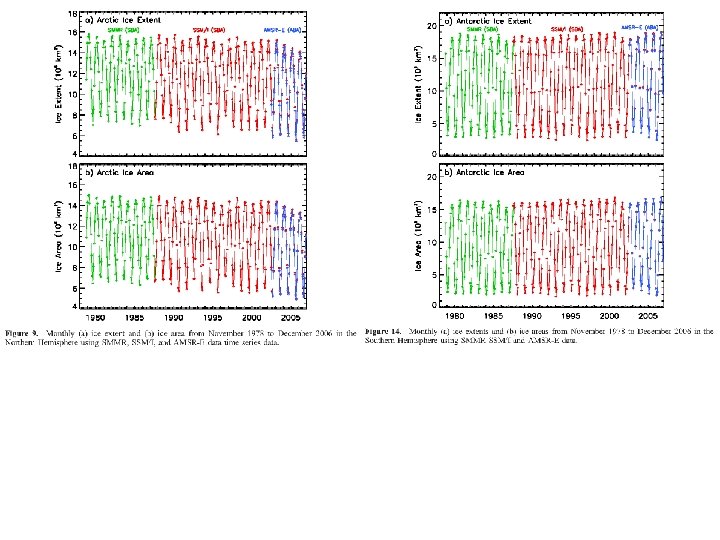
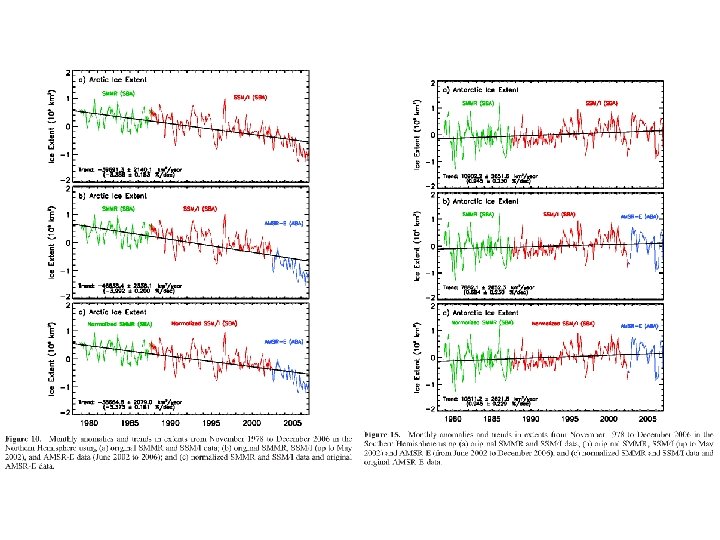
Event Log (cont. ) 2. Refine ISI search 2. “polar sea ice extent” 238 hits 3. “recent sea ice changes” 521 hits, 67 oceanographic Comiso, J. C. , and F. Nishio (2008), Trends in the sea ice cover using enhanced and compatible AMSR-E, SSM/I, and SMMR data, J. Geophys. Res. , 113, C 02 S 07, doi: 10. 1029/2007 JC 004257. The authors wish to express gratitude to the excellent programming support provided by Robert Gersten of RSIS/Adnet, Inc. This research was supported by the Cryospheric Sciences Program of NASA Headquarters. Not a single http reference in the entire document. Lots of pretty pictures made from data gotten who knows where.
Event Log (cont. ) 1. New tactic, search PO. DAAC and/or NSIDC web sites 1. PO. DAAC 1. “recent sea ice changes”, 96 hits, only one four star 2. NSIDC 1. “recent sea ice changes”,
NSIDC Results
Results • • Glover Of the topic three, 2008, papers found, only one gave the source of the data None of the JPL search results led to useful data NSIDC search results more profitable Had to use “recent sea ice changes” to avoid many paleo-results • • • Caruso Google search results lead to nsidc. org and 2 provocative, contradictatory(? ) plots Search for the data behind the plots unsuccessful “Mean SST” search on google, PO. DAAC unfruitful. POET “mean SST” search leads to GHRSST L 4, time series request overloads system (as found before) POET “mean SST” search on Reynolds SST produced plot implying no trend
Contradictory? A turn around? Or continued decrease?