Scatter Plots A graph that shows the relationship


- Slides: 18
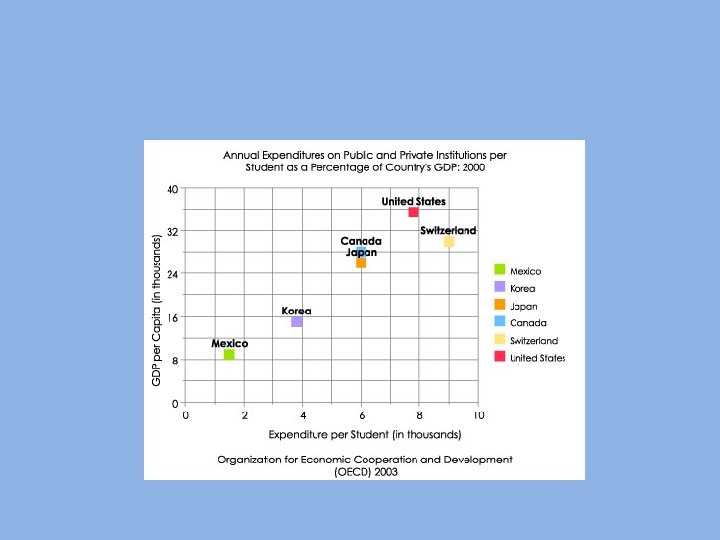
Scatter Plots • A graph that shows the relationship between two sets of data • The data are graphed as ordered pairs on a coordinate plane
Scatter Plots
Scatter Plots • A graph that shows the relationship between two sets of data
Scatter Plots • A graph that shows the relationship between two sets of data • The data are graphed as ordered pairs on a coordinate plane • What are the two sets of data?
Scatter Plots • A graph that shows the relationship between two sets of data • The data are graphed as ordered pairs on a coordinate plane • What are the two sets of data? • What is the independent variable? • What is the dependent variable?
Scatter Plots • A graph that shows the relationship between two sets of data • The data are graphed as ordered pairs on a coordinate plane • What are the two sets of data? • What is the independent variable?
Scatter Plots • A graph that shows the relationship between two sets of data • The data are graphed as ordered pairs on a coordinate plane • What are the two sets of data? • What is the independent variable? • What is the dependent variable? • How would you describe this graph?
Positive Correlation • The graph points upwards to the right.
Positive Correlation • The graph points upwards to the right. • As x increases y increases
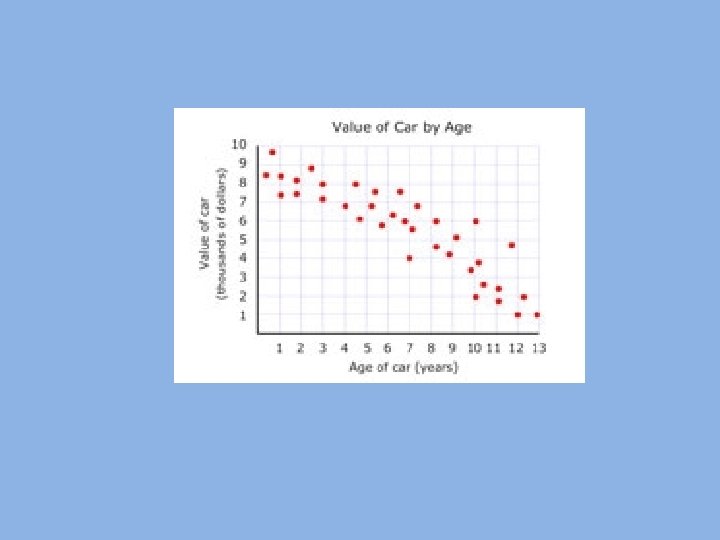
Negative Correlation • The graph points downward to the right
Negative Correlation • The graph points downward to the right • As x increases, y decreases
No Correlation • No obvious pattern
Trend Line • A line graphed to make a scatter plot more readable
Trend Line • A line graphed to make a scatter plot more readable • Is the trend line positive or negative?
Trend Line • A line graphed to make a scatter plot more readable • Is the trend line positive or negative? Positive
Trend Line • A line graphed to make a scatter plot more readable • Is the trend line positive or negative? Positive • Can you approximate the slope?