Scatter Graphs Worksheet B The worksheet is in

Scatter Graphs – Worksheet B The worksheet is in 2 sizes.

Printing To print handouts from slides Select the slide from the left. Then click: File > Print > ‘Print Current Slide’ To print multiple slides Click on a section title to highlight all those slides, or press ‘Ctrl’ at the same time as selecting slides to highlight more than one. Then click: File > Print > ‘Print Selection’ To print double-sided handouts Highlight both slides before using ‘Print Selection’. Choose ‘Print on Both Sides’ and ‘Flip on Short Edge’.
 Describe the correlation for each graph. What does each graph show?")
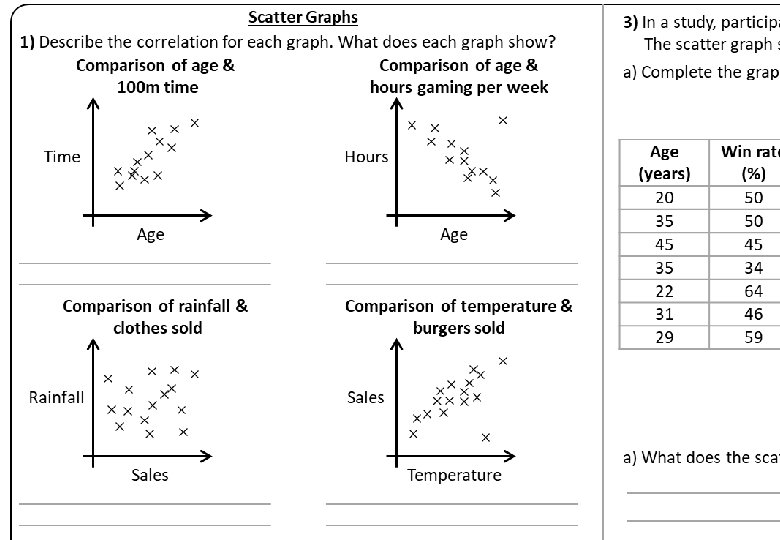
Scatter Graphs 1) Describe the correlation for each graph. What does each graph show? Comparison of age & 100 m time hours gaming per week 3) In a study, participants played a video game for 3 hours. The scatter graph shows their percentage win rate & their age. a) Complete the graph with the data for the last 7 participants 70 Hours Age Comparison of rainfall & clothes sold Comparison of temperature & burgers sold Age (years) 20 35 45 35 22 31 29 Win rate (%) 50 50 45 34 64 46 59 60 Win Rate (%) Time 50 40 30 Rainfall Sales 10 Temperature °C 16 14 18 14 24 19 14 17 19 Sales 25 25 15 10 35 15 15 10 30 Sales 2) The scatter graph shows sales of ice cream & daily temperature. Check the points have been plotted correctly & draw a line of best fit. 35 30 25 20 15 10 5 0 a) What does the scatter graph show? 20 30 40 Age (years) b) State the coordinates of an outlier. Draw a line of best fit & use the line of best fit to find: c) The expected win rate of a 40 year old player: d) The expected age of a player who won 58% of the time. Adel says “An 11 year old would have a win rate of over 70%!” Evaluate this statement. 14 16 18 20 22 24 26 Temperature °C 50
 Describe the correlation for each graph. What does each graph show?")
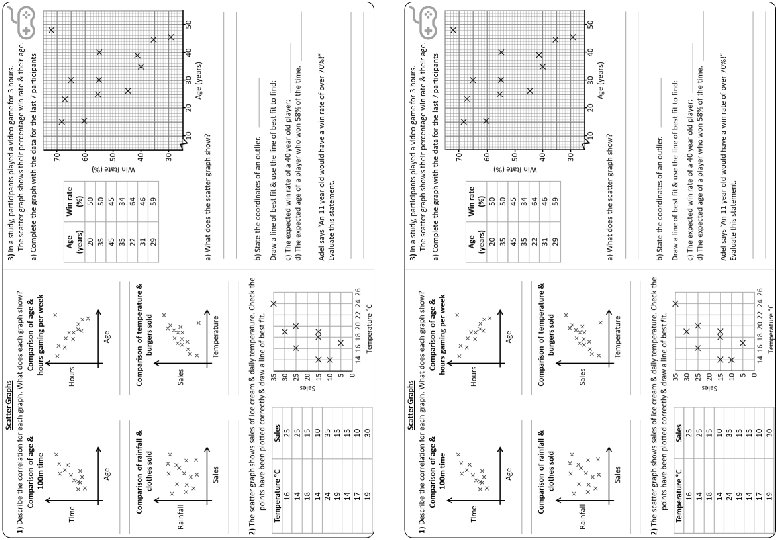
Scatter Graphs 1) Describe the correlation for each graph. What does each graph show? Comparison of age & 100 m time hours gaming per week 3) In a study, participants played a video game for 3 hours. The scatter graph shows their percentage win rate & their age. a) Complete the graph with the data for the last 7 participants 70 Hours Age Positive correlation Time increases with age. Age Negative correlation Hours gaming decrease with age. Comparison of rainfall & clothes sold Comparison of temperature & burgers sold Age (years) 20 35 45 35 22 31 29 Win rate (%) 50 50 45 34 64 46 59 60 Win Rate (%) Time 50 40 30 Rainfall Sales No correlation Sales not related to rainfall. 10 Temperature Positive correlation Sales increase with temperature. Temperature °C 16 14 18 14 24 19 14 17 19 Sales 25 25 15 10 35 15 15 10 30 Sales 2) The scatter graph shows sales of ice cream & daily temperature. Check the points have been plotted correctly & draw a line of best fit. 35 30 25 20 15 10 5 0 a) What does the scatter graph show? 20 30 40 Age (years) 50 b) State the coordinates of an outlier. Draw a line of best fit & use the line of best fit to find: c) The expected win rate of a 40 year old player: d) The expected age of a player who won 58% of the time. Adel says “An 11 year old would have a win rate of over 70%!” Evaluate this statement. 14 16 18 20 22 24 26 Temperature °C Half Answers
 Describe the correlation for each graph. What does each graph show?")
Scatter Graphs 1) Describe the correlation for each graph. What does each graph show? Comparison of age & 100 m time hours gaming per week 3) In a study, participants played a video game for 3 hours. The scatter graph shows their percentage win rate & their age. a) Complete the graph with the data for the last 7 participants 70 Hours Age Positive correlation Time increases with age. Age Negative correlation Hours gaming decrease with age. Comparison of rainfall & clothes sold Comparison of temperature & burgers sold Age (years) 20 35 45 35 22 31 29 Win rate (%) 50 50 45 34 64 46 59 60 Win Rate (%) Time 50 40 30 Rainfall Sales No correlation Sales not related to rainfall. 10 Temperature Positive correlation Sales increase with temperature. Temperature °C 16 14 18 14 24 19 14 17 19 Sales 25 25 15 10 35 15 15 10 30 Sales 2) The scatter graph shows sales of ice cream & daily temperature. Check the points have been plotted correctly & draw a line of best fit. 35 30 25 20 15 10 5 0 a) What does the scatter graph show? Negative correlation Win rate decreases with age. b) State the coordinates of an outlier. 20 30 40 Age (years) 50 (48, 72) Draw a line of best fit & use the line of best fit to find: ≈ 38% c) The expected win rate of a 40 year old player: d) The expected age of a player who won 58% of the time. 25 Adel says “An 11 year old would have a win rate of over 70%!” Evaluate this statement. 14 16 18 20 22 24 26 Temperature °C The graph does not support this. It is beyond the line of best fit, it is extrapolation. years old
 Describe the correlation for each graph. What does each graph show?")
Scatter Graphs 1) Describe the correlation for each graph. What does each graph show? Comparison of age & 100 m time hours gaming per week 3) In a study, participants played a video game for 3 hours. The scatter graph shows their percentage win rate & their age. a) Complete the graph with the data for the last 7 participants 70 Hours Age Comparison of rainfall & clothes sold Comparison of temperature & burgers sold Age (years) 20 35 45 35 22 31 29 Win rate (%) 50 50 45 34 64 46 59 60 Win Rate (%) Time 50 40 30 Rainfall Sales 10 Temperature °C 16 14 18 14 24 19 14 17 19 Sales 25 25 15 10 35 15 15 10 30 Sales 2) The scatter graph shows sales of ice cream & daily temperature. Check the points have been plotted correctly & draw a line of best fit. 35 30 25 20 15 10 5 0 a) What does the scatter graph show? 20 30 40 Age (years) b) State the coordinates of an outlier. Draw a line of best fit & use the line of best fit to find: c) The expected win rate of a 40 year old player: d) The expected age of a player who won 58% of the time. Adel says “An 11 year old would have a win rate of over 70%!” Evaluate this statement. 14 16 18 20 22 24 26 Temperature °C 50

Questions? Comments? Suggestions? …or have you found a mistake!? Any feedback would be appreciated . Please feel free to email: tom@goteachmaths. co. uk
- Slides: 9