Scatter Graphs Foundation GCSE Questions These questions are


- Slides: 11
Scatter Graphs – Foundation – GCSE Questions These questions are the same format as previous GCSE exams. COPY means they use the exact same numbers as the original GCSE question. Otherwise, they are clone questions using different numbers. The worksheets are provided in a variety of sizes.
Printing To print handouts from slides Select the slide from the left. Then click: File > Print > ‘Print Current Slide’ To print multiple slides Click on a section title to highlight all those slides, or press ‘Ctrl’ at the same time as selecting slides to highlight more than one. Then click: File > Print > ‘Print Selection’ To print double-sided handouts Highlight both slides before using ‘Print Selection’. Choose ‘Print on Both Sides’ and ‘Flip on Short Edge’.
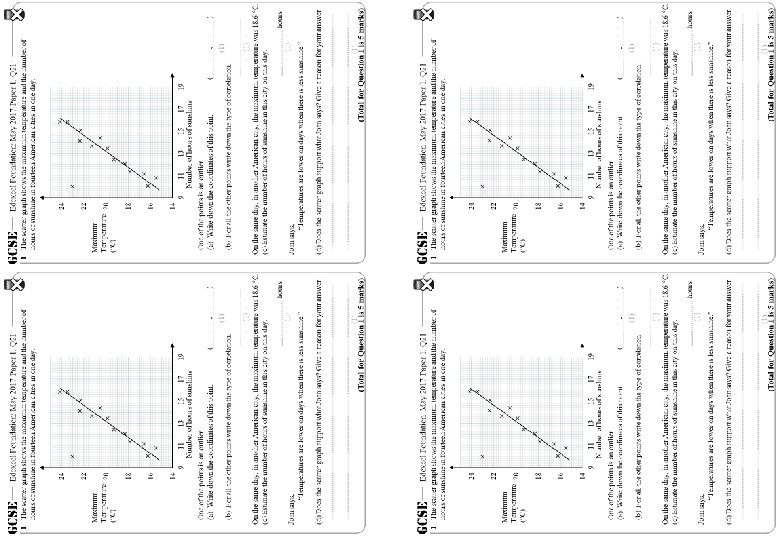
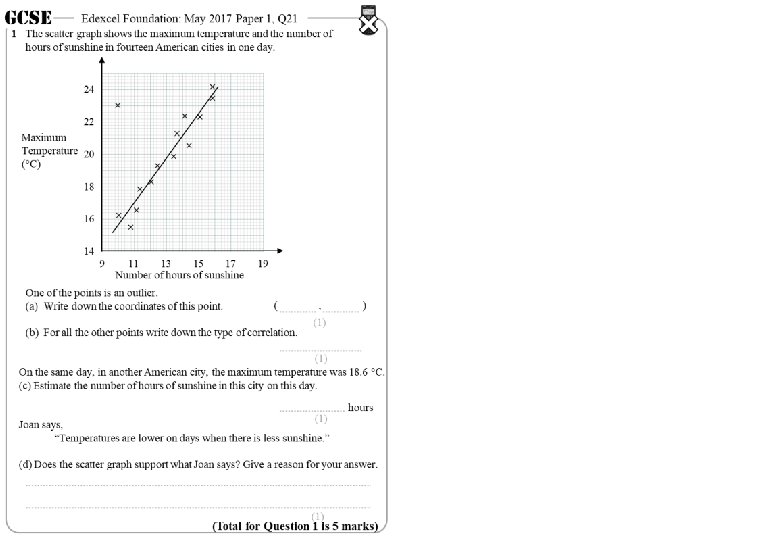
GCSE Edexcel Foundation: May 2017 Paper 1, Q 21 1 The scatter graph shows the maximum temperature and the number of hours of sunshine in fourteen American cities in one day. × × 24 × × Maximum Temperature 20 (°C) 18 × 16 × × × × 24 × × × 22 Edexcel Foundation: May 2017 Paper 1, Q 21 1 The scatter graph shows the maximum temperature and the number of hours of sunshine in fourteen American cities in one day. × × 22 × Maximum Temperature 20 (°C) × 14 18 × 16 × × × × 14 9 11 13 15 17 Number of hours of sunshine One of the points is an outlier. (a) Write down the coordinates of this point. 19 9 ( (b) For all the other points write down the type of correlation. , ) (1) One of the points is an outlier. (a) Write down the coordinates of this point. 19 ( (b) For all the other points write down the type of correlation. (1) On the same day, in another American city, the maximum temperature was 18. 6 °C. (c) Estimate the number of hours of sunshine in this city on this day. (1) 11 13 15 17 Number of hours of sunshine hours , ) (1) On the same day, in another American city, the maximum temperature was 18. 6 °C. (c) Estimate the number of hours of sunshine in this city on this day. (1) hours Joan says, “Temperatures are lower on days when there is less sunshine. ” (d) Does the scatter graph support what Joan says? Give a reason for your answer. (1) (Total for Question 1 is 5 marks)
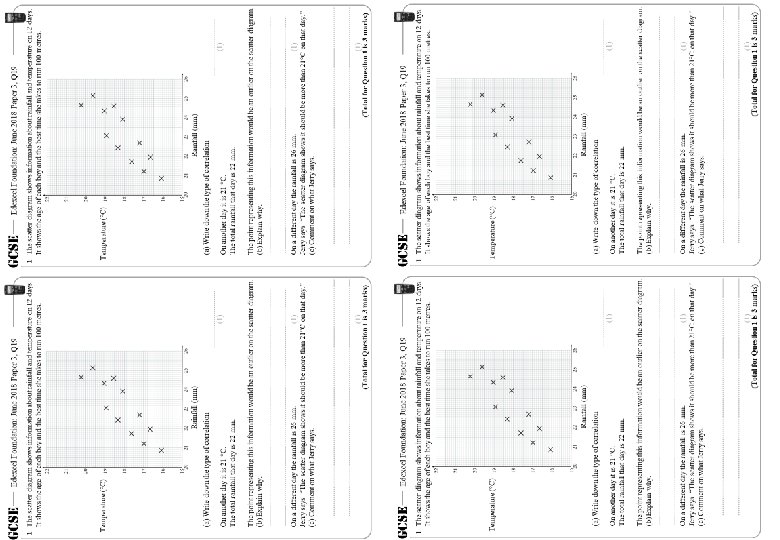
GCSE Edexcel Foundation: June 2018 Paper 3, Q 19 1 The scatter diagram shows information about rainfall and temperature on 12 days. It shows the age of each boy and the best time she takes to run 100 metres. Temperature (°C) Rainfall (mm) (a) Write down the type of correlation On another day it is 21 °C. The total rainfall that day is 22 mm. (1) The point representing this information would be an outlier on the scatter diagram. (b) Explain why. On a different day the rainfall is 26 mm. (1) Jerry says “The scatter diagram shows it should be more than 21°C on that day. ” (c) Comment on what Jerry says. (1) (Total for Question 1 is 3 marks)
GCSE Edexcel Foundation: June 2018 Paper 3, Q 19 1 The scatter diagram shows information about rainfall and temperature on 12 days. It shows the age of each boy and the best time she takes to run 100 metres. Temperature (°C) Rainfall (mm) (a) Write down the type of correlation On another day it is 21 °C. The total rainfall that day is 22 mm. (1) The point representing this information would be an outlier on the scatter diagram. (b) Explain why. On a different day the rainfall is 26 mm. (1) Jerry says “The scatter diagram shows it should be more than 21°C on that day. ” (c) Comment on what Jerry says. (1) (Total for Question 1 is 3 marks)
GCSE Edexcel Foundation: May 2017 Paper 1, Q 21 1 The scatter graph shows the maximum temperature and the number of hours of sunshine in fourteen American cities in one day. × × 24 × × × 22 × Maximum Temperature 20 (°C) 18 × 16 × × × × 14 9 11 13 15 17 Number of hours of sunshine One of the points is an outlier. (a) Write down the coordinates of this point. 19 ( 10 , 23 (b) For all the other points write down the type of correlation. ) (1) positive (1) On the same day, in another American city, the maximum temperature was 18. 6 °C. (c) Estimate the number of hours of sunshine in this city on this day. 12. 2 (1) hours Joan says, “Temperatures are lower on days when there is less sunshine. ” (d) Does the scatter graph support what Joan says? Give a reason for your answer. Yes, the majority of days with a lower temperature have less sunshine. (1) (Total for Question 1 is 5 marks)
GCSE Edexcel Foundation: June 2018 Paper 3, Q 19 1 The scatter diagram shows information about rainfall and temperature on 12 days. It shows the age of each boy and the best time she takes to run 100 metres. Temperature (°C) Rainfall (mm) (a) Write down the type of correlation On another day it is 21 °C. The total rainfall that day is 22 mm. positive (1) The point representing this information would be an outlier on the scatter diagram. (b) Explain why. It does not fit with the correlation. On a different day the rainfall is 26 mm. (1) Jerry says “The scatter diagram shows it should be more than 21°C on that day. ” (c) Comment on what Jerry says. The point would be outside the range of the scatter diagram (1) (Total for Question 1 is 3 marks)
Questions? Comments? Suggestions? …or have you found a mistake!? Any feedback would be appreciated . Please feel free to email: tom@goteachmaths. co. uk