Scatter Graphs Foundation GCSE Questions AQA These questions


- Slides: 11
Scatter Graphs – Foundation – GCSE Questions – AQA These questions are the same format as previous GCSE exams. COPY means they use the exact same numbers as the original GCSE question. Otherwise, they are clone questions using different numbers. The worksheets are provided in 2 sizes.
Printing To print handouts from slides Select the slide from the left. Then click: File > Print > ‘Print Current Slide’ To print multiple slides Click on a section title to highlight all those slides, or press ‘Ctrl’ at the same time as selecting slides to highlight more than one. Then click: File > Print > ‘Print Selection’ To print double-sided handouts Highlight both slides before using ‘Print Selection’. Choose ‘Print on Both Sides’ and ‘Flip on Short Edge’.
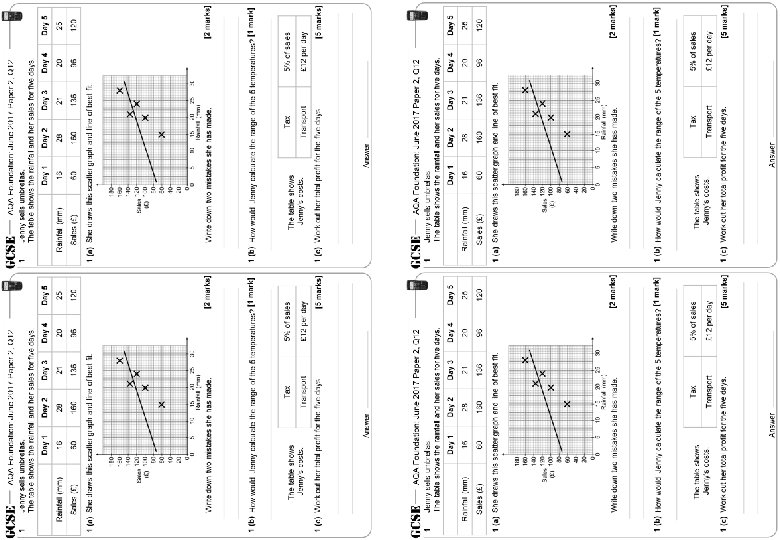
AQA Foundation: June 2017 Paper 2, Q 12 1 AQA Foundation: June 2017 Paper 2, Q 12 Jenny sells umbrellas. The table shows the rainfall and her sales for five days. 1 Day 2 Day 3 Day 4 Day 5 Rainfall (mm) 16 28 21 20 25 Sales (£) 60 136 96 120 1 (a) She draws this scatter graph and line of best fit. Write down two mistakes she has made. [2 marks] Tax 5% of sales Transport £ 12 per day 1 (c) Work out her total profit for the five days. Answer Day 1 Day 2 Day 3 Day 4 Day 5 Rainfall (mm) 16 28 21 20 25 Sales (£) 60 136 96 120 1 (a) She draws this scatter graph and line of best fit. 1 (b) How would Jenny calculate the range of the 5 temperatures? [1 mark] The table shows Jenny’s costs. Jenny sells umbrellas. The table shows the rainfall and her sales for five days. [5 marks] Write down two mistakes she has made. [2 marks] 1 (b) How would Jenny calculate the range of the 5 temperatures? [1 mark] The table shows Jenny’s costs. Tax 5% of sales Transport £ 12 per day 1 (c) Work out her total profit for the five days. Answer [5 marks]
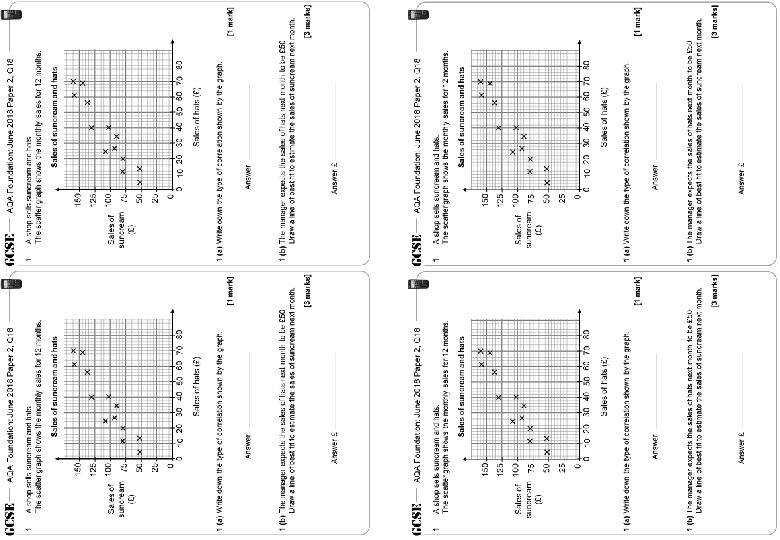
AQA Foundation: June 2018 Paper 2, Q 18 1 AQA Foundation: June 2018 Paper 2, Q 18 A shop sells suncream and hats. The scatter graph shows the monthly sales for 12 months. 1 A shop sells suncream and hats. The scatter graph shows the monthly sales for 12 months. Sales of suncream and hats 150 125 Sales of 100 suncream 75 (£) 50 25 25 0 0 0 10 20 30 40 50 60 70 80 Sales of hats (£) 1 (a) Write down the type of correlation shown by the graph. [1 mark] Answer 1 (b) The manager expects the sales of hats next month to be £ 50 Draw a line of best fit to estimate the sales of suncream next month. [3 marks] Answer £
AQA Foundation: June 2017 Paper 2, Q 12 1 Jenny sells umbrellas. The table shows the rainfall and her sales for five days. Day 1 Day 2 Day 3 Day 4 Day 5 Rainfall (mm) 16 28 21 20 25 Sales (£) 60 136 96 120 1 (a) She draws this scatter graph and line of best fit. Write down two mistakes she has made. [2 marks] 1 (b) How would Jenny calculate the range of the 5 temperatures? [1 mark] The table shows Jenny’s costs. Tax 5% of sales Transport £ 12 per day 1 (c) Work out her total profit for the five days. Answer [5 marks]
AQA Foundation: June 2018 Paper 2, Q 18 1 A shop sells suncream and hats. The scatter graph shows the monthly sales for 12 months. Sales of suncream and hats 150 125 Sales of 100 suncream 75 (£) 50 25 0 0 10 20 30 40 50 60 70 80 Sales of hats (£) 1 (a) Write down the type of correlation shown by the graph. [1 mark] Answer 1 (b) The manager expects the sales of hats next month to be £ 50 Draw a line of best fit to estimate the sales of suncream next month. [3 marks] Answer £
AQA Foundation: June 2017 Paper 2, Q 12 1 Jenny sells umbrellas. The table shows the rainfall and her sales for five days. Day 1 Day 2 Day 3 Day 4 Day 5 Rainfall (mm) 16 28 21 20 25 Sales (£) 60 136 96 120 1 (a) She draws this scatter graph and line of best fit. [2 marks] Write down two mistakes she has made. LOBF: incorrect plotting LOBF: beyond data (25, 120) incorrect 1 (b) How would Jenny calculate the range of the 5 temperatures? [1 mark] highest value – lowest value The table shows Jenny’s costs. Tax 5% of sales Transport £ 12 per day 1 (c) Work out her total profit for the five days. Total = £ 572 − 5% (Multiply by 0. 95) = £ 543. 4 Answer [5 marks] − (12 x 5) = £ 483. 40
AQA Foundation: June 2018 Paper 2, Q 18 1 A shop sells suncream and hats. The scatter graph shows the monthly sales for 12 months. Sales of suncream and hats 150 125 Sales of 100 suncream 75 (£) 50 25 0 0 10 20 30 40 50 60 70 80 Sales of hats (£) 1 (a) Write down the type of correlation shown by the graph. Answer Positive [1 mark] 1 (b) The manager expects the sales of hats next month to be £ 50 Draw a line of best fit to estimate the sales of suncream next month. Answer £ £ 130 [3 marks]
Questions? Comments? Suggestions? …or have you found a mistake!? Any feedback would be appreciated . Please feel free to email: tom@goteachmaths. co. uk