Scatter Graphs Card Complete Match In this activity


 Match the data tables with the graphs. 2) Plot all the points on")
 Temperature (°C) Nairobi Outlier: ( 11 , 26 ) Outlier:")
 Temperature (°C) Nairobi Outlier: ( 11 , 26 ) Outlier:")
 Strong positive correlation Outlier: ( 16 , 15")

- Slides: 9
Scatter Graphs – Card Complete & Match In this activity students work individually or in groups to match questions and answers. Instead of cutting out cards, students can letter questions and answers that go together. A variety of card sizes are included.
Printing To print handouts from slides Select the slide from the left. Then click: File > Print > ‘Print Current Slide’ To print multiple slides Click on a section title to highlight all those slides, or press ‘Ctrl’ at the same time as selecting slides to highlight more than one. Then click: File > Print > ‘Print Selection’ To print double-sided handouts Highlight both slides before using ‘Print Selection’. Choose ‘Print on Both Sides’ and ‘Flip on Short Edge’.
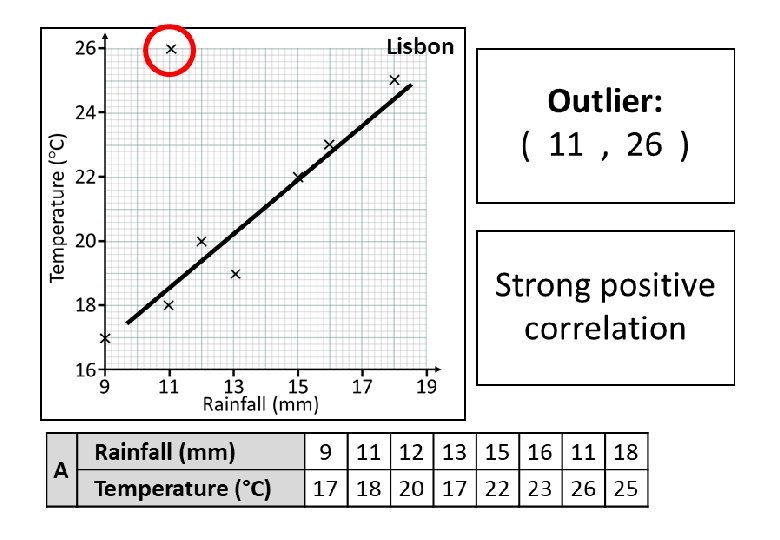
1) Match the data tables with the graphs. 2) Plot all the points on the scatter graphs. 3) Identify the coordinates of an outlier. 4) Plot a line of best fit. 5) Decide what type of correlation the scatter graph has.
Lisbon A Rainfall (mm) Temperature (°C) Nairobi Outlier: ( 11 , 26 ) Outlier: ( 16 , 15 ) Strong positive correlation Good positive correlation 9 11 12 13 15 16 11 18 17 18 20 19 22 23 26 25 B Rainfall (mm) Temperature (°C) 10 11 11 13 15 15 16 18 19 18 20 18 19 20 22 15 22 23 Half Answers
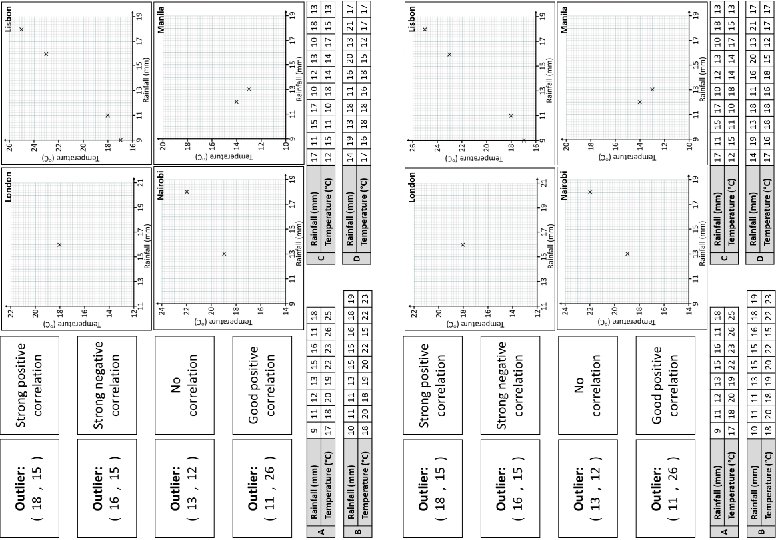
Lisbon A Rainfall (mm) Temperature (°C) Nairobi Outlier: ( 11 , 26 ) Outlier: ( 16 , 15 ) Strong positive correlation Good positive correlation 9 11 12 13 15 16 11 18 17 18 20 19 22 23 26 25 B Rainfall (mm) Temperature (°C) Manila C Rainfall (mm) Temperature (°C) 10 11 11 13 15 15 16 18 19 18 20 18 19 20 22 15 22 23 London Outlier: ( 18 , 15 ) Outlier: ( 13 , 12 ) Strong negative correlation No correlation 17 11 15 17 10 12 13 10 18 13 12 15 11 10 18 14 14 17 15 13 D Rainfall (mm) Temperature (°C) 14 19 13 18 11 16 20 13 21 17 17 16 18 18 16 18 15 12 17 17
Outlier: ( 18 , 15 ) Strong positive correlation Outlier: ( 16 , 15 ) Strong negative correlation Outlier: ( 13 , 12 ) No correlation Outlier: ( 11 , 26 ) Good positive correlation London Lisbon Nairobi Manila A Rainfall (mm) Temperature (°C) 9 11 12 13 15 16 11 18 17 18 20 19 22 23 26 25 C Rainfall (mm) Temperature (°C) 17 11 15 17 10 12 13 10 18 13 12 15 11 10 18 14 14 17 15 13 B Rainfall (mm) Temperature (°C) 10 11 11 13 15 15 16 18 19 18 20 18 19 20 22 15 22 23 D Rainfall (mm) Temperature (°C) 14 19 13 18 11 16 20 13 21 17 17 16 18 18 16 18 15 12 17 17
Questions? Comments? Suggestions? …or have you found a mistake!? Any feedback would be appreciated . Please feel free to email: tom@goteachmaths. co. uk