Satellite Image Based Classification Mapping For Spatially Analyzing

Satellite Image Based Classification Mapping For Spatially Analyzing West Virginia Corridor H Urban Development Chandra Inglis-Smith

Introduction and Background

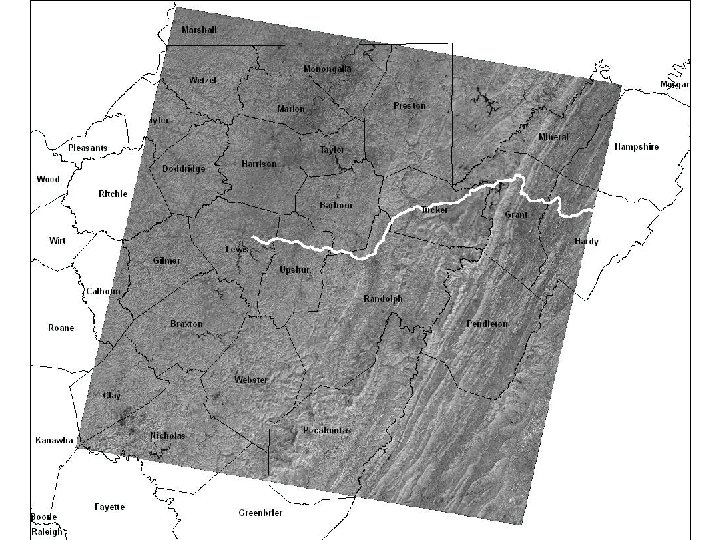
Study Area • The study area is all of Corridor H. Barbour Tucker Grant Co. Co Lewis Co Hardy Co Upshur Randolph Co Co

Study Area • Earliest Euro-American Settlements – late 18 th century, followed patterns established by Native Americans. • Transportation consisted of dirt roads and trails till mid 18 th century with development of turnpikes and the railroad in the 20 th century. • Main Economic Focus – Agriculture • Cattle, grain corn, poultry – Resource Extraction • Timber, Coal and coke

Overview of Corridor H • Part of the Appalachian Development Highway System a program run by the Appalachian Regional Commission (ARC). • The main goal of Corridor H is to foster economic growth in the region, by improving east-west travel, inter-community travel, emergency response time, freight travel, and increasing access to recreational facilities in the area by linking the existing north-south interstates in the region.

Land-Use & Land-Cover
. –")
Remote Sensing • Satellite Systems collect data in multiple electromagnetic spectrum bands (wavelengths). – Ex) visible and near to mid infrared • Resolution Types: Spatial Spectral Temporal www. wvview. org www. eomonline. com ds 9. ssl. berkeley. edu Radiometric www. uni-kiel. de/. . . / ch 2/images/reichstag 2 bit. gif

Change Detection • Change detection is the process of identifying differences in the state of an object or phenomenon by observing it at different times. (Singh, 1989 in Bottomley, 22) • Change Detection Methods – Map Algebra, Direct Multi-date Classification, Post Classification Comparison • Change detection is useful for: – land use analysis, monitoring shifting cultivation, assessment of deforestation, disaster monitoring, day/night analysis of thermal characteristics and for tracking urban and economic growth.

Purpose and Objective • Purpose: To look at change in the study area over time by mapping present day West Virginia and comparing it to the past through the use of satellite imagery and GIS data. • Objective: To perform analysis on two datasets obtained from the USGS of the study area from the years 1987 and 2005 to determine if remote sensing techniques, specifically change detection, could be utilized to measure urban development (economic development) and isolate potential locations of future economic growth along Corridor H.

Methods and Techniques

Data • Landsat Satellite Imagery • Vector Data • NLCD Dataset Date of Acquisition Landsat Satellite Number Imager Type Spatial Resolution (m) Sun Elevation (degrees) Sun Azimuth (degrees) Cloud Cover (%) 14 Oct 1987 Path 17 Row 33 5 TM 25 37. 80 148. 19 0% 05 Oct 2005 Path 17 Row 33 5 TM 25 40. 61 145. 54 0%

File Conversion • Three Software Packages: Er. Mapper, IDRISI, ESRI Arc. GIS – utilized ASCII (. asc) to import and export – “. ers” files loaded directly into ESRI Arc. Map – Two shapefiles were converted for use in Er. Mapper and IDRISI • Corridor H polyline • Corridor H boundary polygon

Preprocessing • Geometric Rectification – Registration coordinates were manually corrected. – Polynomial Transformation using 2005 image as the base image.
 – A statistical procedure of data compression. The")
PCA • Principal Components Analysis (PCA) – A statistical procedure of data compression. The 1 st principal component usually accounts for most of the variability in the data. – Allows you to pick out patterns and relationships in the variables. – Allows you to reduce the size of your dataset with no significant information loss. – Isolates and defines features more thoroughly than conventional band combinations.

PCA

Radiometric Normalization • Used histogram matching algorithms in ERMapper on the PCA datasets. • Transformed the final output histograms of the red, green, blue, PCA 1987 layers to match the final output histograms of the 2005 layer.

Unsupervised Classification • Images classified in Er. Mapper – – maximum number of 15 classes 99 iterations 0. 1% for minimum members in a class all others left as default • Classified images returned, clusters were labeled and identified as to land cover/use type – Vector – NLCD – SAMB

Classification

Accuracy Assessment • Non site-specific error matrix/confusion matrix – quantitatively assessed the NLCD reference layer and the classified images. • Utilized ESRI, Excel, & Access • Four accuracy assessments were derived: Omission Error (producer’s accuracy) Commission Error (user’s accuracy) Overall Accuracy Kappa Analysis (Khat)

Image Comparison • Done in ESRI using the Spatial Analyst procedure DIFF Figure 7: Results of Spatial Analyst Diff.

Image Generalization • Spatial Analysis in ESRI – – – Majority Filter: Land 2 = majorityfilter ([landiff], eight, half) Setnull: Lnd. Cvr 56 = setnull ([Land 2] <5, [Land 2]) Region Group: regiongroup ([Lnd. Cvr 56]) Setnull: setnull ([Region 1]. count le 10, lndcvr 56) Zonal. Area: zonalarea ([nosmlarea]) • * 0. 0001 , * 0. 0002471

Vector Overlay

Results and Discussion

Preprocessing • The results of the geometric registration returned a Root Mean Square error (RMS) of between 0. 01 and 0. 06 pixels. • This results in an error of less than 55 square meters or 0. 014 acres • Compared to the size of the study area, 10, 414, 210, 255 square meters or 2, 573, 351 acres, the error is minor in comparison

PCA • Bands 3, 4, & 5 • Bands 2, 3, & 4 • PCA’s 1, 2, & 3

Radiometric Normalization • Before classifying the PCA images from Path 17 1987 and 2005 were radiometrically normalized to standardize for effects outside of actual real surface change. • The result was similar radiometric responses across feature types on which to base the classifications.

Classification • Images allowed the same parameters – – – 15 classes 99 iterations 0. 1% for minimum members in a class pixels with a zero value were set to null all other options were left as default. • Path 17 1987 PCA image returned 10 classes • Path 17 2005 PCA Image returned 12 classes • Classified Images compared to NLCD dataset and SAMB Aerial Photography

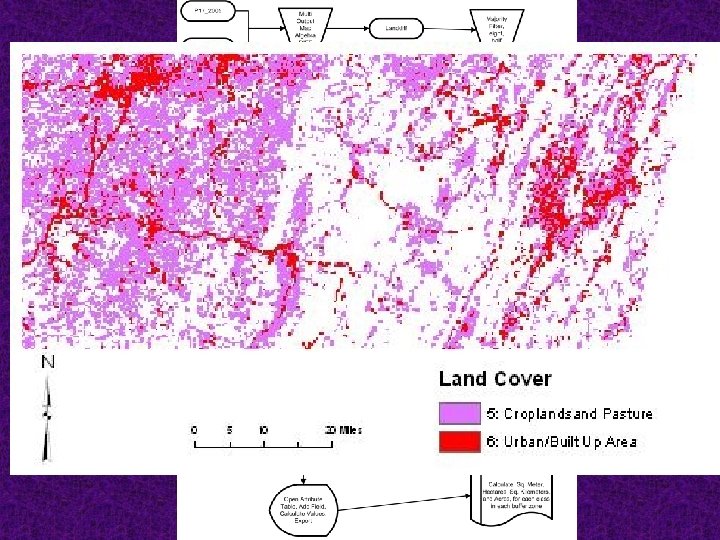
Classification • The images were then reclassified into the exact same six classes. Class # Class Type Description 1 Open Water All areas of open water, generally with greater than 95% cover of water, including streams rivers, lakes and reservoirs. 2 Deciduous Includes all forested area having a predominance of trees that lose their leaves during a growing season 3 Evergreen, Transitional Includes all forested areas in which the trees are predominantly those which remain green throughout the year 4 Emergent and Woody Wetlands Dominated by both woody vegetation and herbaceous vegetation. Can include freshwater meadows, and open bogs. 5 Croplands and Pastures Characterized by high percentages of grasses, other herbaceous vegetation and crops: including lands that are regularly mowed for hay and or grazed by livestock, and regularly tilled and planted cropland 6 Mixed Urban or Built up land Comprised of areas of intensive use with much of the land covered by structures. Included in this category are cities, towns, villages, Residential areas, strip developments, transportation, industrial, commercial, shopping centers, commercial enterprises, strip mines, and quarries.

NLCD 1987 2005

Accuracy Assessment Image Date 1987 2005 Overall Accuracy 58% 63% • Errors in the accuracy may be from: – – – geometric registration normalization process classification process accuracy assessment process or the NLCD Dataset

Image Comparison

Weston Commercial Development as compared to 2003 and 1991

Elkins Commercial Development as compared to 2003 and 1991

Moorefield Commercial and H construction as compared to 2003 and 1991

Moorefield Residential as compared to 2003 and 1991

Image Comparison

Land Cover Sq M Hectares Sq Km Acres % of Change UBL in Total Study Area 149, 411, 952 149, 412 149 36, 920 1. 4% C&P in Total Study Area 513, 855, 392 513, 855 514 126, 974 4. 9% UBL in 1 mile buffer 18, 746, 612 1, 875 19 4, 632 2. 7% C&P in 1 mile 32, 021, 191 3, 202 32 7, 912 4. 6% UBL in 1 mile buffer around H from Weston to Elkins 10, 649, 236 1, 065 11 2, 631 4. 5% C&P in 1 mile buffer around H from Weston to Elkins 17, 826, 909 1, 783 18 4, 405 7. 5% UBL in 5 mile buffer 53, 344, 840 5, 334 53 13, 182 1. 5% C&P in 5 mile buffer 145, 763, 807 14, 576 146 36, 018 4. 2% UBL in 10 mile buffer 83, 297, 015 8, 330 83 2, 0583 1. 2% C&P in 10 mile buffer 289, 096, 934 28, 910 289 71, 436 4. 1% UBL in 15 mile buffer 100, 731, 409 10, 073 101 24, 891 . 9% C&P in 15 mile buffer 394, 467, 561 39, 447 394 97, 473 3. 6%

1 -Mile Buffer Zones

Conclusion

The Objective • To look at change in the study area over time by mapping present day West Virginia and comparing it to the past through the use of satellite imagery, GIS data and Remote Sensing change detection techniques. • To determine if economic development as seen through urban change can be measured along Corridor H.

Conclusion • The objective was accomplished. • Provides a baseline for future analysis. • Can be combined with more traditional methods of economic development measurement. • The use of this data can help to focus these economic studies, and supply spatial relevance to changes in rural Appalachia

Questions? ?
- Slides: 44