
SAS Global Forum 2009 Marty Ellingsworth ii A
SAS Global Forum 2009 Marty Ellingsworth (ii. A) The views expressed by the presenter does not necessarily represent the views, positions, or opinions of ISO. 1
Overview • Analytic Environment • About ISO • Analytics Framework – Ecosystem – Innovation process – Data opportunities – Sample Problem • What’s next – Good to Great 2
Business Environment Why things are becoming so data driven. The Market Ø Electronic connectivity is expected Ø Touch point knowledge is anticipated Ø Personalized service is assumed Ø Ease of doing business is desired Ø Low tolerance for not learning Each Company Ø Define, attract, retain, and grow “good” customers Ø Match offering to customer Ø Improve ‘customer facing processes’ Ø Reduce expenses while building skills 3
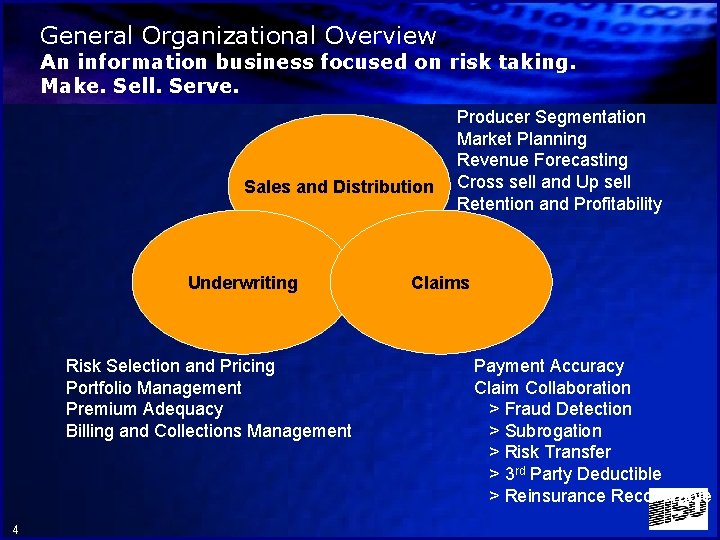
General Organizational Overview An information business focused on risk taking. Make. Sell. Serve. Sales and Distribution Underwriting Risk Selection and Pricing Portfolio Management Premium Adequacy Billing and Collections Management 4 Producer Segmentation Market Planning Revenue Forecasting Cross sell and Up sell Retention and Profitability Claims Payment Accuracy Claim Collaboration > Fraud Detection > Subrogation > Risk Transfer > 3 rd Party Deductible > Reinsurance Recoverable
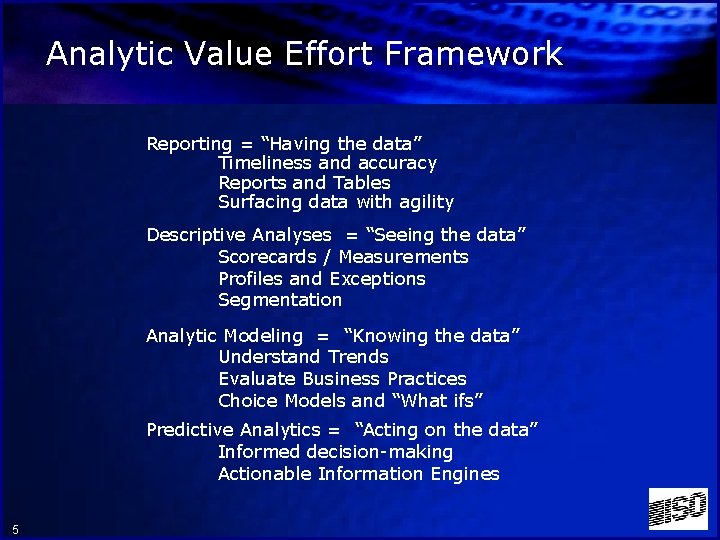
Analytic Value Effort Framework Reporting = “Having the data” Timeliness and accuracy Reports and Tables Surfacing data with agility Descriptive Analyses = “Seeing the data” Scorecards / Measurements Profiles and Exceptions Segmentation Analytic Modeling = “Knowing the data” Understand Trends Evaluate Business Practices Choice Models and “What ifs” Predictive Analytics = “Acting on the data” Informed decision-making Actionable Information Engines 5
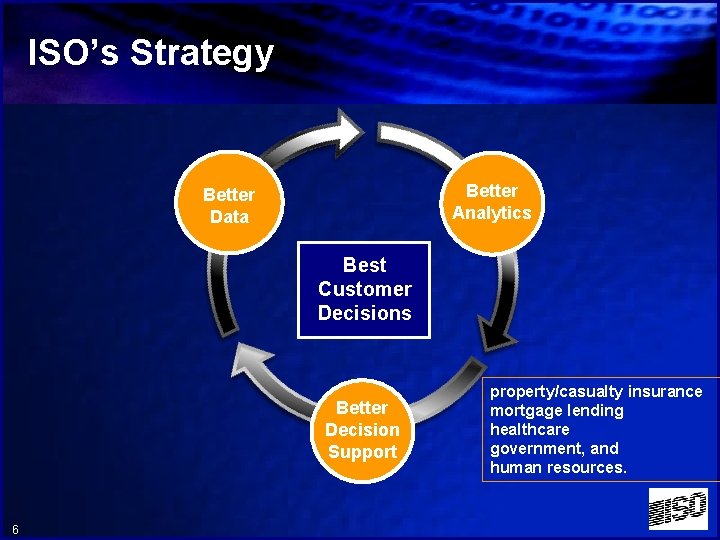
ISO’s Strategy Better Analytics Better Data Best Customer Decisions Better Decision Support 6 property/casualty insurance mortgage lending healthcare government, and human resources.
ISO Family Of Companies Domus Systems 7
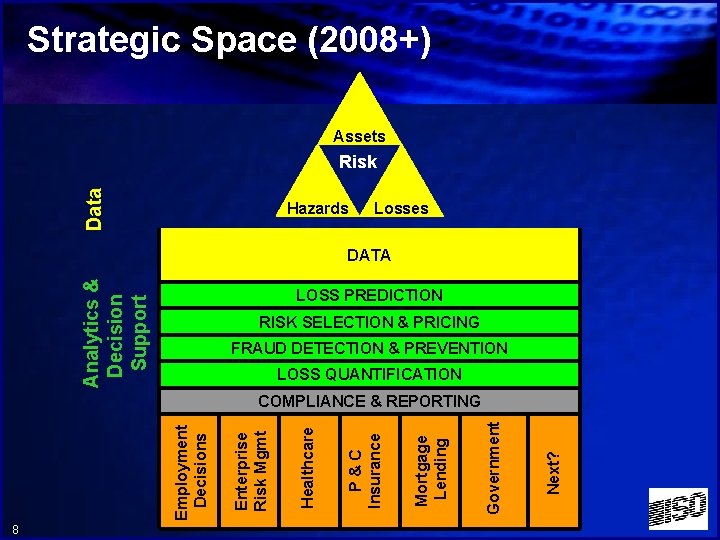
Strategic Space (2008+) Assets Data Risk Hazards Losses Analytics & Decision Support DATA LOSS PREDICTION RISK SELECTION & PRICING FRAUD DETECTION & PREVENTION LOSS QUANTIFICATION 8 Next? Government Mortgage Lending P & C Insurance Healthcare Enterprise Risk Mgmt Employment Decisions COMPLIANCE & REPORTING
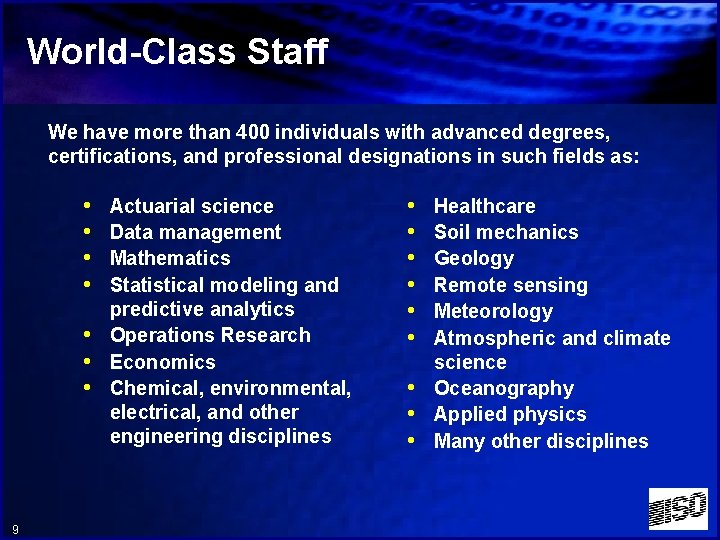
World-Class Staff We have more than 400 individuals with advanced degrees, certifications, and professional designations in such fields as: • • 9 Actuarial science Data management Mathematics Statistical modeling and predictive analytics Operations Research Economics Chemical, environmental, electrical, and other engineering disciplines • • • Healthcare Soil mechanics Geology Remote sensing Meteorology Atmospheric and climate science Oceanography Applied physics Many other disciplines
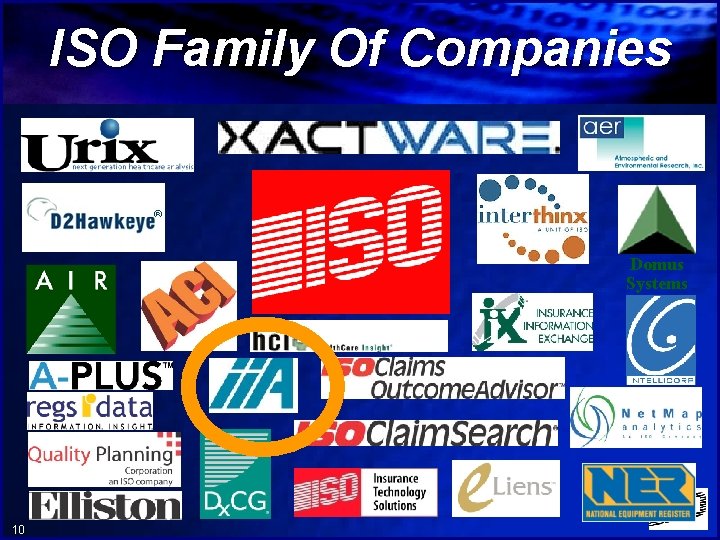
ISO Family Of Companies Domus Systems 10
Emerging Value in the Enterprise • • 11 What way can we create value together? What are we already doing? What’s working / not working? Some ideas on next steps
The ii. A Role 12
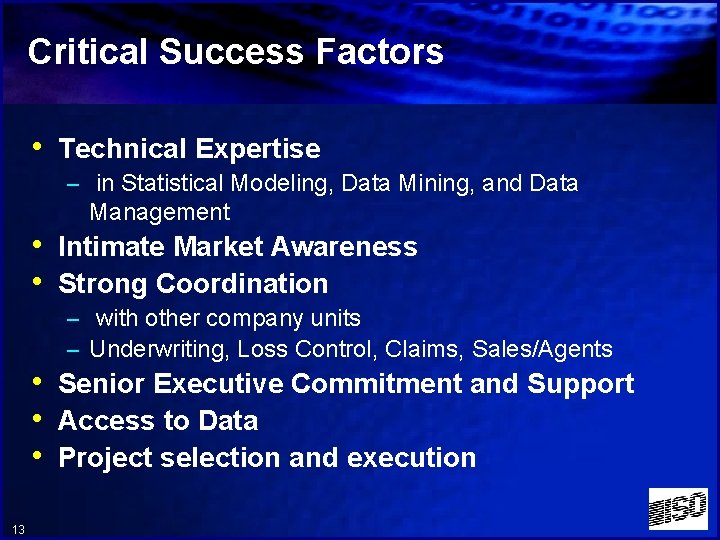
Critical Success Factors • Technical Expertise – in Statistical Modeling, Data Mining, and Data Management • Intimate Market Awareness • Strong Coordination – with other company units – Underwriting, Loss Control, Claims, Sales/Agents • Senior Executive Commitment and Support • Access to Data • Project selection and execution 13
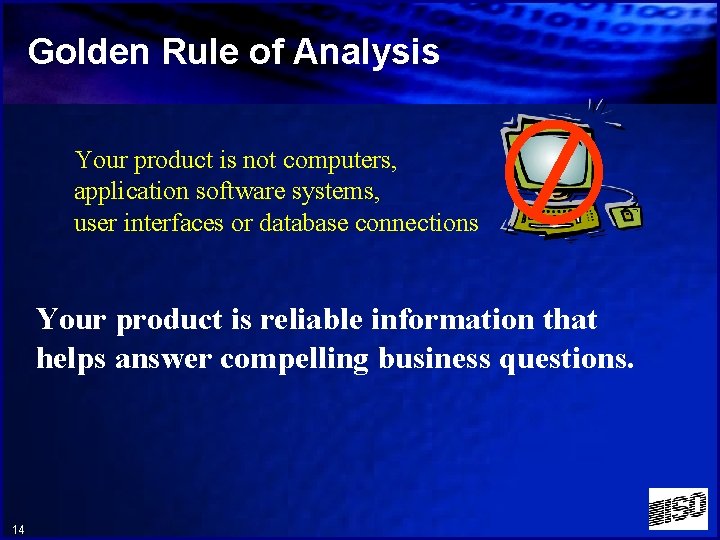
Golden Rule of Analysis Your product is not computers, application software systems, user interfaces or database connections Your product is reliable information that helps answer compelling business questions. 14
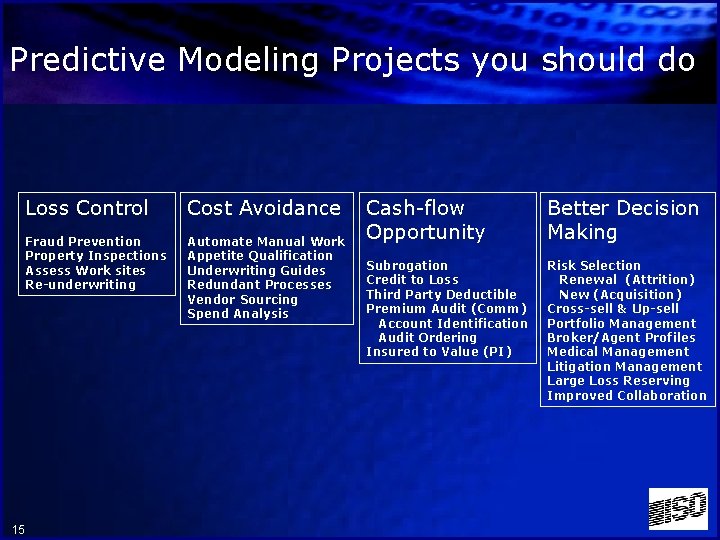
Predictive Modeling Projects you should do 15 Loss Control Cost Avoidance Fraud Prevention Property Inspections Assess Work sites Re-underwriting Automate Manual Work Appetite Qualification Underwriting Guides Redundant Processes Vendor Sourcing Spend Analysis Cash-flow Opportunity Better Decision Making Subrogation Credit to Loss Third Party Deductible Premium Audit (Comm) Account Identification Audit Ordering Insured to Value (PI) Risk Selection Renewal (Attrition) New (Acquisition) Cross-sell & Up-sell Portfolio Management Broker/Agent Profiles Medical Management Litigation Management Large Loss Reserving Improved Collaboration
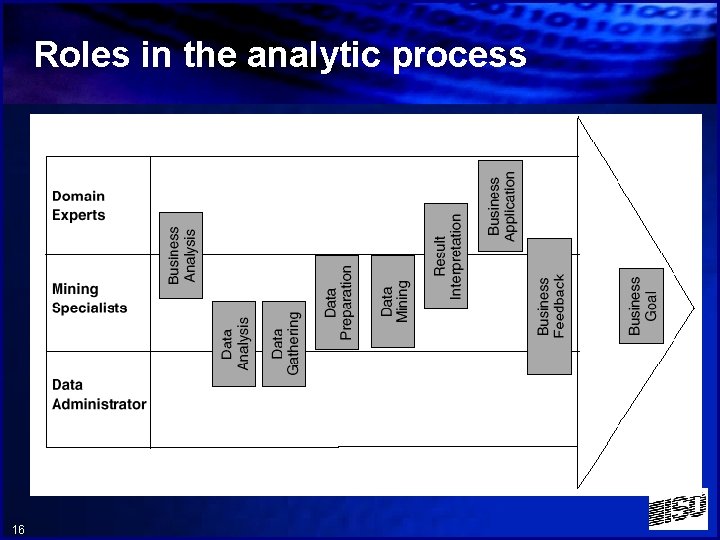
Roles in the analytic process 16
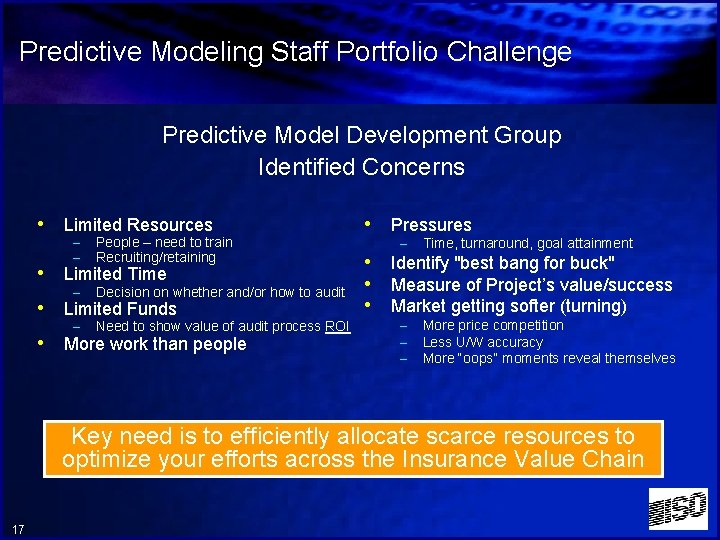
Predictive Modeling Staff Portfolio Challenge Predictive Model Development Group Identified Concerns • Limited Resources – – People – need to train Recruiting/retaining – Decision on whether and/or how to audit – Need to show value of audit process ROI • Limited Time • Limited Funds • More work than people • Pressures – Time, turnaround, goal attainment – – – More price competition Less U/W accuracy More “oops” moments reveal themselves • Identify "best bang for buck" • Measure of Project’s value/success • Market getting softer (turning) Key need is to efficiently allocate scarce resources to optimize your efforts across the Insurance Value Chain 17
innovation 18
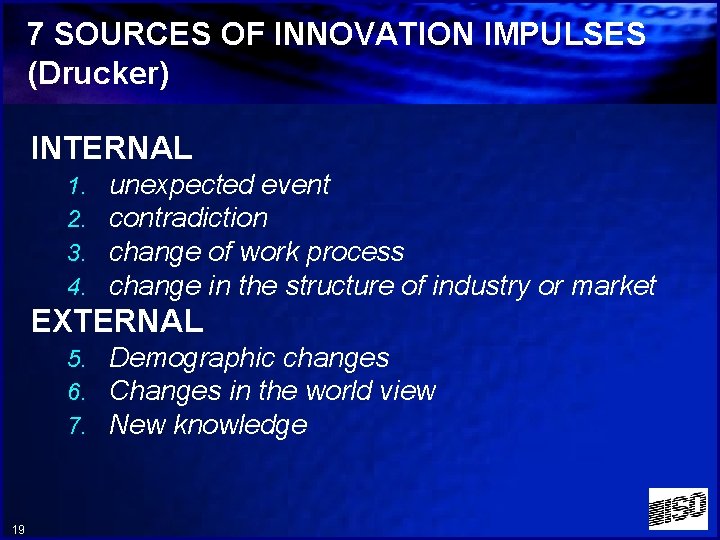
7 SOURCES OF INNOVATION IMPULSES (Drucker) INTERNAL 1. 2. 3. 4. unexpected event contradiction change of work process change in the structure of industry or market EXTERNAL 5. Demographic changes 6. Changes in the world view 7. New knowledge 19
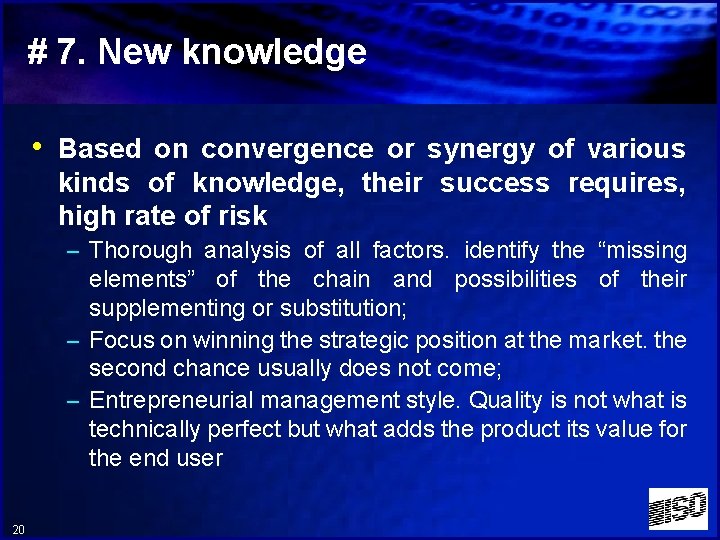
# 7. New knowledge • Based on convergence or synergy of various kinds of knowledge, their success requires, high rate of risk – Thorough analysis of all factors. identify the “missing elements” of the chain and possibilities of their supplementing or substitution; – Focus on winning the strategic position at the market. the second chance usually does not come; – Entrepreneurial management style. Quality is not what is technically perfect but what adds the product its value for the end user 20
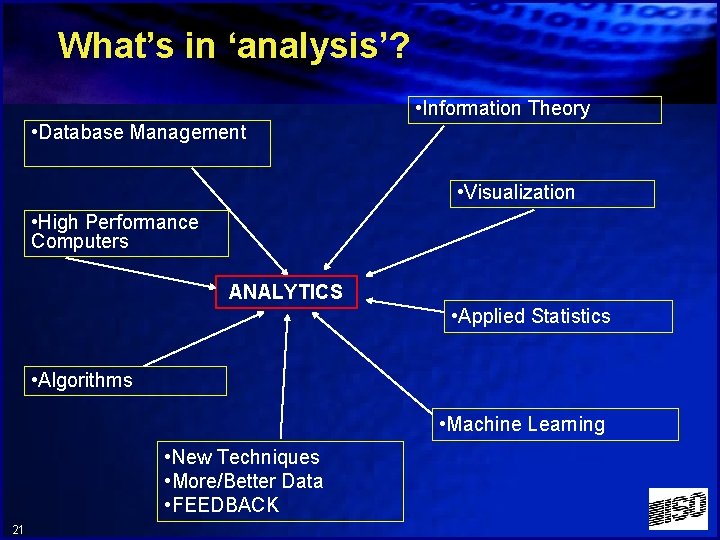
What’s in ‘analysis’? • Information Theory • Database Management • Visualization • High Performance Computers ANALYTICS • Applied Statistics • Algorithms • Machine Learning • New Techniques • More/Better Data • FEEDBACK 21
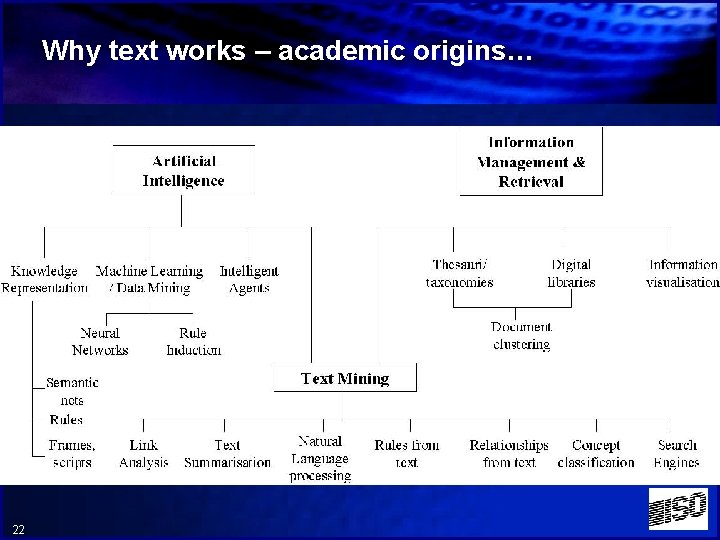
Why text works – academic origins… 22
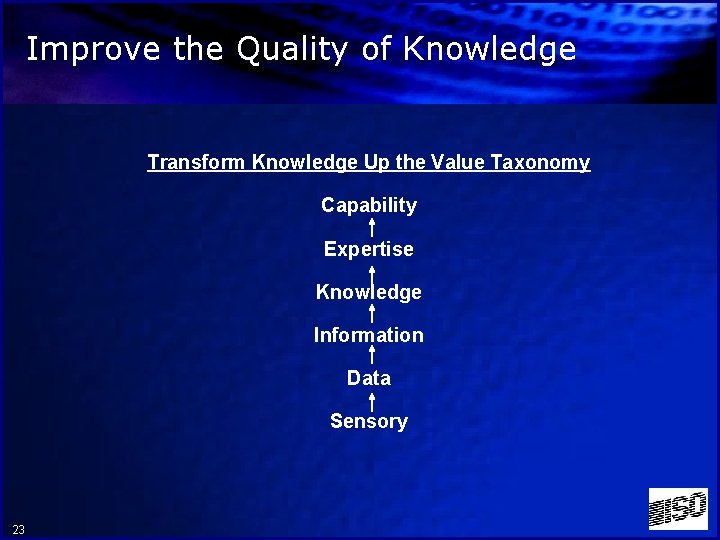
Improve the Quality of Knowledge Transform Knowledge Up the Value Taxonomy Capability Expertise Knowledge Information Data Sensory 23
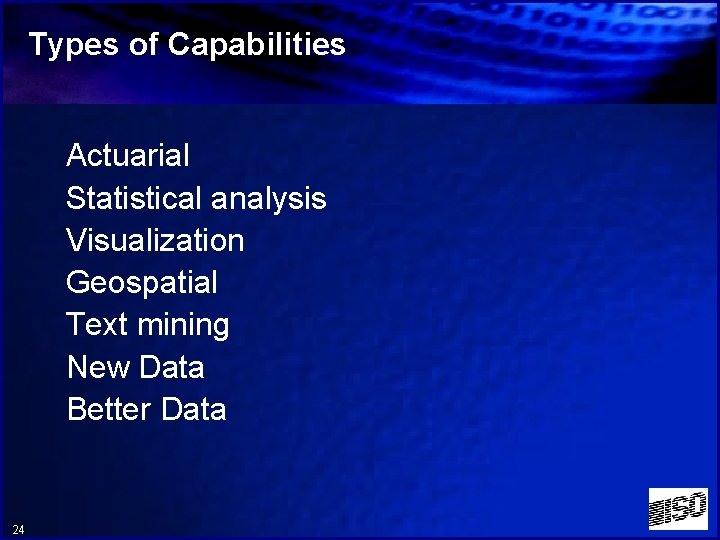
Types of Capabilities Actuarial Statistical analysis Visualization Geospatial Text mining New Data Better Data 24
The Role of Synergy • Synergy means that the whole is more • 25 than the sum of the parts. Synergy leads to: 1. Increased customer and shareholder value 2. Strategic focus in the management process 3. Efficient operating costs 4. Savvy investment through collaboration 5. Serendipitous Opportunities
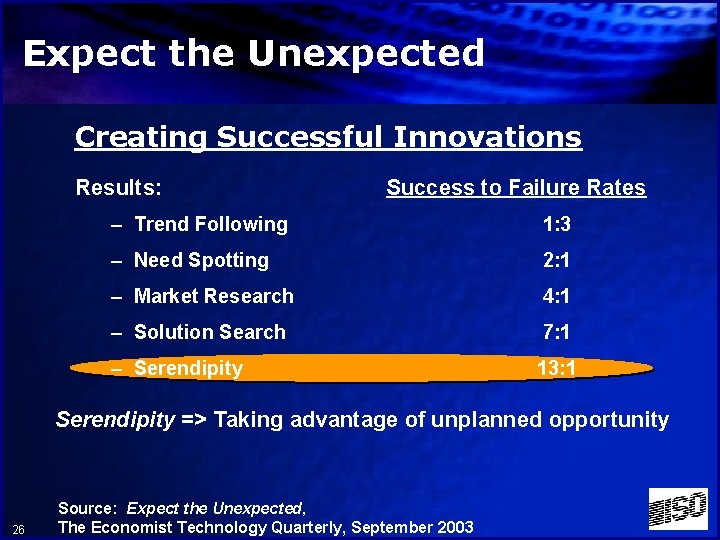
Expect the Unexpected Creating Successful Innovations Results: Success to Failure Rates – Trend Following 1: 3 – Need Spotting 2: 1 – Market Research 4: 1 – Solution Search 7: 1 – Serendipity 13: 1 Serendipity => Taking advantage of unplanned opportunity 26 Source: Expect the Unexpected, The Economist Technology Quarterly, September 2003
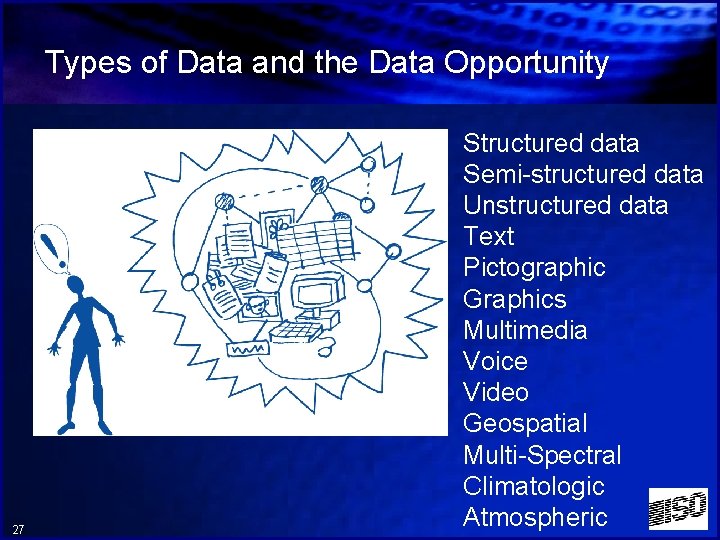
Types of Data and the Data Opportunity 27 Structured data Semi-structured data Unstructured data Text Pictographic Graphics Multimedia Voice Video Geospatial Multi-Spectral Climatologic Atmospheric
What to learn from Structured Data Significant pre-processing of raw data is needed to create useful informational features. Ø Ø Ø Ø Ø Repeatable Patterns Trends, Seasons, Cycle Propensities, Likelihood Causation and Interaction Ratios between Dollars and Distances Stakeholder Behavior Unlikely Occurrences Proximity of stakeholders Ownership interests of stakeholders Data Fusion and Learning is the key to successful Data Mining 28
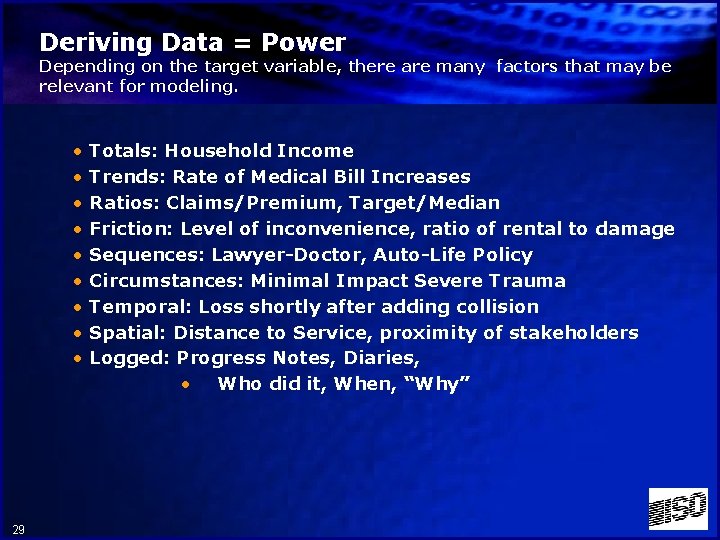
Deriving Data = Power Depending on the target variable, there are many factors that may be relevant for modeling. • • • 29 Totals: Household Income Trends: Rate of Medical Bill Increases Ratios: Claims/Premium, Target/Median Friction: Level of inconvenience, ratio of rental to damage Sequences: Lawyer-Doctor, Auto-Life Policy Circumstances: Minimal Impact Severe Trauma Temporal: Loss shortly after adding collision Spatial: Distance to Service, proximity of stakeholders Logged: Progress Notes, Diaries, • Who did it, When, “Why”
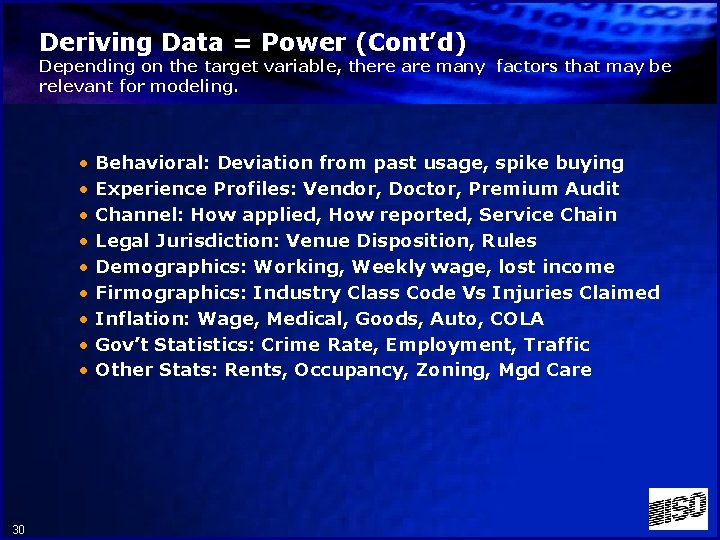
Deriving Data = Power (Cont’d) Depending on the target variable, there are many factors that may be relevant for modeling. • • • 30 Behavioral: Deviation from past usage, spike buying Experience Profiles: Vendor, Doctor, Premium Audit Channel: How applied, How reported, Service Chain Legal Jurisdiction: Venue Disposition, Rules Demographics: Working, Weekly wage, lost income Firmographics: Industry Class Code Vs Injuries Claimed Inflation: Wage, Medical, Goods, Auto, COLA Gov’t Statistics: Crime Rate, Employment, Traffic Other Stats: Rents, Occupancy, Zoning, Mgd Care
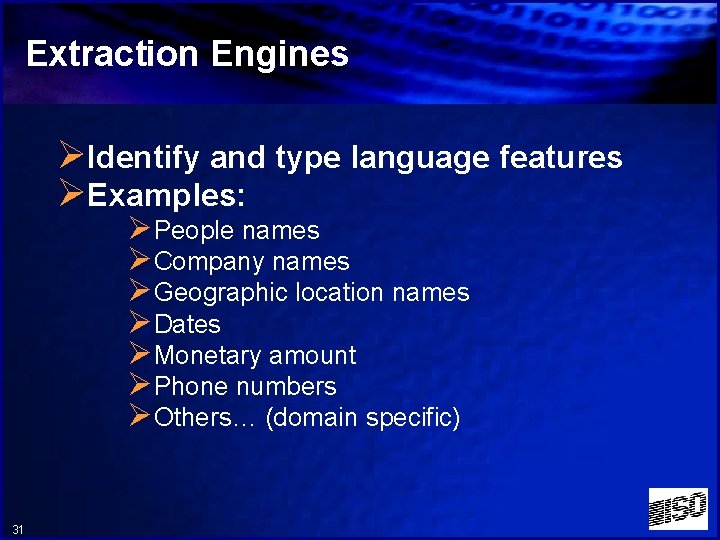
Extraction Engines ØIdentify and type language features ØExamples: ØPeople names ØCompany names ØGeographic location names ØDates ØMonetary amount ØPhone numbers ØOthers… (domain specific) 31
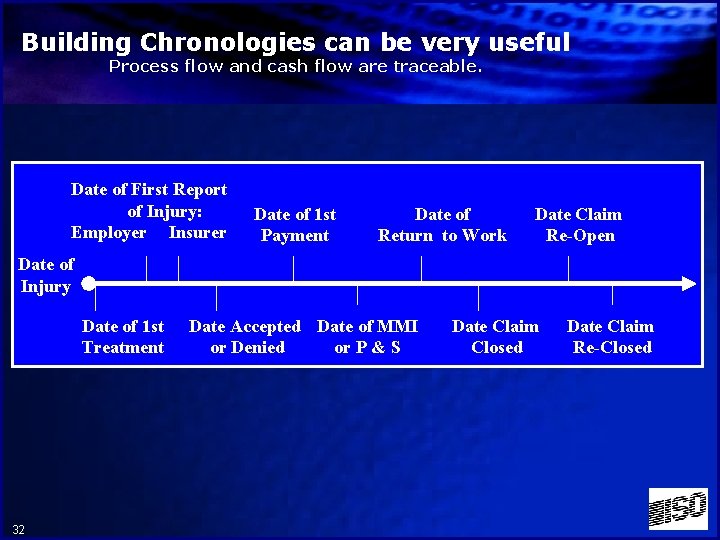
Building Chronologies can be very useful Process flow and cash flow are traceable. Date of First Report of Injury: Employer Insurer Date of 1 st Payment Date of Return to Work Date Claim Re-Open Date of Injury Date of 1 st Treatment 32 Date Accepted Date of MMI or Denied or P & S Date Claim Closed Date Claim Re-Closed
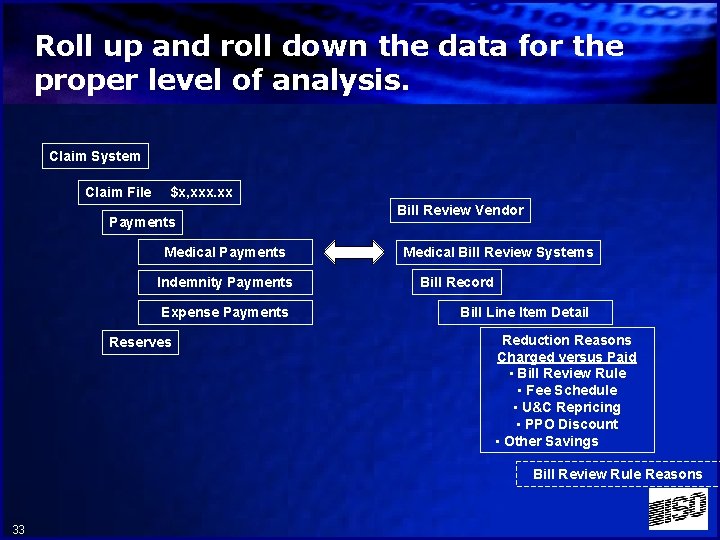
Roll up and roll down the data for the proper level of analysis. Claim System Claim File $x, xxx. xx Payments Medical Payments Indemnity Payments Expense Payments Reserves Bill Review Vendor Medical Bill Review Systems Bill Record Bill Line Item Detail Reduction Reasons Charged versus Paid • Bill Review Rule • Fee Schedule • U&C Repricing • PPO Discount • Other Savings Bill Review Rule Reasons 33
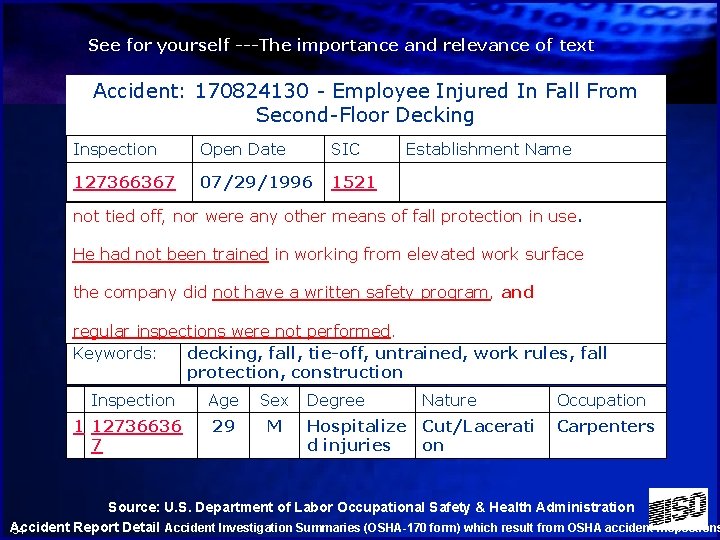
See for yourself ---The importance and relevance of text Accident: 170824130 - Employee Injured In Fall From Second-Floor Decking Inspection Open Date SIC Establishment Name 127366367 07/29/1996 1521 xxxxxxxxxxxx Employee themeans second decking in ofuse. a newly not tied off, #1 norwas wereatop any of other of floor fall protection constructed home, connecting frame work for a wall. He fell 18 ft 6 had in. , not sustaining injuries that required hospitalization. He been trained in working from elevated work surface Employee #1 was not tied off, nor were any other means of fall protection use. had not been trained in working from an the companyindid not. He have a written safety program, and elevated work surface, the company did not have a written safety program, regular inspections were not performed. regular inspectionsand were not performed. Keywords: decking, fall, tie-off, untrained, work rules, fall protection, construction Inspection 1 12736636 7 Age Sex 29 M Degree Nature Hospitalize Cut/Lacerati d injuries on Occupation Carpenters Source: U. S. Department of Labor Occupational Safety & Health Administration Accident Report Detail Accident Investigation Summaries (OSHA-170 form) which result from OSHA accident inspections 34
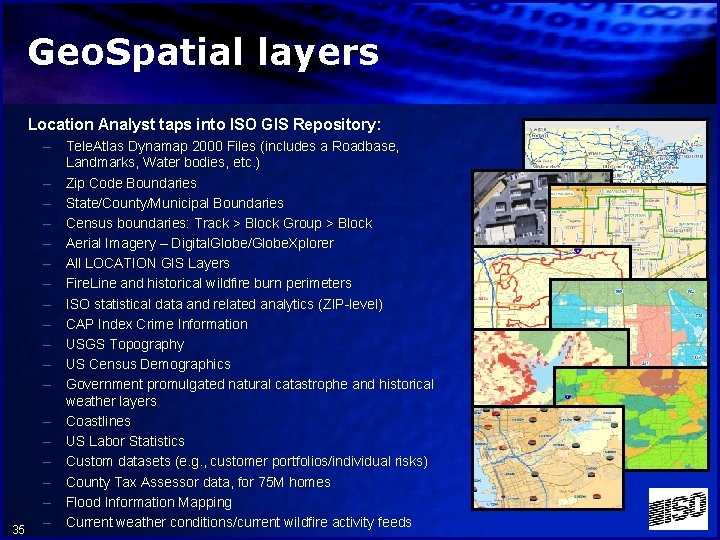
Geo. Spatial layers Location Analyst taps into ISO GIS Repository: 35 – Tele. Atlas Dynamap 2000 Files (includes a Roadbase, Landmarks, Water bodies, etc. ) – Zip Code Boundaries – State/County/Municipal Boundaries – Census boundaries: Track > Block Group > Block – Aerial Imagery – Digital. Globe/Globe. Xplorer – All LOCATION GIS Layers – Fire. Line and historical wildfire burn perimeters – ISO statistical data and related analytics (ZIP-level) – CAP Index Crime Information – USGS Topography – US Census Demographics – Government promulgated natural catastrophe and historical weather layers – Coastlines – US Labor Statistics – Custom datasets (e. g. , customer portfolios/individual risks) – County Tax Assessor data, for 75 M homes – Flood Information Mapping – Current weather conditions/current wildfire activity feeds
What can help? ØIntegration of data with other frauds ØBridging to new data sources ØSmarter transformation of data ØText Mining – expose information ØGIS Platform – geospatial elements ØGraph mining – highlight social networks ØGrid computing – diagonal scaling 36
P&C Personal Lines Situation 37
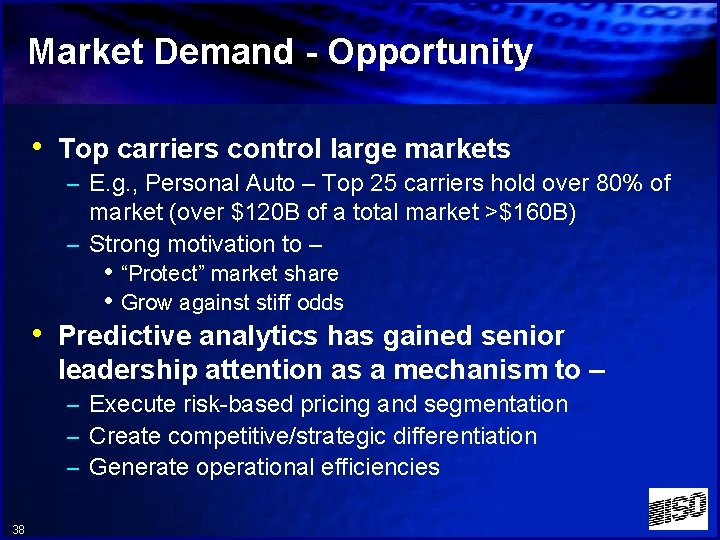
Market Demand - Opportunity • Top carriers control large markets – E. g. , Personal Auto – Top 25 carriers hold over 80% of market (over $120 B of a total market >$160 B) – Strong motivation to – • • “Protect” market share • Grow against stiff odds Predictive analytics has gained senior leadership attention as a mechanism to – – Execute risk-based pricing and segmentation – Create competitive/strategic differentiation – Generate operational efficiencies 38
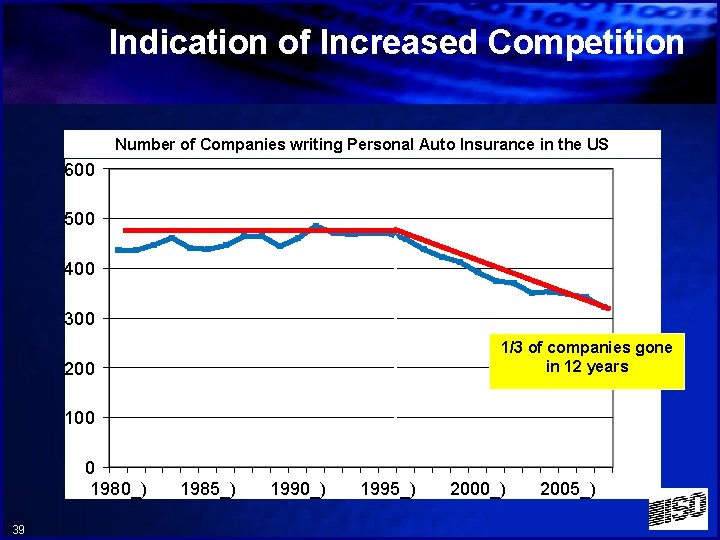
Indication of Increased Competition Number of Companies writing Personal Auto Insurance in the US 600 500 400 300 1/3 of companies gone in 12 years 200 100 0 1980_) 39 1985_) 1990_) 1995_) 2000_) 2005_)
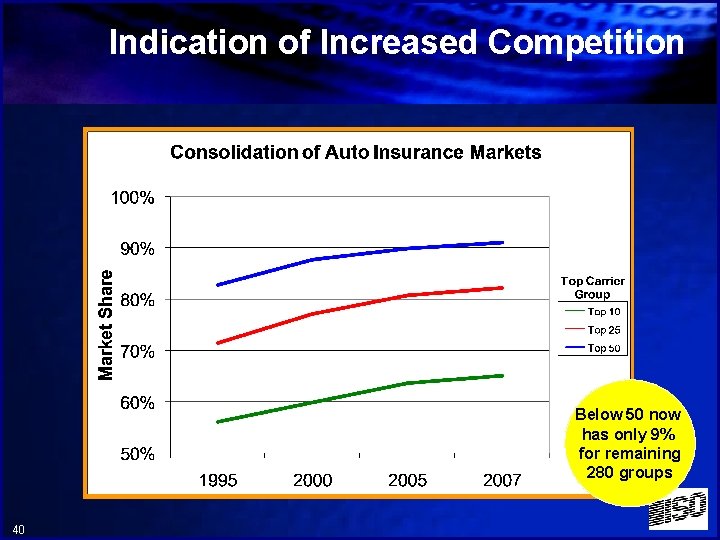
Indication of Increased Competition Below 50 now has only 9% for remaining 280 groups 40
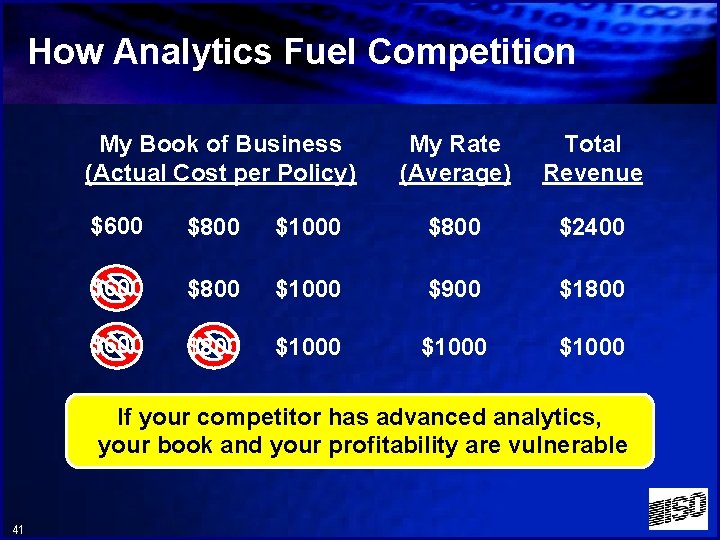
How Analytics Fuel Competition My Book of Business (Actual Cost per Policy) My Rate (Average) Total Revenue $600 $800 $1000 $800 $2400 $600 $800 $1000 $900 $1800 $600 $800 $1000 If your competitor has advanced analytics, your book and your profitability are vulnerable 41
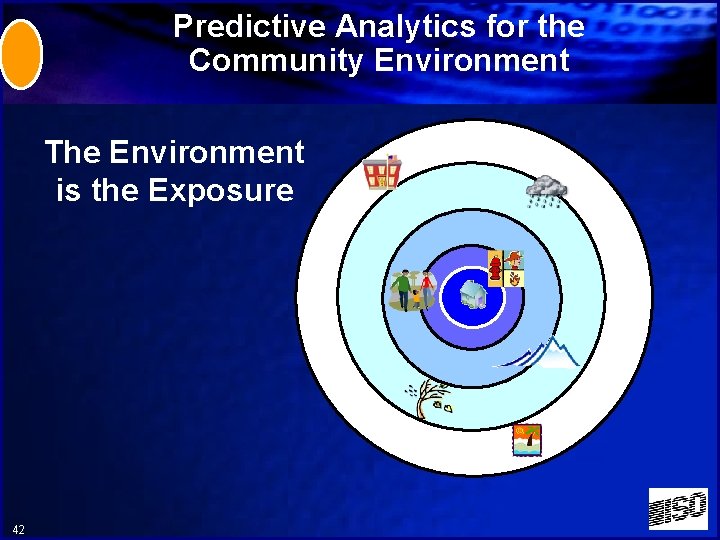
Predictive Analytics for the Community Environment The Environment is the Exposure 42
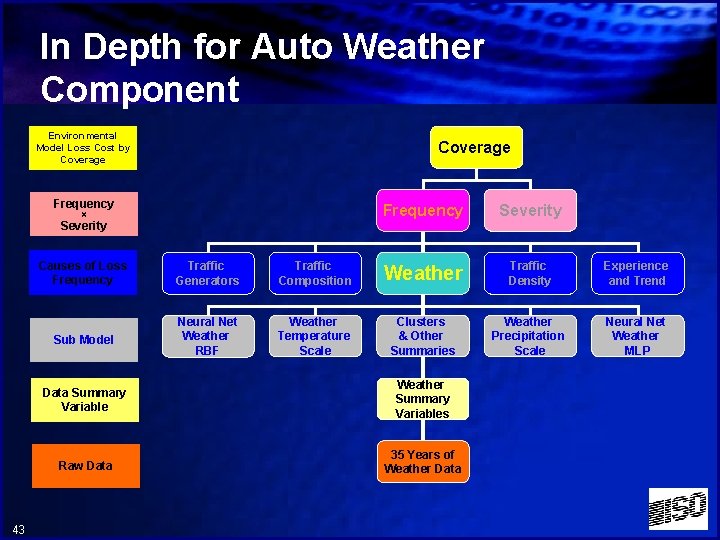
In Depth for Auto Weather Component Environmental Model Loss Cost by Coverage Frequency × Severity 43 Frequency Severity Causes of Loss Frequency Traffic Generators Traffic Composition Weather Traffic Density Experience and Trend Sub Model Neural Net Weather RBF Weather Temperature Scale Clusters & Other Summaries Weather Precipitation Scale Neural Net Weather MLP Data Summary Variable Weather Summary Variables Raw Data 35 Years of Weather Data
Combining Environmental Variables at a Particular Garage Address • Individually, the geographic variables • 44 have a predictable effect on accident rate and severity. Variables for a particular location could have a combination of positive and negative effects.
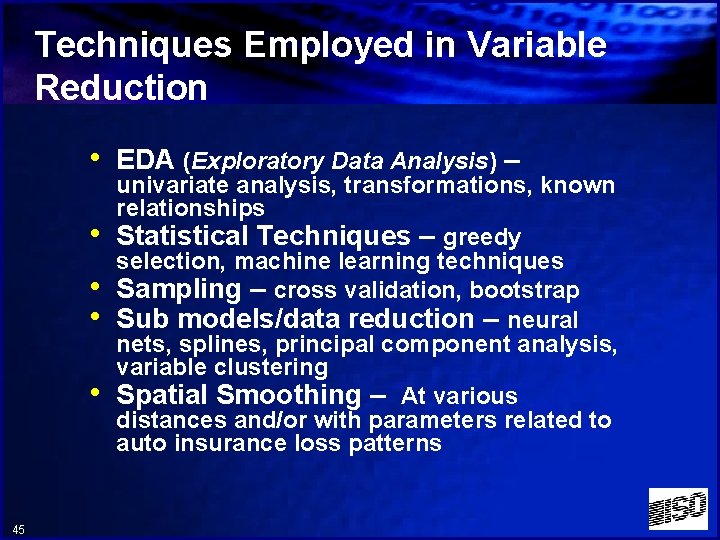
Techniques Employed in Variable Reduction • EDA (Exploratory Data Analysis) – • • 45 univariate analysis, transformations, known relationships Statistical Techniques – greedy selection, machine learning techniques Sampling – cross validation, bootstrap Sub models/data reduction – neural nets, splines, principal component analysis, variable clustering Spatial Smoothing – At various distances and/or with parameters related to auto insurance loss patterns
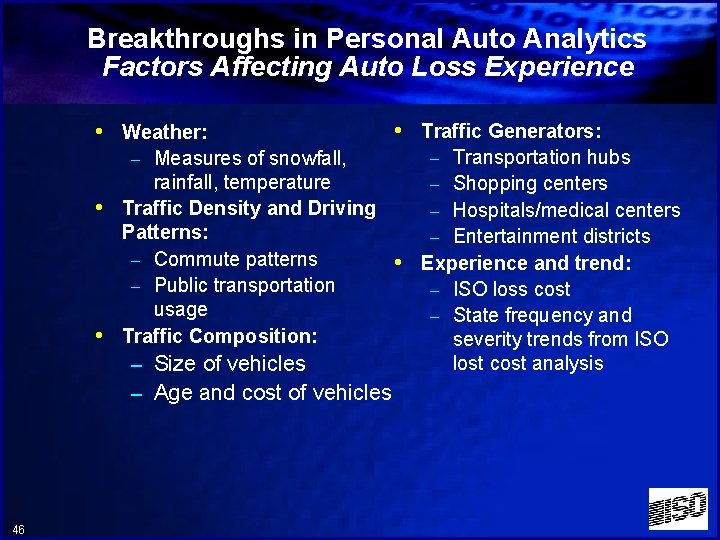
Breakthroughs in Personal Auto Analytics Factors Affecting Auto Loss Experience • Weather: – Measures of snowfall, • • 46 • Traffic Generators: – Transportation hubs rainfall, temperature – Shopping centers Traffic Density and Driving – Hospitals/medical centers Patterns: – Entertainment districts – Commute patterns • Experience and trend: – Public transportation – ISO loss cost usage – State frequency and Traffic Composition: severity trends from ISO lost cost analysis – Size of vehicles – Age and cost of vehicles
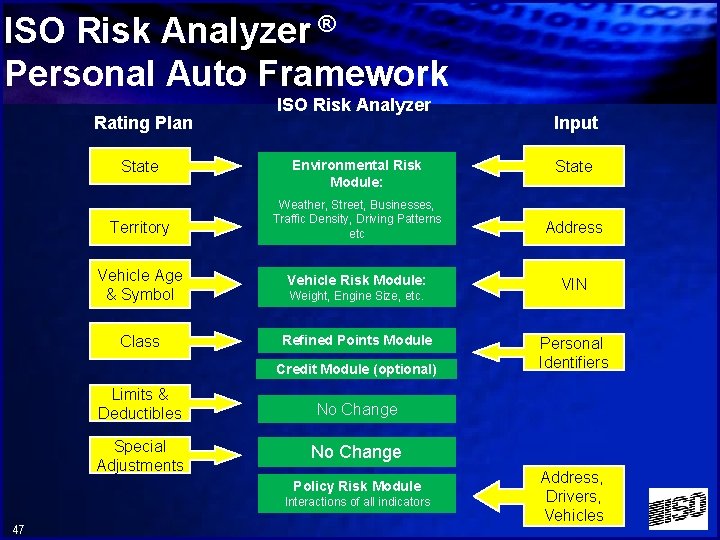
ISO Risk Analyzer ® Personal Auto Framework Rating Plan State ISO Risk Analyzer Environmental Risk Module: State Weather, Street, Businesses, Traffic Density, Driving Patterns etc Address Vehicle Age & Symbol Vehicle Risk Module: VIN Class Refined Points Module Territory Weight, Engine Size, etc. Credit Module (optional) Limits & Deductibles No Change Special Adjustments No Change Policy Risk Module Interactions of all indicators 47 Input Personal Identifiers Address, Drivers, Vehicles
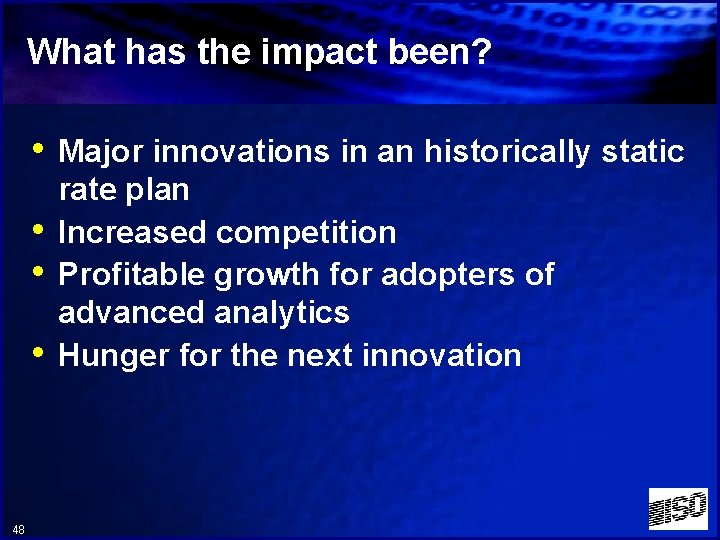
What has the impact been? • Major innovations in an historically static • • • 48 rate plan Increased competition Profitable growth for adopters of advanced analytics Hunger for the next innovation
Good to Great 49
What was Not Working • • Infrastructure impacting work productivity Constant appetite for more “computing” capacity Limited ability to process large datasets Need to build core capabilities – – – – Data access Leveraging multiple modeling methodologies Geo-spatial analysis Managing and maintaining multiple versions of models Text analytics (e. g. cause of loss and entity extraction) Identity resolution ISO Search and Retrieve information • Remote team collaboration is cumbersome • Critical KSA’s sometimes ‘outside’ 50
Next Generation ii. A Systems Analytics Platform – Hardware • Exploring a single large analytics server or a grid solution that ties together many commodity processors • either solution will be a true client/server analytics – Software – SAS Enterprise Miner • Industry standard predictive analytics software suite • Will increase analyst productivity as well as the quality of the final models and documentation • Analytics Data Store – Goal: Professional management of the data used by ii. A for model development and production model scoring – Characteristics • Professional • Scalable • Well-documented 51
Highlights of the Proposed Solution • GRID computing infrastructure – Allows “diagonal” scalability • Add higher-capacity machines to grid to support future growth • Protects and increases “life-span” of investment in hardware – Holy grail of scalable, adaptive, on-demand computing • SAS Enterprise. Miner – Full-function, grid-enabled data mining platform • Extensive suite of data processing and modeling methodologies – One of two top Analytics products in the market – Industry-tested stability and reliability – wide usage • SAS JMP Visual BI – Powerful visualization and visual data exploration software • SAS Model Manager – Seamless management of models – assessing new models, archiving old models, and deploying/using current models in production 52
Highlights of the Proposed Solution • Benefits of choosing SAS – ISO is a long-standing SAS customer (since 1982) • Can leverage loyalty discounts • Known vendor with proven value to ISO • Additional discounts obtained in other SAS licenses (e. g. , Mainframe) – SAS is the most common platform in the industry • Easier to find candidates with SAS/Eminer knowledge and experience – SAS offers comprehensive training (compared to other competitors) • Easier to keep staff on the cutting-edge of new modeling methodologies and business applications 53
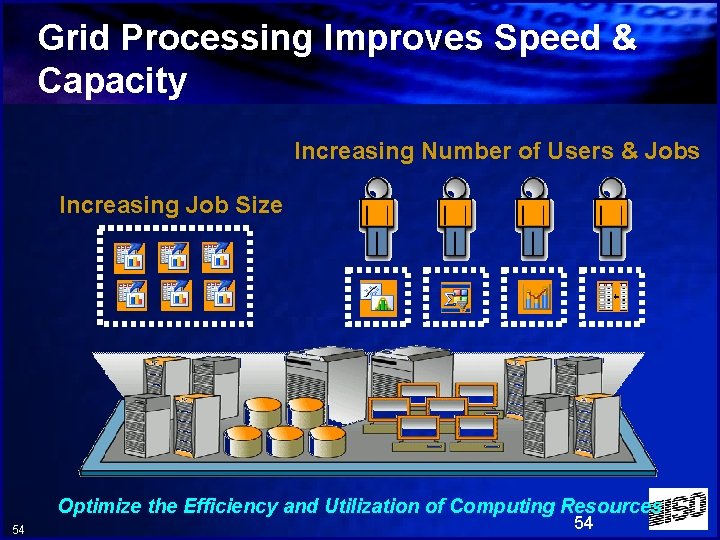
Grid Processing Improves Speed & Capacity Increasing Number of Users & Jobs Increasing Job Size Optimize the Efficiency and Utilization of Computing Resources 54 54
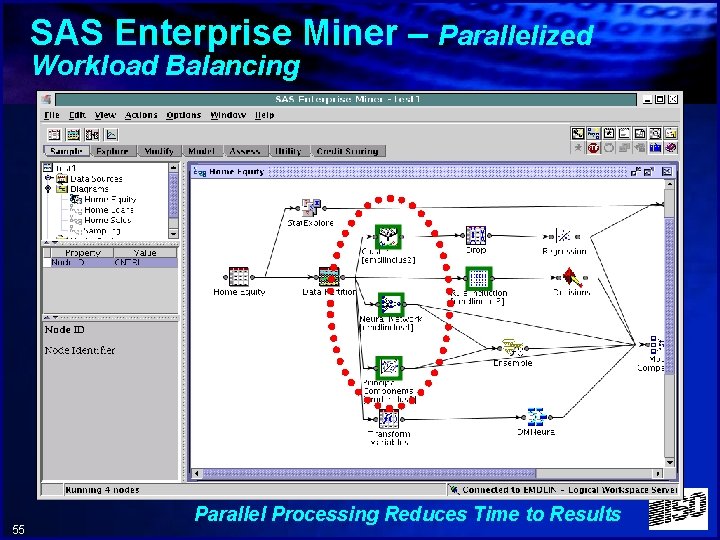
SAS Enterprise Miner – Parallelized Workload Balancing 55 Parallel Processing Reduces Time to Results
Key Benefits of Infrastructure Investment • • 56 Stable, high-availability platform Increased bandwidth for simultaneous users One platform offering multiple tools/methods Build models quicker and fail faster for better models Visualization capabilities will significantly reduce data exploration timelines Model assessment and comparison capabilities built-in – no separate coding necessary Significant risk mitigation in model maintenance and archiving Data warehousing capability will shorten the cycle on re-use of data in other initiatives
Summary • • 57 Centralized, shared environment Dynamic resource allocation to meet peak demand Policies and prioritization for use of resources Run large more complex analysis De-couple applications from infrastructure Ease maintenance of computing infrastructure Improve price/performance with commodity hardware Scale out cost effectively as needs grow
CONCLUSION Why things are becoming so data driven. Why are we really here… More data-savvy Executives Why will we be back here next year… ØEver improving analytic solutions ØIndustry, Third party, and Government Data ØStructured, Unstructured, and Location Data ØFaster, Cheaper, Better – Processors, Storage, & Tools Growing Skill Sets of Staff and Vendors 58

Marty Ellingsworth mellingsworth@iso. com The views expressed by the presenter does not necessarily represent the views, positions, or opinions of ISO. 59
- Slides: 59