SAS EVAAS A Way of Measuring Schooling Influence


 Less useful when")

 By including all students in the analyses, even those")
 SAS EVAAS allows educators to benefit from all tests,")
 With SAS EVAAS methodology, each student serves as his")


- Slides: 51
SAS EVAAS A Way of Measuring Schooling Influence Marty Ward and Dana Wrights Winston-Salem/Forsyth County Schools
SAS EVAAS Unites two respected entities: 1. SAS: a major software company that produces powerful data analysis capabilities SAS is the world’s largest privately held software company.
SAS EVAAS 2. EVAAS is Educational Value-Added Assessment System. EVAAS is based on more than ten years of research by Dr. William Sanders and his colleagues on value-added assessment.
SAS EVAAS was provided to all North Carolina LEAs by the Department of Public Instruction in 2007 -08 Current tests included in EVAAS are End-of. Grade Reading and Math, all End-of-Course subjects, Writing 4, 7, and 10, and SAT (school level only)
What is value-added assessment? It is a different approach to analyzing student achievement data. It is based on the simple notion of following a student’s academic progress over time. By linking each student’s test records from grade to grade over subjects, the influence of the district, school and teacher on the rate of academic progress can be extracted via complex data analysis.
What is value-added assessment? Much of the value-added research looks at the impact of the teacher. Although reports can be made based on teacher, the North Carolina package does not include teacher-level value-added reports. However, the State Board of Education funded the addition of teacher-level reporting.
Value-added Assessment Historically, accountability reporting is based on a “snapshot” of student achievement—proficiency or performance composite. SAS EVAAS methodology extracts information from longitudinally linked student test scores.
Value-added Assessment ABCs growth is the closest available measure to EVAAS ABC growth looks at a student’s past performance a maximum of two tests and “expects” relative performance to be at least as good as in the past EVAAS uses up to 5 years of test scores in every available subject (at least 3 scores) to predict performance
Limitations in Using EVAAS Students’ school is where they were last tested—not re-rostered (at the current time) Another data tool, not perfect Like any good data tool, it is more likely to raise questions rather than provide answers
Limitations in Using EVAAS Less useful for grade 3 (limited data) Less useful when there are small numbers of students • Less reliable estimates • Cannot reasonably disaggregate Scores from alternate assessments not robust enough for use (not included in EVAAS)
SAS EVAAS Advantages The EVAAS methodology minimizes the influence of measurement error by using up to five years of data for an individual student. Analyzing all subjects simultaneously increases the precision of the estimates.
SAS EVAAS Advantages (cont. ) By including all students in the analyses, even those with a sporadic testing history, SAS EVAAS provides the most realistic estimate of achievement available for a district or school.
SAS EVAAS Advantages (cont. ) SAS EVAAS allows educators to benefit from all tests, even though their scales are different. The EVAAS methodology accommodates all tests that: • are reliable • are highly correlated with curricular standards • have sufficient stretch in the reporting scale to measure the achievement of both very low - and very high-achieving students in a grade or subject.
SAS EVAAS Advantages (cont. ) With SAS EVAAS methodology, each student serves as his or her own control, creating a level playing field and eliminating the need to adjust for race, poverty, or other socioeconomic factors. This innovative approach ensures that the results are fair to both student and educators.
EVAAS : Reflecting Back and Looking Forward 1. Students’ score histories are used to provide valuable diagnostic information about past practices. 2. Each student’s previous scores are used to predict success probabilities of numerous academic milestones (future EOG and EOC scores).
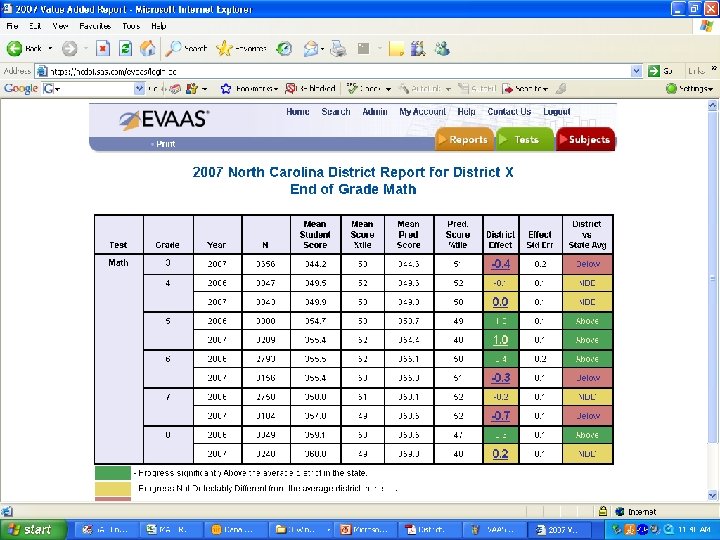
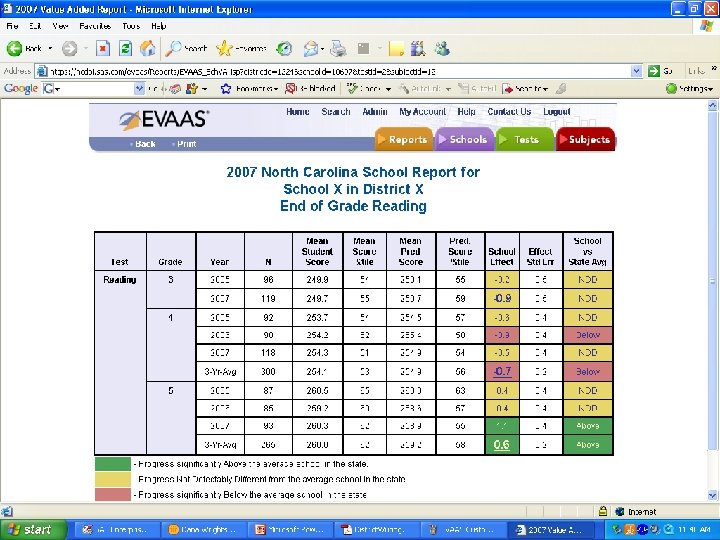
Value-Added Report How effective was the school/district? How much progress did students make compared to the average effectiveness of North Carolina schools?
Value-Added Report This is the main type of EVAAS report. It has the most rigorous statistical standards. The value-added reports are conservative— for a school or district to be labeled as having progress “significantly below” or “significantly above” average progress in the state, it must be 2 standard errors below or above.
Value-Added Report: Utility Given how students were predicted to perform if they received the average North Carolina schooling experience, how effective were we? Pinpoints overall strengths and weaknesses by subject and grade - provides FOCUS
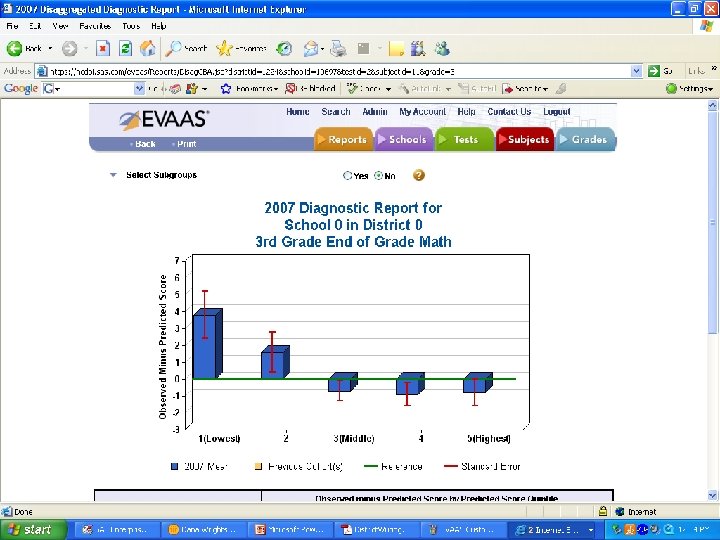
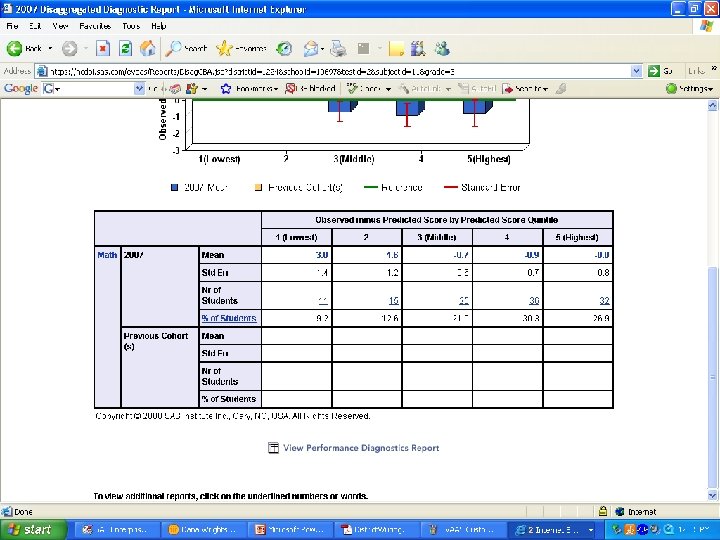
Diagnostic Report Divides students into 5 groups based on how they were predicted to perform. (Quintiles: the bottom 20% in NC, the next lowest 20%, the middle group, and so on). Graphic shows how effective the school/district was with each of the groups. Can also look at subgroups, e. g. ethnic or gender groups.
Diagnostic Report Green line is reference line – the amount of progress students were predicted to make – Bar above the line – students progressed better than average – Bar below the line – students made less than average progress – Red vertical line – 1 standard error above & below
Diagnostic Report: Utility Given the rest of the state as a comparison, how were our students predicted to perform (quintiles)? How did our students actually perform compared to students with similar performance predictions? Were there differences for various subgroups?
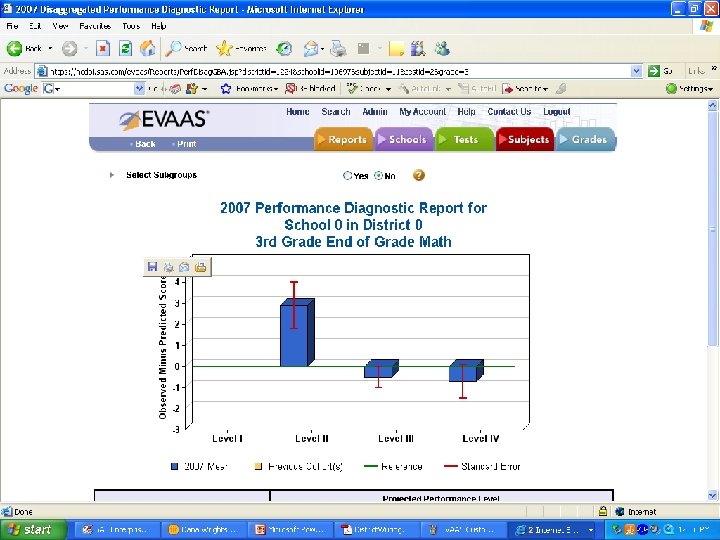
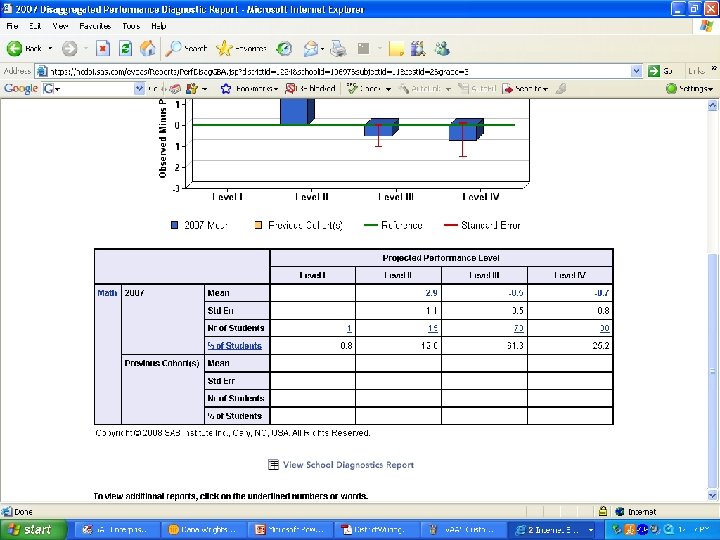
Diagnostic Performance Reports Very similar to Diagnostic Reports, but divides students into predicted Achievement Levels (Level I, III, or IV) Graphic shows how effective the school was with each of the levels. Can also look at subgroups, e. g. ethnic or gender groups.
Diagnostic Performance Report: Utility Given the rest of the state as a comparison, how were our students predicted to perform (via achievement levels)? How did our students actually perform compared to students predicted to perform at the same achievement level? Were there differences for various subgroups?
Diagnostic Reports Utility Drill-down from Value-added – Targets which subgroups and students need the most intervention – Finds success stories – SHOULD NEVER BE USED FOR ACCOUNTABILITY; ONLY FOR DIAGNOSTIC PURPOSES
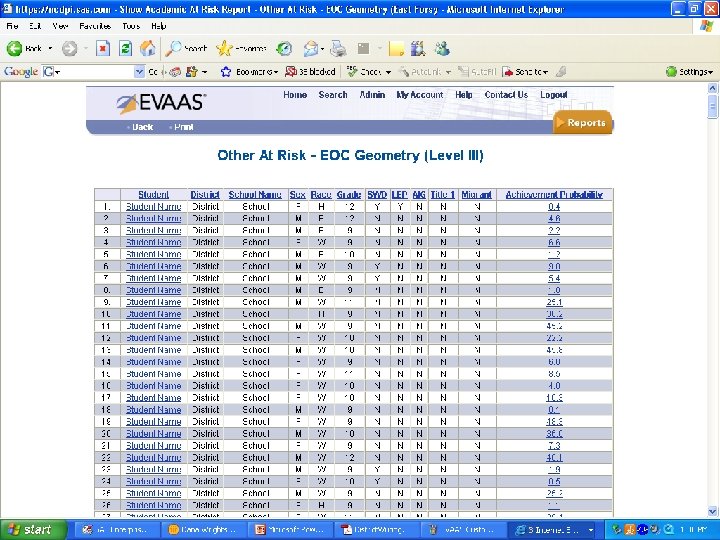
At Risk Reports Students at risk to not be at grade level (AYP At Risk), probability between 0% and 70% for math, 0% to 80% for Reading (because of new standards). Graduation At Risk (0% to 70% for courses required for high school graduation) Other at risk (other EOC tests)
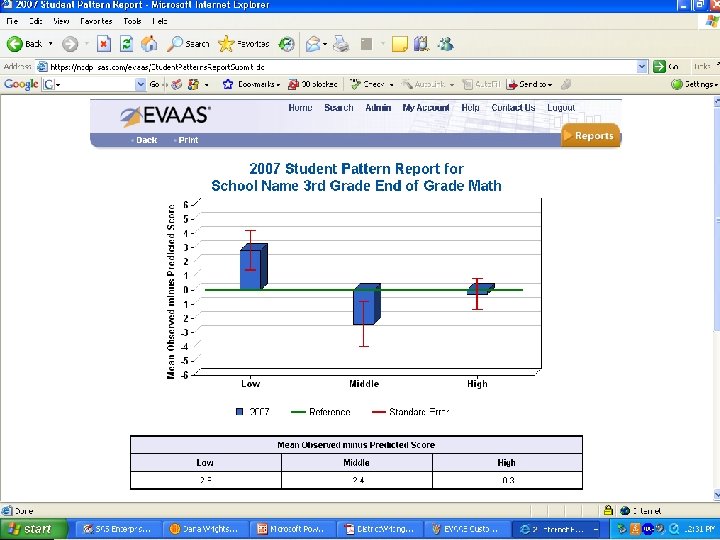
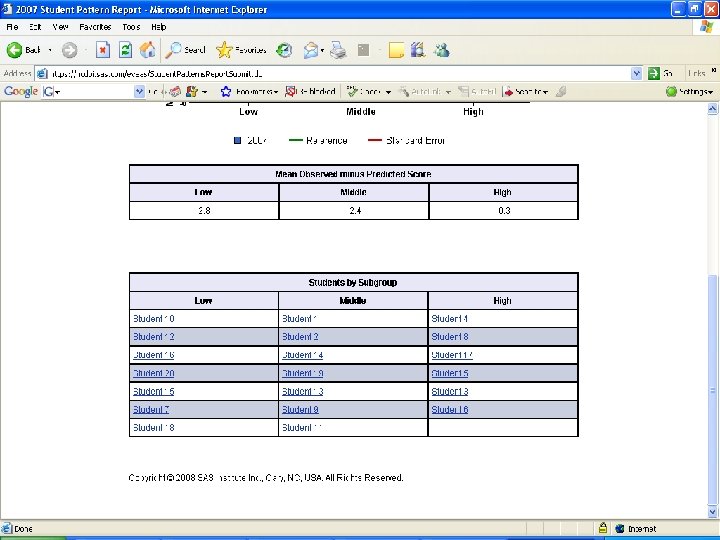
Student Pattern List Provides a list of students based on selected subject, grade, course Allows user to further select a subgroup, if desired Divides the group into thirds (lowest, middle and highest) and estimates effectiveness
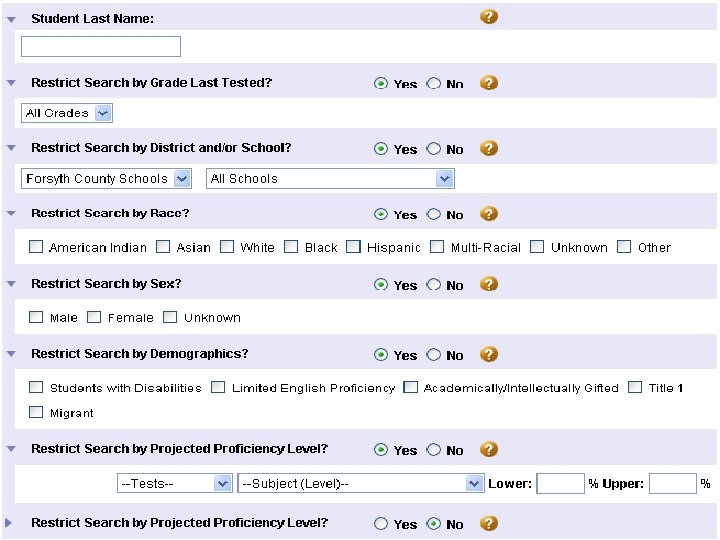
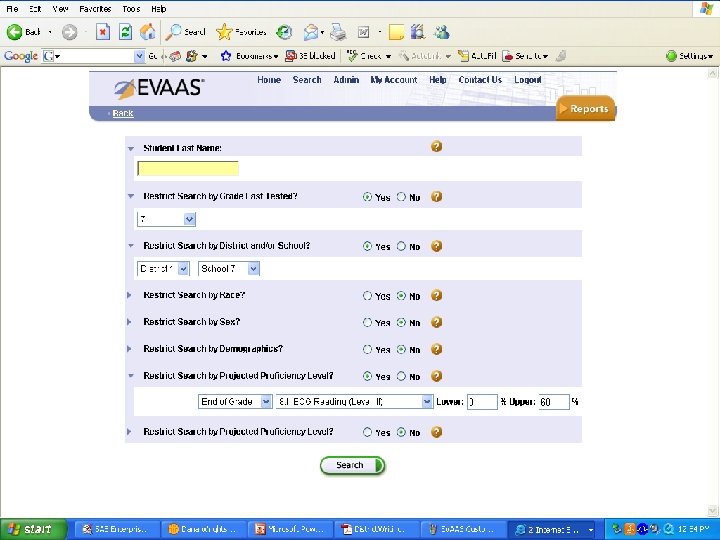
Custom Student Reports Provides ability for user to create and save rosters of user-defined subgroups of students. For example, you can define a group likely to be successful in the next grade or course for planning purposes
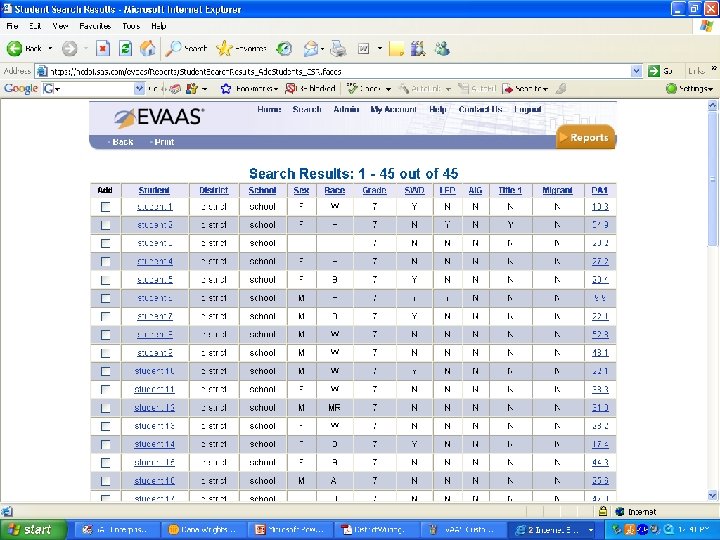
Custom Student Reports Allows a quick search for Individual students Groups by selected characteristics (e. g. gender, ethnic group, LEP, predicted scores) Allows drill down to show 5 years of student percentile scores (compares to school and district)
Custom Reports: Utility Flexibility to build school or teacherlevel reports (last year or possibly current) Sort capabilities can provide: – Prioritized list of need – Quick grouping of AYP groups
Custom Reports: Caution Probabilities are calculated based on the premise that NO INTERVENTION OCCURS beyond the average NC schooling experience Should NOT be treated as a ‘score; ’ simple adjustments to a student’s education plan can make tremendous improvements to probability
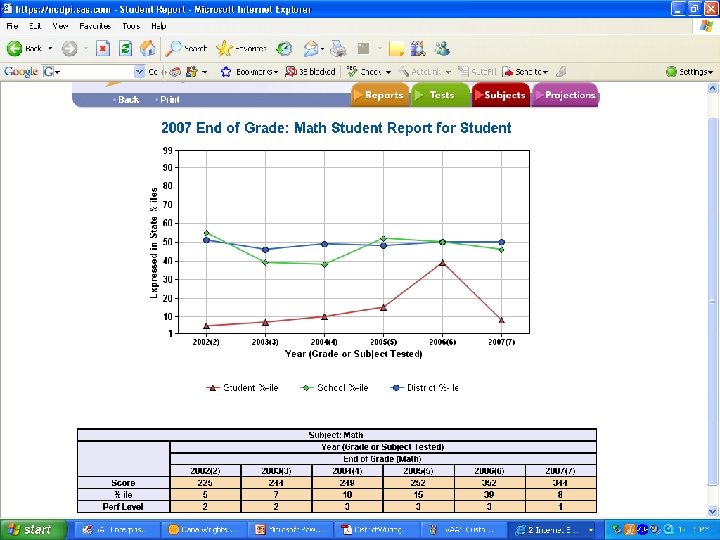
Student Profile Reports Click on a student name: Provides line graph of student’s previous performance in selected subject in terms of percentiles Includes district and school averages for comparison purposes
Student Profile Reports: Utility Quick graphic view of trends Parent conferences Comparison to school and district
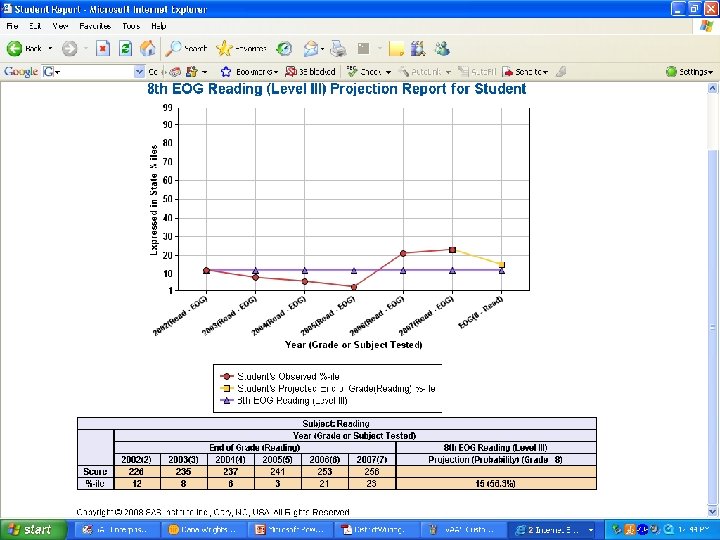
Student Projection Reports Click on a student’s probability: Provides line graph of student’s previous performance in selected subject in terms of percentiles, PLUS a yellow projection line of next test Includes projected proficiency level average percentile for comparison
Student Projection Reports: Utility and Caution Provides student probability of meeting various academic milestones Based on previous performance AND IF NO INTERVENTION OCCURS beyond the average NC schooling experience Caution should be exercised when sharing with student and/or parent – must carefully explain meaning of probability
Things to Remember Use the ‘Help’ Link Don’t let it overwhelm you – Consider this tool an investigative project; you will learn more each time you enter the site Improvements are coming – Some things are difficult to manipulate right now (e. g. , rerostering), but SAS EVAAS is working to improve the site
Things to Remember Best use is a diagnostic tool This is ONE of MANY tools available for evaluating data to improve instruction – Use with other tools to get a clear picture • Goal Summaries • District Assessments • Formative Assessments
WEBSITE: ncdpi. sas. com/evaas/login. jsp