SarcoEndoplasmic Reticulum CalciumATPase 2 Expression as a Tumor


, the slides were")


 showed a")


 by immunohistochemical staining. •")


- Slides: 52
Sarco/Endoplasmic Reticulum Calcium-ATPase 2 Expression as a Tumor Marker in Colorectal Cancer Fu-Yen Chung, MS, Shiu-Ru Lin, Ph. D, Chien-Yu Lu, MD, Ching. Sheng Yeh, Ph. D, Fang-Ming Chen, MD, Jan-Sing Hsieh, MD, Ph. D, Tsung-Jen Huang, MD, Ph. D, and Jaw-Yuan Wang, MD, Ph. D From Kaoshiung Medical University and Chung-Ho Memorial Hospital American Journal of Surgical Pathology‧Volume 30, No. 8, Aug. 2006 Presented by TMUH Int. Hsin-Chih Huang
Introduction • Cytoplasmic calcium acts as second messenger, controlling many different aspects of cellular physiology. • The endoplasmic reticulum (ER) is the principal calcium storage organelle in cells, and one of the most critical determinant of calcium in the ER of most cell types is the activity of sarco/endoplasmic reticulum calcium-ATPase 2 (SERCA 2).
Introduction • SERCA isoforms are encode by SERCA 1, 2, and 3. • The ATP 2 A 2 gene localized on chromosome 12 q 23 -q 24. 1 expressing the SERCA 2 of the calcium pump.
Introduction • The activity of SERCA 2 is an important regulator of normal calcium homeostasis and signaling.
Introduction • Lytton and Mac. Lennan cloned human c. DNAs coding for 2 alternatively spliced products of the cardiac calcium-ATPase gene, SERCA 2 a and SERCA 2 b: – SERCA 2 a is located primarily in the heart and slow-twitch skeletal muscle – SERCA 2 b is present in smooth muscle and non-muscle tissue
Introduction • Alterations in calcium-dependent signaling are involved in cell proliferation and differentiation, apoptosis, and disruption of calcium homeostasis, which have been suggested to contribute to cancer development. • Cell exposure to the SERCA blockade thapsigargin results in the inhibition of cell proliferation, suggesting a potential role in controlling cell growth.
Introduction • Because SERCA 2 gene alterations were found to be closely related to colorectal carcinogenesis from the authors’ results using c. DNA microarray, the authors therefore hypothesize that the SERCA 2 may have a great clinical potential in terms of diagnosis and monitoring CRC patients. (Wang JY, Yeh CS, Tzou WS, et al. Analysis of progressively overexpressed genes in tumorigenesis of human colorectal cancers using c. DNA microarray. Oncology reports, 2005; 14: 65 -72)
Introduction • The authors analyzed the SERCA 2 m. RNA expression between cancerous tissues and the corresponding noncancerous tissues in CRC patients.
Materials and Methods • Patients and samples collection • Total RNA isolation and first strand c. DNA synthesis • Multiplex RT-PCR • Immunohistochemistry • Statistical analysis
Patients and Samples Collection • Tissues were collected from 50 patients: – Sporadic CRC – Surgical resection – Department of Surgery, Kaohsiung Medical University Hospital – Between July 2000 and January 2001 – Written-informed consent
Patients and Samples Collection • 28 men and 22 women • Mean age 64. 4 ± 1. 3 y
Patients and Samples Collection • The criteria of the American Joint Commission on Cancer defined clinical stages and pathologic features: – Stage I – 4 patients – Stage II – 16 patients – Stage III – 24 patients – Stage IV – 6 patients
Patients and Samples Collection • All of the patients were regularly followedup at 3 -month intervals until Sep. 2005 (range 2 to 62 mo, median 34 mo) • Those lost to follow-up or dead from other causes than CRC were regarded as censored data for the analysis of survival rates
Patients and Samples Collection • All of the samples were: – collected immediately after surgical resection – frozen instantly in liquid nitrogen – stored at – 70 °C until analyzed
Total RNA Isolation and First Strand c. DNA Synthesis • Total RNA was extracted from fresh tissue samples of the CRC patients using a QIAamp RNA Blood Mini Kit (QIAGEN Inc, Valencia, CA).
Total RNA Isolation and First Strand c. DNA Synthesis • RNA concentration was determined spectrophotometrically on the basis of absorbance at 260 nm.
Total RNA Isolation and First Strand c. DNA Synthesis • The first strand c. DNA was synthesized from total RNA by using a reverse transcriptasepolymerase chain reaction (RT-PCR) kit (Promega Corp, Madison, WI). • The reaction mixture with RNA were incubated at 42°C for 2 hours, heated to 95°C for 5 minutes, and then stored at 4°C until the analysis.
Multiplex RT-PCR • PCR was performed by using β-actin primers as internal control to correct the differences in total RNA amounts. • Sequences of the PCR primers for SERCA 2 and β-actin were designed according a PCR primer selection program on the basis of primer 3 at http: //frodo. wi. mit. edu/cgi-bin/primer 3_www. cgi (Accessed on January 25, 2005).
Multiplex RT-PCR • The amplification cycles were 20 seconds at 95°C, 20 seconds at 60°C, and 30 seconds at 74°C in a programmable thermal cycler (Primus 25, MWGBIOTECH AG, Ebersberg, Germany). • The cycle was repeated 35 times.
Multiplex RT-PCR • The PCR products were analyzed in 3% agarose gel. • The signals on the ultraviolet transilluminator were scanned with a computing laser densitometer (Alpha Inotech, San-Leandro, CA) to calculate the relative m. RNA density ratio.
Immunohistochemistry • Four-micrometer paraffin sections were immuno stained as described previously. • Five sections of each tumor tissue were stained per case. • Antigen retrieval was done using microwave heating for 10 minutes in 10 m. M citrate buffer (p. H 6. 0). • Each section was dewaxed in xylene and rehydrated with alcohol. • The slides were then incubated in 3%hydrogen peroxide for 5 minutes, to block endogenous peroxidase activity.
Immunohistochemistry • After washing in Tris-buffered saline (p. H 7. 6), the slides were incubated with diluted primary mouse monoclonal antibodies against SERCA 2 (1: 300; Calbiochem, Darmstadt, Germany).
Immunohistochemistry • The primary antibodies were detected using the DAKO LSAB 2 System, and horseradish peroxidase (DAKO Corp, Carpinteria, CA) with biotinylated antimouse Ig. G as secondary antibody. • The reaction was developed with streptavidinhorseradish peroxidase and diaminobenzidine chromogen, and the sections were subsequently counterstained with light hematoxylin.
Immunohistochemistry • To examine the possibility of false positive results, the authors used a nonimmune antiserum instead of the primary antibody as negative control.
Immunohistochemistry • The percentage of positively stained tumor cells was evaluated for each tumor section. • The tumors were considered as positive immunreactive if greater than 5% of the neoplastic cells showed distinct cytoplasm and/or plasma membrane staining. • When 5% or less than 5% were stained, the results were considered negative.
Immunochemistry • Semiquantitative scores were used for SERCA 2 stains according to the percentage of positively stained cells – + indicates <25% – ++, 25% to 50% – +++, 50% to 75% – ++++, >75%
Immunohistochemistry • Cancer tissues that expressed scores of ++, +++, or ++++ were regarded as the high expression group, whereas those with scores of + or negative staining were regarded as the low expression group.
Statistical Analysis • All of the data were analyzed using the Statistical Package for the Social Sciences Ver. 11. 5 software (SPSS Inc. Chicago, IL) • Results were expressed as mean ± SE.
Statistical Analysis • The χ2 test and the student t test were used to compare the clinico-pathologic parameters between the SERCA 2 positive and negative groups. • The overall survival rates were calculated by the Kaplan-Meier method and the differences in survival rates were analyzed by log rank test. • Multivariate analysis of independent prognostic factors was determined using the Cox proportional hazard model.
Statistical Analysis • A probability of P < 0. 05 was considered to be statistically significant.
Results • • • SERCA 2 m. RNA expression Immunohistochemistry Survival rates and multivariate analysis
SERCA 2 m. RNA Expression • 45 of the 50 patients (90%) showed a higher expression level of SERCA 2 m. RNA in the cancerous tissues than in the corresponding noncancerous tissues by RT-PCR • Mean SERCA 2 m. RNA expression level – in cancerous tissues was 0. 63 ± 0. 10 – In the corresponding noncancerous tissue was 0. 31 ± 0. 06 – Significantly higher, P = 0. 001
SERCA 2 m. RNA Expression • Overexpressed SERCA 2 m. RNA was identified in cancerous when compared with noncancerous tissues. – – T indicates cancerous tissues N, noncancerous tissues M, marker β-actin is an internal control
SERCA 2 m. RNA Expression
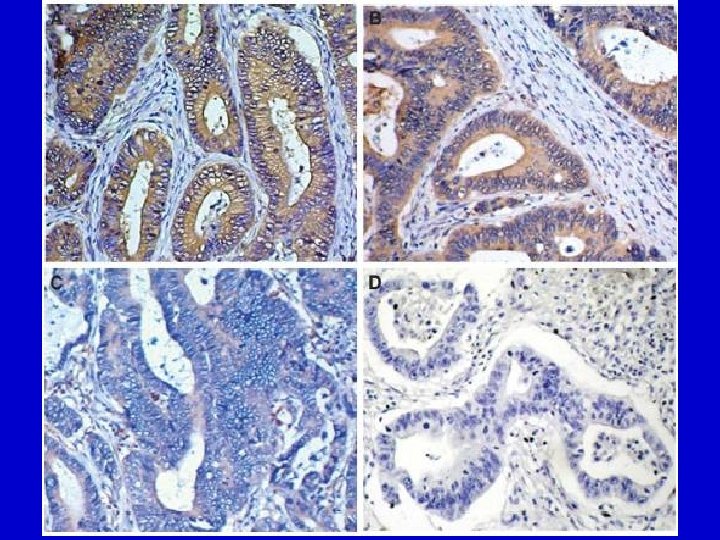
Immunohistochemistry • SERCA 2 antigen was detected in 39 (78%) by immunohistochemical staining. • SERCA 2 was predominantly in expressed in the cancer cells. • All of the positive cases showed brownish cytoplasmic staining but no nuclear staining.
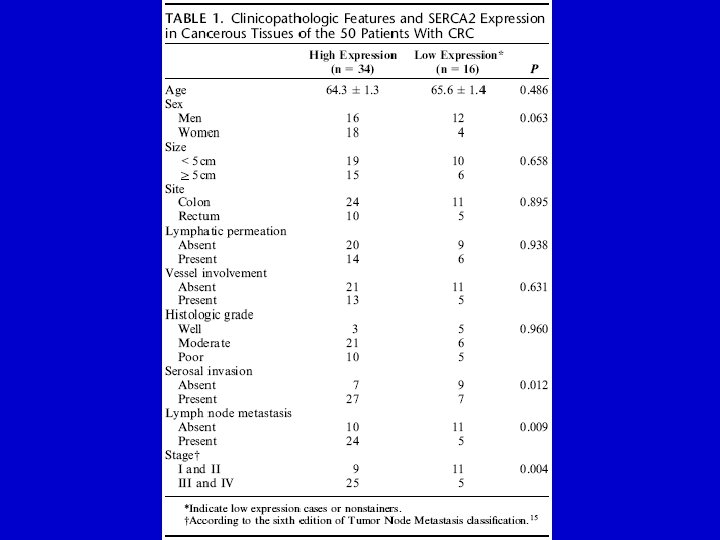
Immunohistochemistry • In the high SERCA 2 expression group: – The incidence of serosal invasion (27/34, 79. 4%) was significantly higher (P = 0. 012) than in the low expression group (7/16, 43. 8%). – The incidence of lymph node metastasis (24/34, 70. 6%) was considerably higher (P = 0. 009) than in the low expression group (5/16, 31. 3%) – The incidence of advanced stage cancer (according to Tumor Node Metastasis classification) (25/34, 73. 5%) was significantly higher (P = 0. 004) than in the low expression group (5/16, 31. 3%)
Survival Rates and Multivariate Analysis • The overall survival rate for the high SERCA 2 expression group was significantly lower than that of the low SERCA 2 expression group.
Survival Rates and Multivariate Analysis • Table 2 showed that the independent prognostic factors identified by multivariate analysis were tumor stage (P=0. 015) and SERCA 2 expression (P=0. 018).
Survival Rates and Multivariate Analysis • SERCA 2 antigen staining was further identified to be a significant and powerful prognostic indicator in patients with CRC.
Discussion • The result of the current study indicated that in CRC patients, SERCA 2 m. RNA is more frequently overexpressed in cancer tissues than in noncancerous tissue
Discussion • Calcium mobilization from the ER into the cytosol is suggested to be a key component of several signaling network controlling tumor cell growth, differentiation, or apoptosis. • Refilling of calcium into the ER from the cytosol by active ATP-driven ion transport is ensured by SERCA enzymes. • SERCA enzymes that accumulate calcium in the ER, and the subsequently anomalous calcium homeostasis may play an important role in neoplastic transformation.
Discussion • The intracellular calcium homeostasis becomes progressively anomalous during colon carcinogenesis, as reflected by deficient SERCA 3 expression. • SERCA 3 expression is barely detectable in moderately differentiated tumors, and is undetectable in poorly differentiated adenocarcinoma of the colon. • SERCA 3 constitutes a vital process in the development of CRC, and is a new and potentially useful marker for the study of the state of differentiation of CRC.
Discussion • In contrast to SERCA 3 analysis from other previous studies, the SERCA 2 expression levels in the current work are not significantly related to cell differentiation by histological examinations.
Discussion • The inactivation of the SERCA 2 gene is a frequent and early event during carcinogenesis in some cancers and that loss of its expression may be regulated partly by an epigenetic mechanism via promoter methylation. • The inactivation of SERCA 2 gene result in impaired uptake of cytosolic calcium into the ER and consequent disruption of calcium signaling, causing Darier disease, an autosomal-dominant skin disorder characterized by loss of cellular adhesion, proliferation, and abnormal keratinization.
Discussion • SERCA 2 is up-regulated in CRC, which may result in the disturbance of calcium homeostasis through increasing the ER calcium uptake.
Discussion • High SERCA 2 protein expression is considerably correlated to serosal invasion, lymph node metastasis, advanced tumor stage, and poor actual overall survival. • SERCA enzyme-dependent intracellular signaling pathways may ensure this metastatic process. • The induction of SERCA 2 protein expression may participate, at least in part, in the progression of CRC.
Discussion • The insulin growth factor-induced prostate cancer cell proliferation through increasing calcium concentration within the ER, and tumor necrosis factor-α reduced cell proliferation and induced apoptosis by decreasing calcium concentration within the ER.
Discussion • The characteristics of the increased refilling of the ER calcium store and its consequent influence on store-operated calcium influx in one possible explanation. • Treatment of head and neck squamous cell carcinoma using the calcium influx inhibitor would inhibit cell growth and invasion in vivo.
Discussion • Overall, the authors’ results indicated that: – SERCA 2 m. RNA was overexpressed in CRC tissue – High SERCA 2 expression level were correlated with: • serosal invasion • lymph node metastasis • advanced tumor stage • poor prognosis – The potential role for SERCA 2 expression level as a new prognostic biomarker for CRC
Thanks for Your Attention!! Presented by TMUH Int. Hsin-Chih Huang