Sandra Burke Bailey Hanson Christopher Seeger and Biswa

Sandra Burke, Bailey Hanson, Christopher Seeger, and Biswa Das Iowa State University Extension and Outreach Staff Professional Development October 20, 2015

What you can find on the Indicators Portal • Data on many Topic and Subject Areas • Tools for Designing Graphs and Maps • Data for Decision Makers County and Region Profiles • Access to City Government Finance Data (IGFI) • Reports on Data Trends and Topics of Interest • Educational Materials on Data Measures and their Use

Step 1. * http: //indicators. extension. iastate. edu *Works best with Google Chrome or Mozilla Firefox

Step 2: Login ISU Net-ID or guest account

Login Screens

Step 3: Choose Geography Settings
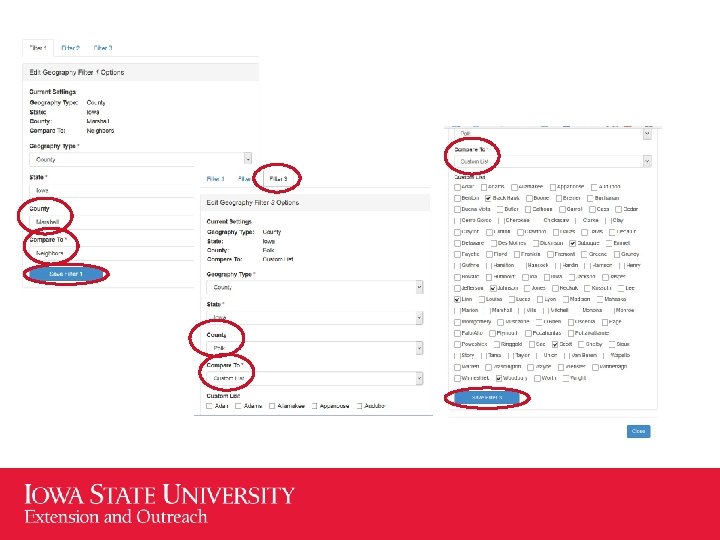

Hover pointer over “Filter” to see geography settings

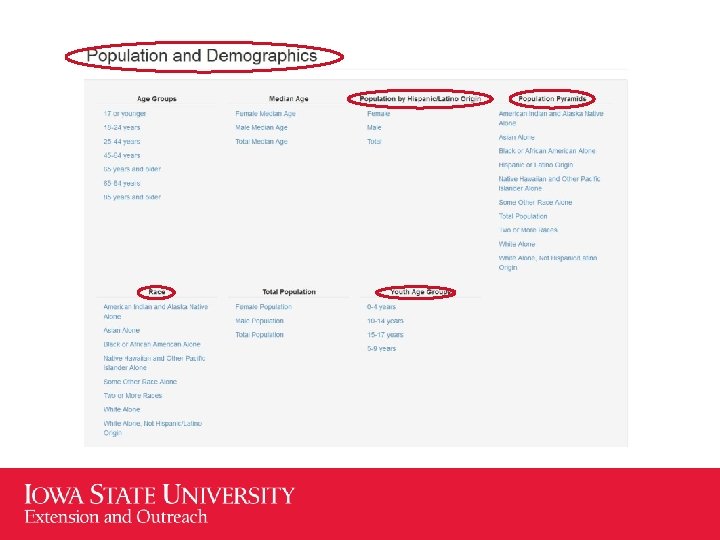
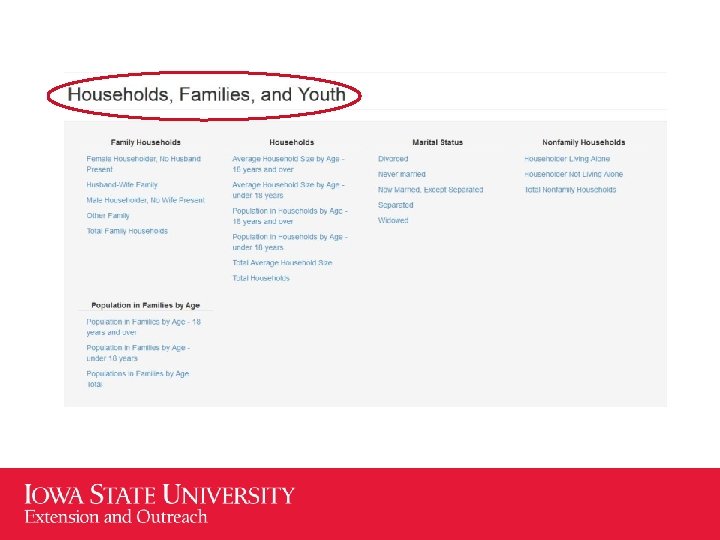
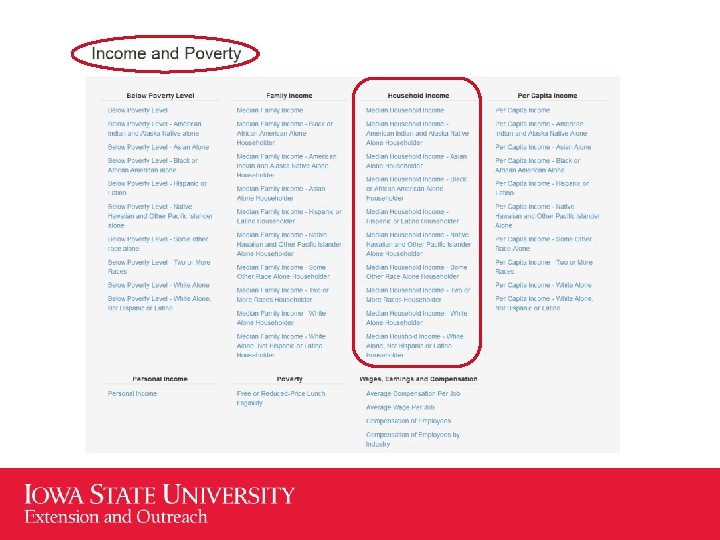
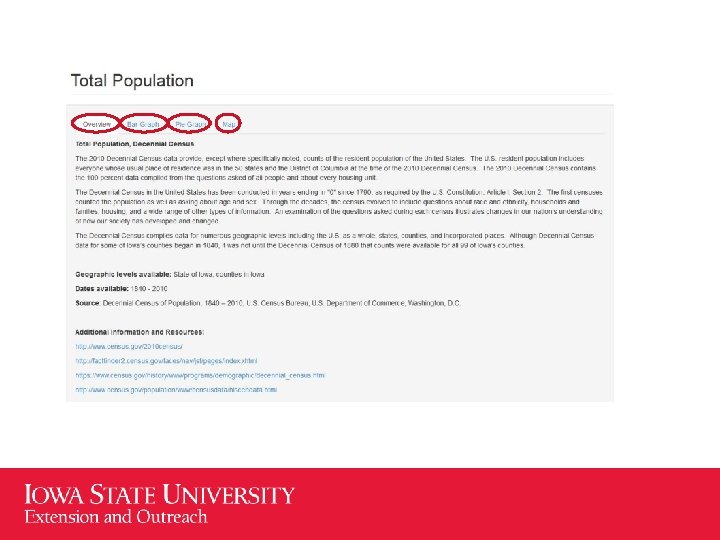
Step 4: Choose Indicators

Other Indicators • Educational Attainment • School Enrollments • Employment, Unemployment • Means of Transportation to Work • Housing Units, Owner, Renter • Housing Value, Rent

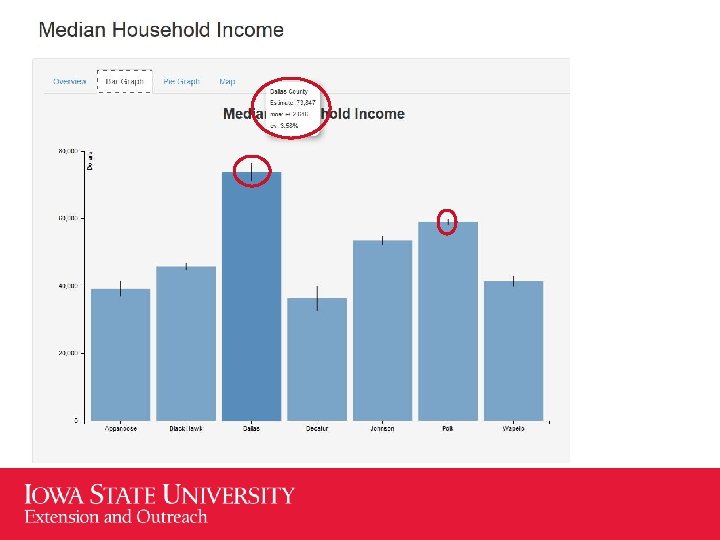
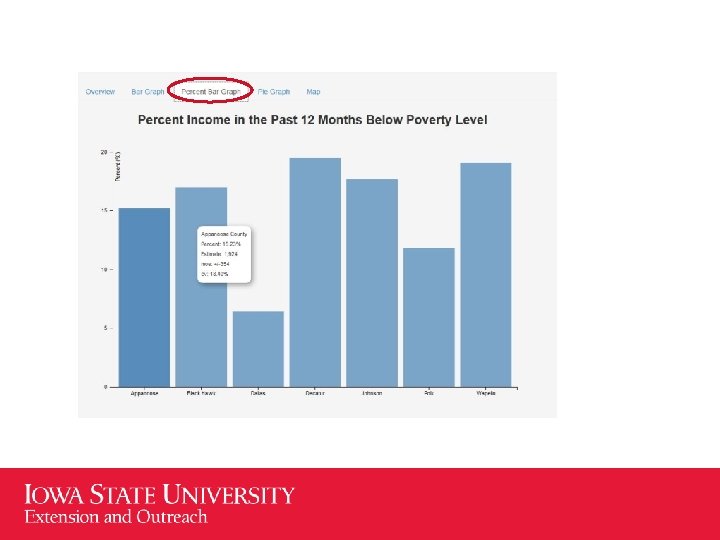
Bar and Pie Graph Examples – Marshall County and Neighbors

Bar and Grouped Bar Graph Examples – Race and Minorities* *Hispanic or Latino Origin is an ethnic group and can be of any race

Grouped Bar Graph Example – Age Groups

Youth Age Group Graph Examples – Total and Minorities* *Hispanic or Latino Origin is an ethnic group and can be of any race

Population Pyramid Examples – White, Not Hispanic and Hispanic
 • Comprehensive set of socioeconomic characteristics • A large, continuous,")
American Community Survey (ACS) • Comprehensive set of socioeconomic characteristics • A large, continuous, monthly, sample survey of housing units (households) • Replaces the decennial census sample portion, “long” form • characteristics of population and housing (not counts) • estimates of characteristics, some uncertainty • Now where we get social, economic, and detailed housing information

American Community Survey – New Things • Period Estimates – 2013 is most recent year of data • 1 year (pooled 12 months) 2006 onward to 2013 • 5 year ( pooled 60 months) 2009 -2013 • Margins of Error (MOE) • Because from a sample, uncertainty • smaller or larger • Estimate +/- margin of error (90% confidence interval) • Always report margins of error

Evaluate Margins of Error • When are they too big to use? ? • Relative size of the error to the size of the estimate • A few can just “eyeball, ” they look bad, are really large • Correct method – calculate Coefficient of Variation (CV) • The Indicators Portal calculates CVs!!!
: Relative amount of sampling error associated with a sample estimate")
Coefficient of Variation (CV): Relative amount of sampling error associated with a sample estimate • CV = (Standard Error/Estimate) * 100% or • CV = ((MOE/1. 645) / Estimate) * 100% high reliability = CV <= 12% - 15% medium reliability = CV 15% - 30% low reliability = CV > 30% - 40% Think about not using

Cautions for small subgroup populations!!!

Map Example – Female Median Age

County-to-County Comparisons with pop-ups – Hispanic Population

Map Example – Marital Status, Never Married

Map Example – Household Type Female Householder, No Husband Present

Map Example – Educational Attainment Bachelor’s Degree

Map Example – Per Capita Income

Data Tools – Custom Maps

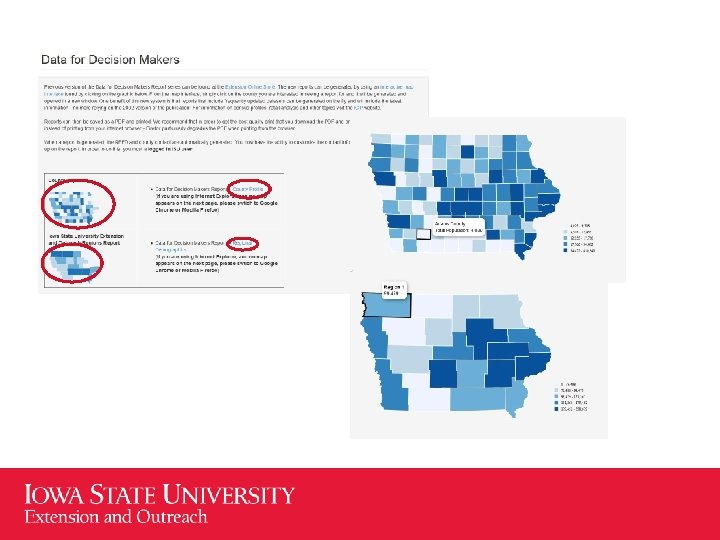
Data for Decision Makers

ONLY ISU logged in staff will see this contact editor screen!

County Profile Page 1

County Profile Page 2

County Profile Page 3

County Profile Page 4

Extension Region Profile Page 1

Extension Region Profile Page 2

Iowa Government Finance Initiative http: //igfi. extension. iastate. edu Biswa Das Cindy Kendall

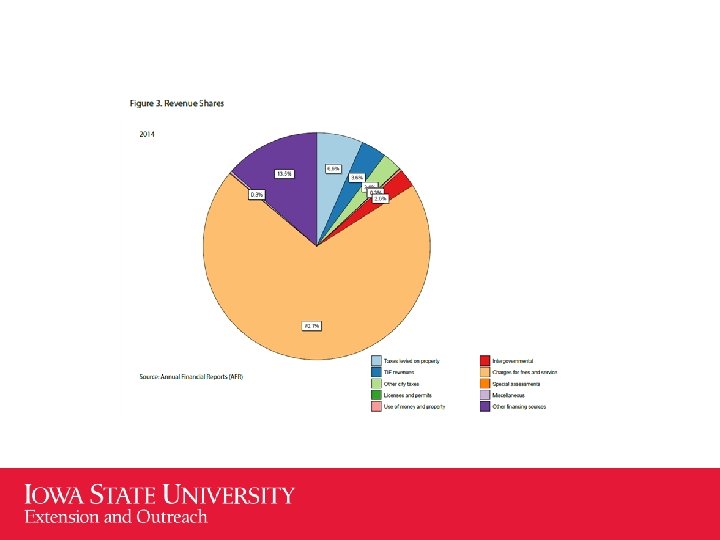
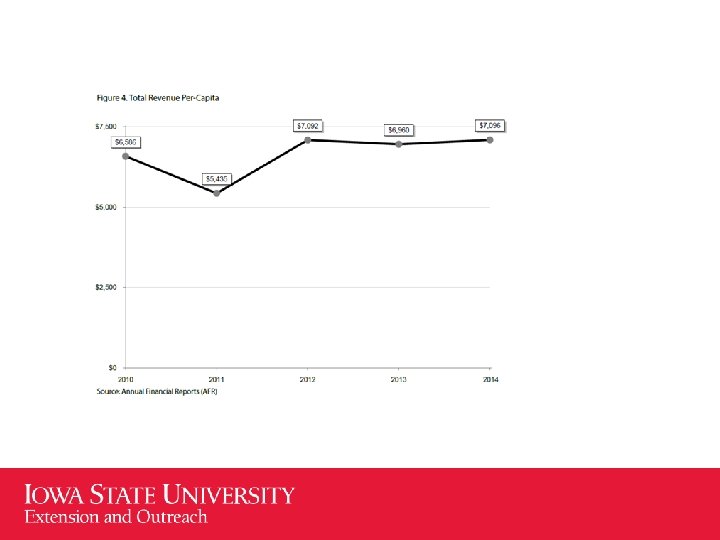
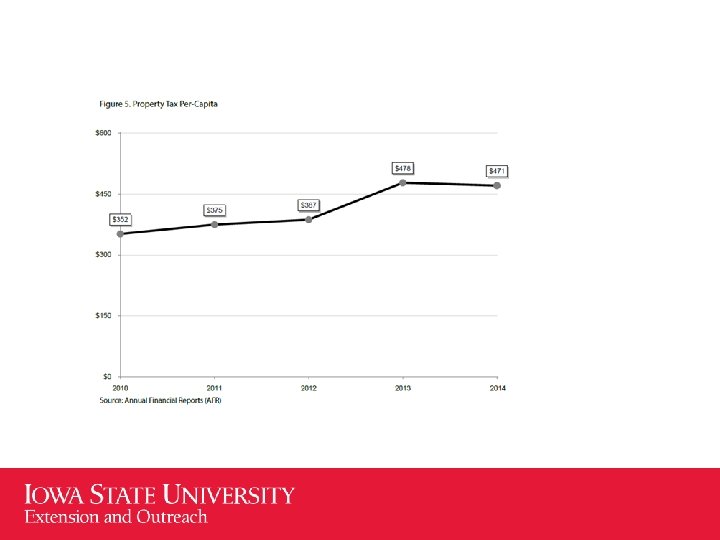
Each report has these sections: • Legislative Updates • Indicators ––Socioeconomic Conditions ––Revenue ––Expenditures • Implications and Discussion

http: //goo. gl/forms/xa. DYTx. Iz. QB

Thank you indicators. extension. iastate. edu Information email: indicators@iastate. edu Tweet to: @ISUExtension. IP Indicators Portal Page: http: //goo. gl/forms/xa. DYTx. Iz. QB Christopher J. Seeger cjseeger@iastate. edu 515 -509 -0651 Bailey Hanson Biswa Das bahanson@iastate. edu bdas@iastate. edu 515 -520 -1436 515 -509 -9603 Sandra Burke scburke@iastate. edu 515 -294 -9307
- Slides: 49