Sampling Theory and Some Important Sampling Distributions parameters
。 • A")
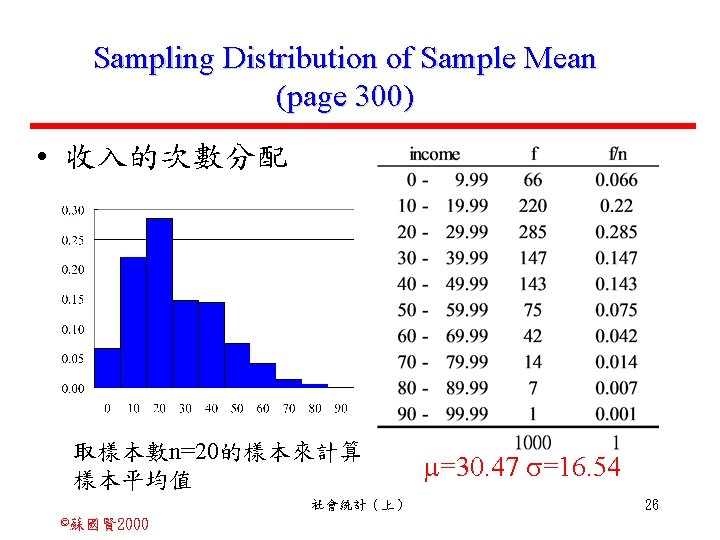
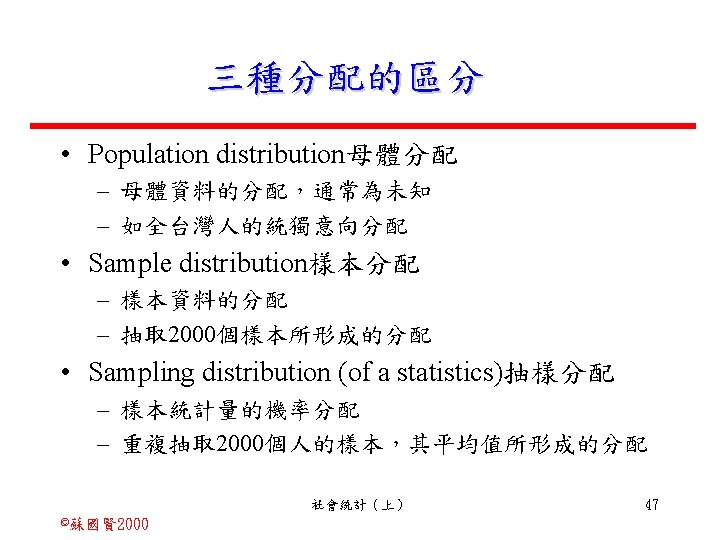
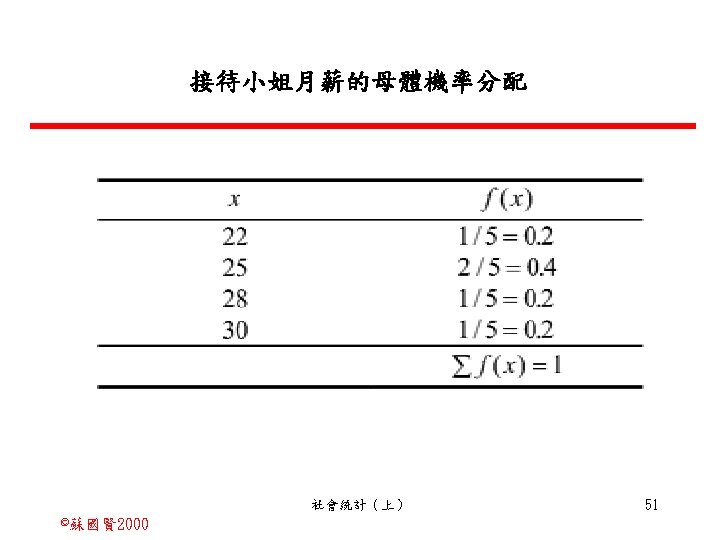
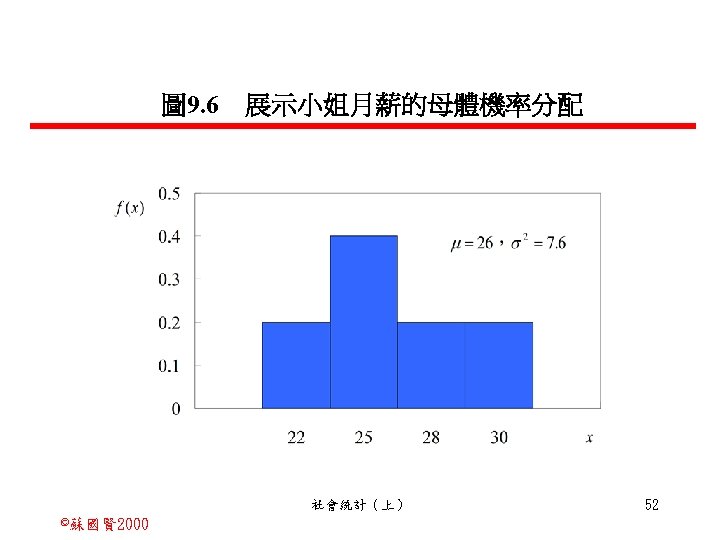
Sampling Theory and Some Important Sampling Distributions 觀 念 • 統計主要問題在於如何透過樣本的統計量來 推估或檢證母體的參數(parameters)。 • A parameter is a numerical quantity that describes some characteristics of a population. 參數為描述母體某些特性的數值。 • 如μ、σ、母體中位數等皆為參數。 社會統計(上) ©蘇國賢 2000 1
是樣 本的函數 Population 母體參數 Sample樣本平均數 隨機變數 x 354")
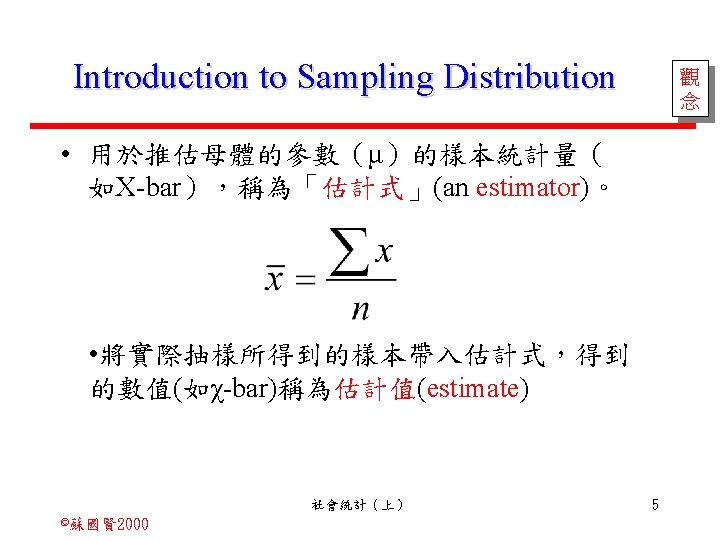
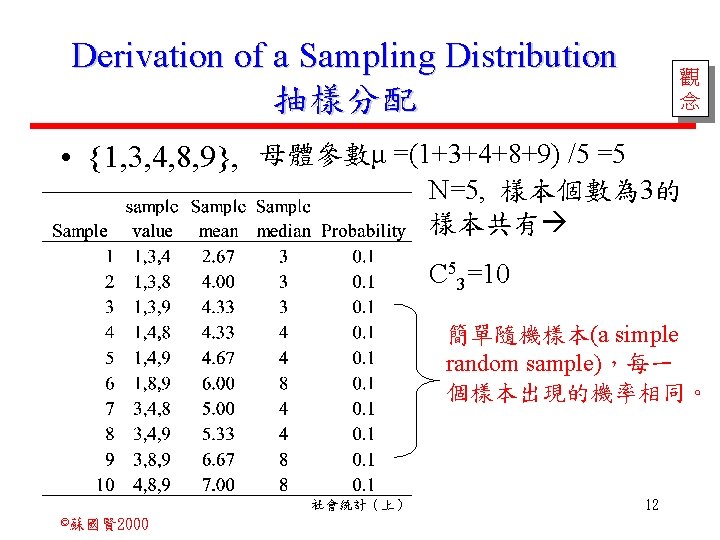
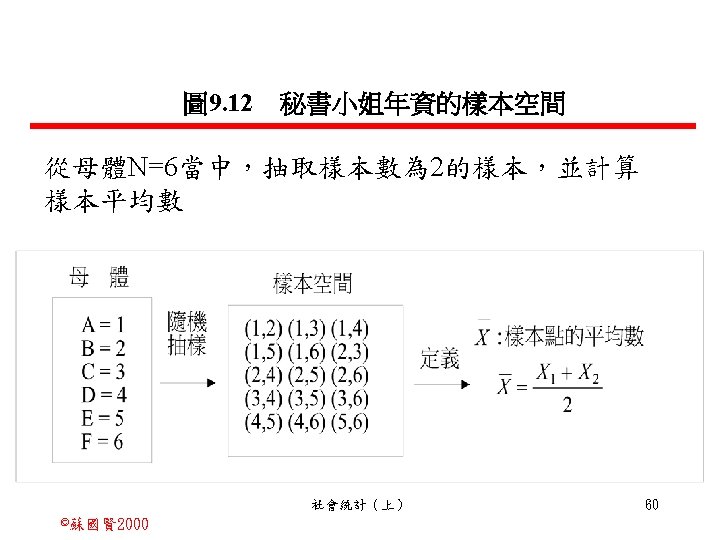
Introduction to Sampling Distribution • 一個樣本的統計量( 如樣本平均數)是樣 本的函數 Population 母體參數 Sample樣本平均數 隨機變數 x 354 x 103 x 41 x 49 x 31 x 4 x 1005 x 411 x 42909 社會統計(上) ©蘇國賢 2000 觀 念 的特定值 4

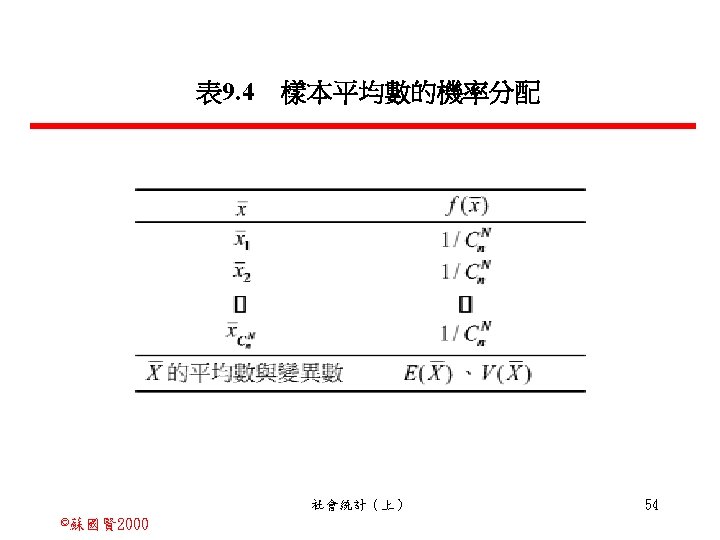
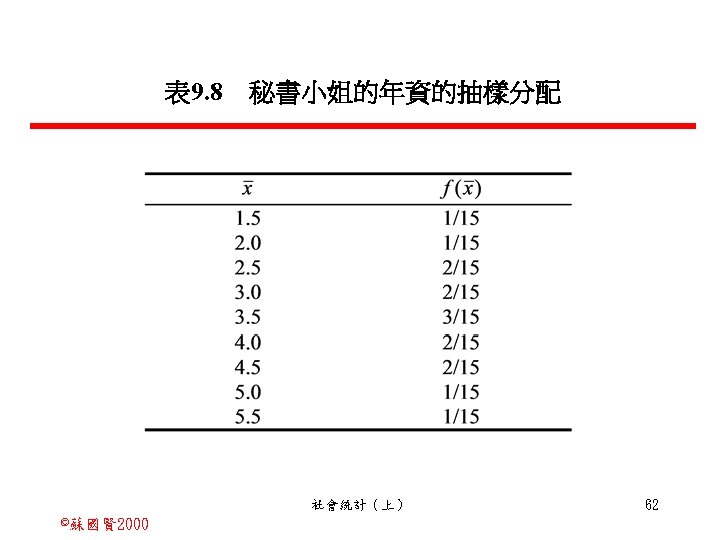
Sampling distribution抽樣分配 觀 念 • A sample statistics is a random variable whose possible values vary from sample to sample. Thus, the sample statistics follows a probability distribution. This probability distribution is called the sampling distribution of the sample statistics. • 樣本的統計量為一隨機變數,每一個特定變 量出現的機率不同,因此,樣本統計量為一 機率分配,稱為樣本統計的抽樣分配 (sampling distribution),為多次抽樣結果的機 率分佈。 社會統計(上) ©蘇國賢 2000 7

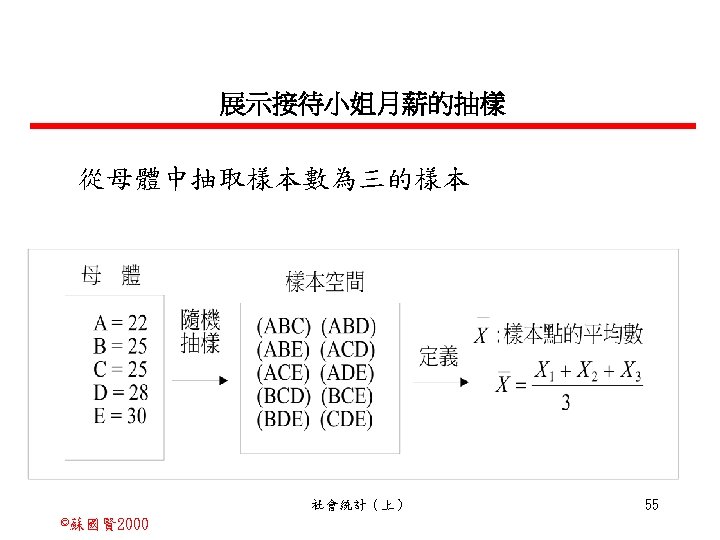
Derivation of a Sampling Distribution 抽樣分配 Sampling distribution of sample mean Sampling distribution of sample median 樣本平均數 的抽樣分配 社會統計(上) ©蘇國賢 2000 觀 念 樣本中位數 的抽樣分配 14
 and E(M) Sampling distribution of the sample mean Sampling distribution of the")
Calculating E(X) and E(M) Sampling distribution of the sample mean Sampling distribution of the sample median 社會統計(上) ©蘇國賢 2000 觀 念 19

Biased and unbiased estimators Unbiased estimator. Biased estimator of Sampling distribution of B Sampling distribution of A E(A ) E(B ) Bias of B 社會統計(上) ©蘇國賢 2000 20

Relative Efficiency • Let A and B be two unbiased estimators of some population parameter. The relative efficiency of A with respect to B is the ratio of their variances; that is; • The estimator A is said to be more efficient than B if Var(A) < Var(B) 社會統計(上) ©蘇國賢 2000 23
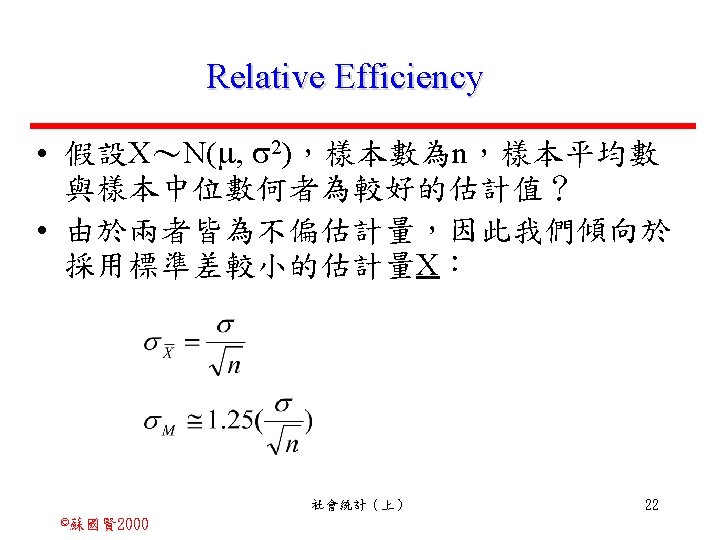
 Sampling distribution of X Sampling distribution of M")
Relative Efficiency • 假設X~N( , 2) Sampling distribution of X Sampling distribution of M E(X) = E(M) =μ 社會統計(上) ©蘇國賢 2000 24

Minimum Variance Unbiased Estimator • An estimator A is a minimum variance unbiased estimator of if A is an unbiased estimator of AND if no other unbiased estimator has a smaller variance. 社會統計(上) ©蘇國賢 2000 25
=30. 47 Sx=2. 573 =30. 47 =16. 54")
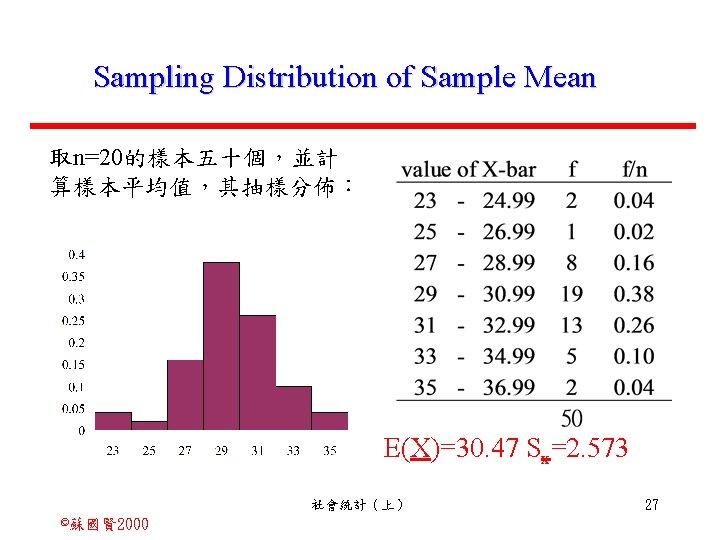
Sampling Distribution of Sample Mean 抽樣分配較原分配接近常態分配 E(X)=30. 47 Sx=2. 573 =30. 47 =16. 54 社會統計(上) ©蘇國賢 2000 28
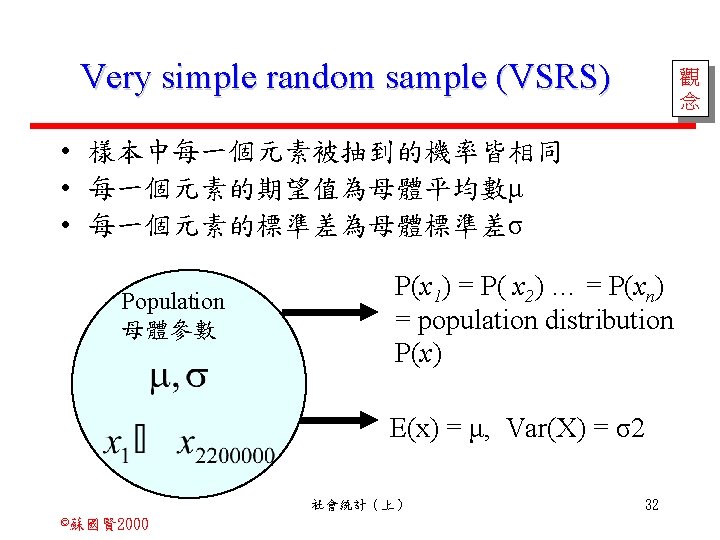
 觀 念 A very simple random sample is a")
Very simple random sample (VSRS) 觀 念 A very simple random sample is a sample whose n observations x 1, x 2, …xn are independent. The distribution of each X is the population distribution p(x): that is P(x 1) = P( x 2) … = P(xn) = population distribution P(x) Then each observation has the mean μ and standard deviation σof the population. E(x) = μ, Var(X) = σ2 社會統計(上) ©蘇國賢 2000 30

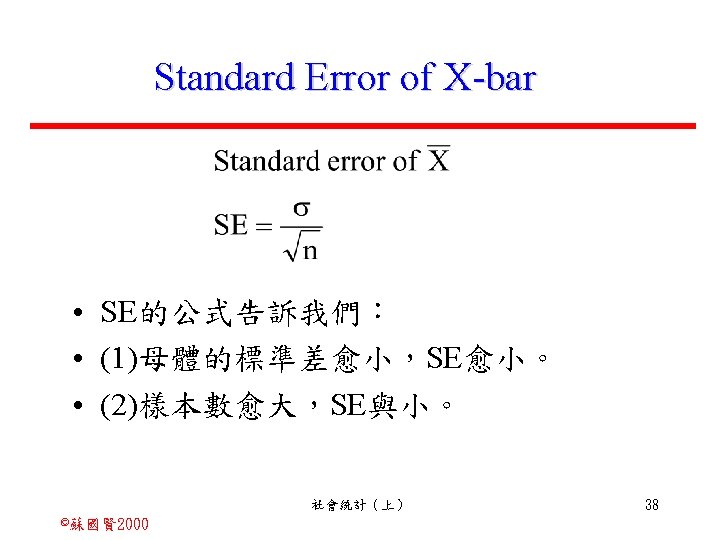
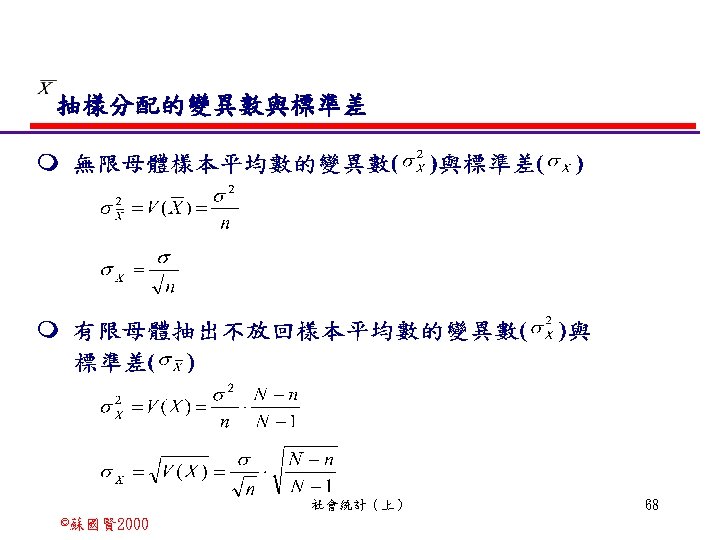
Standard Error of X-bar • The typical deviation of X from its target u represent the estimate error, and so it is commonly called the standard error, or SE: 社會統計(上) ©蘇國賢 2000 35

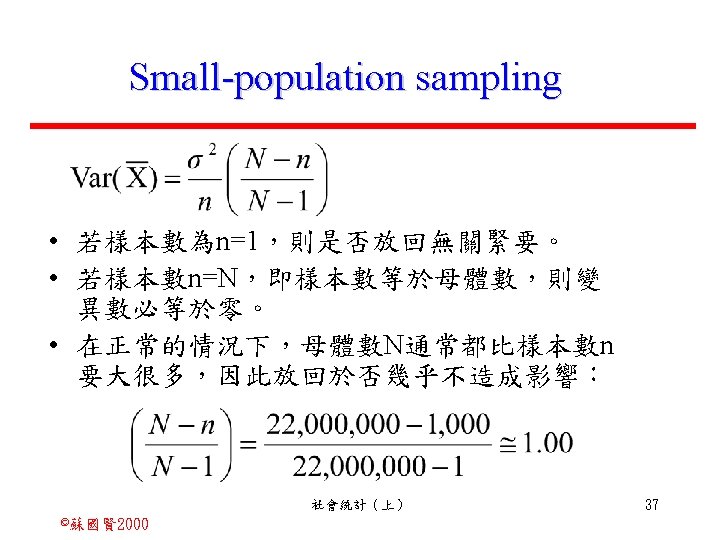
Small-population sampling • If sampling is done without replacement from a finite population containing N elements, then the variance of X is Finite population correction factor 社會統計(上) ©蘇國賢 2000 36
 ©蘇國賢 2000 40")
Variance of Discrete Random Variable 社會統計(上) ©蘇國賢 2000 40

Page 314, Table 7. 2 母體:A = 76, B = 78, C=79, D=81, E=86 社會統計(上) ©蘇國賢 2000 70
 ©蘇國賢 2000 71")
Page 314, Figure 7. 1 社會統計(上) ©蘇國賢 2000 71
 ©蘇國賢 2000 72")
Page 316, Figure 7. 3 社會統計(上) ©蘇國賢 2000 72
 ©蘇國賢 2000 73")
Page 316, Table 7. 4 社會統計(上) ©蘇國賢 2000 73
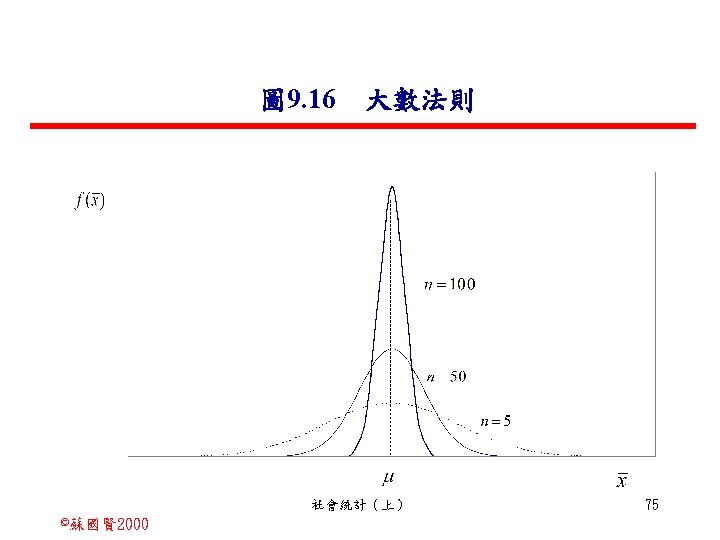


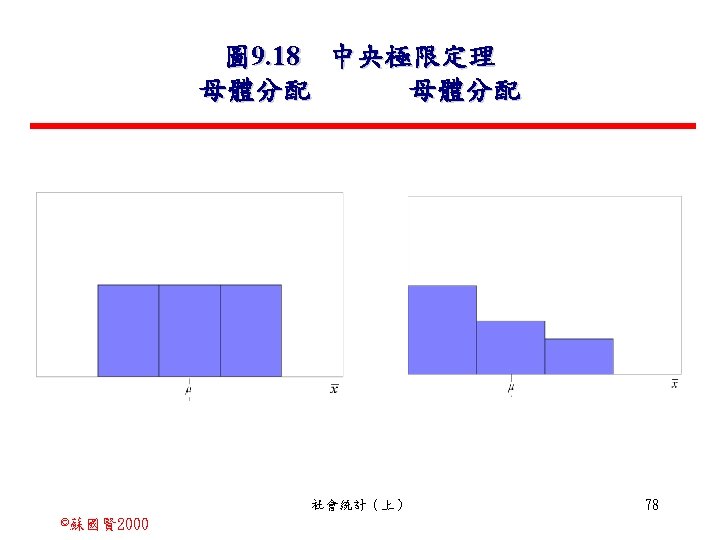
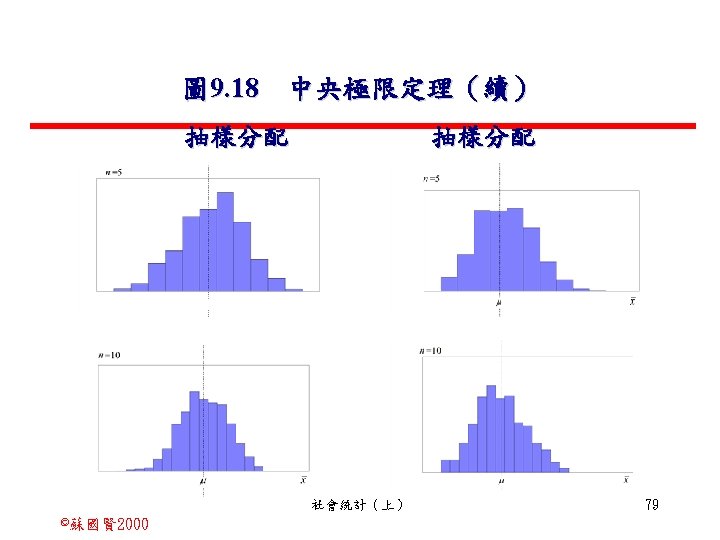
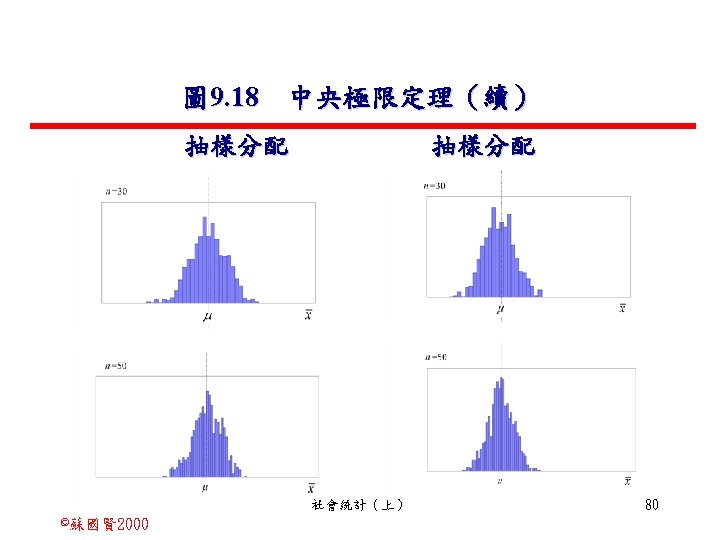
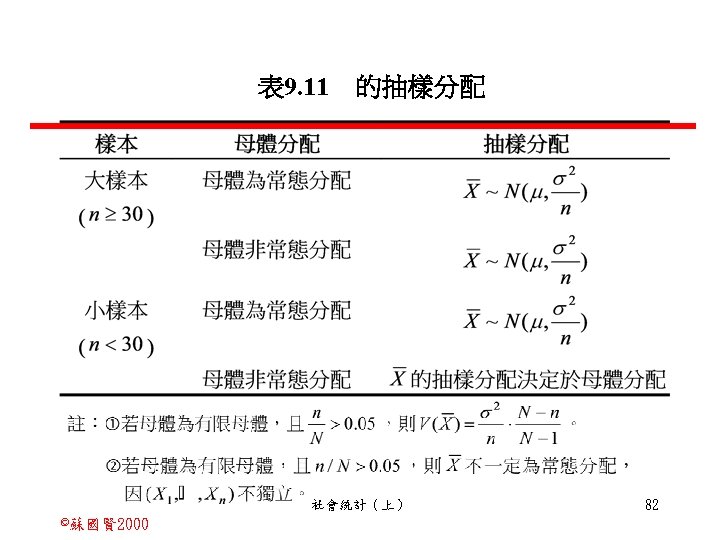
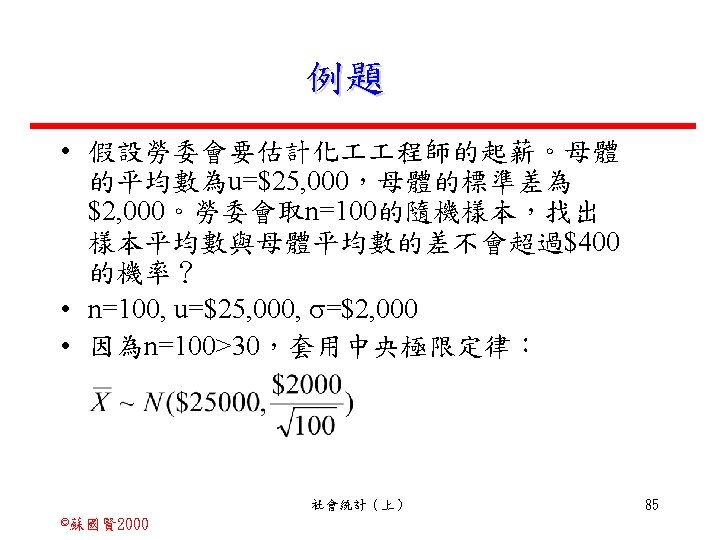
The Central Limit Theorem • 當母體為常態分配時,無論樣本數大小,樣 本平均數的抽樣分配必為常態。 • Suppose we select a random sample of n observations from any population having mean u and standard deviation . If n is sufficiently large (n=20~30), the sampling distribution of X will be: The approximation improves as the sample size increase. 社會統計(上) ©蘇國賢 2000 77
 ©蘇國賢 2000 81")
Page 330, Figure 7. 6 社會統計(上) ©蘇國賢 2000 81
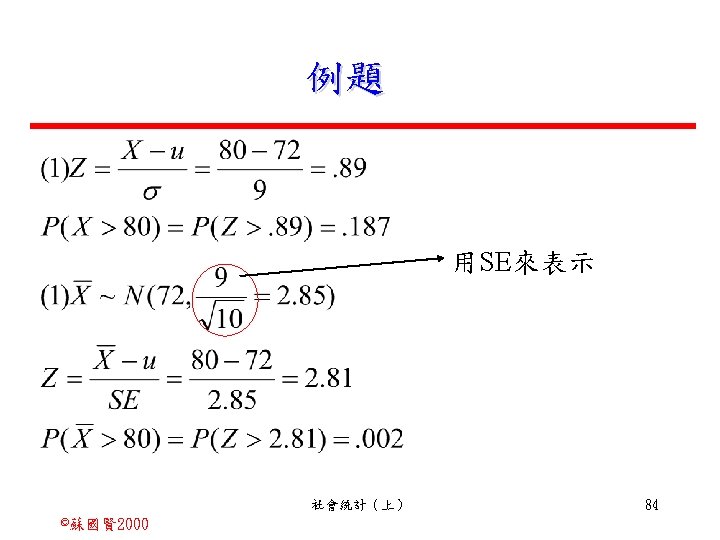
 Suppose a large class in statistics has marks normally distributed around")
例題 • (1) Suppose a large class in statistics has marks normally distributed around a mean of 72 with a standard deviation of 9. Find the probability that an individual student draw at random will have a mark over 80. • (2) Find the probability that a random sample of 10 students will have an average mark over 80. 社會統計(上) ©蘇國賢 2000 83

- Slides: 86