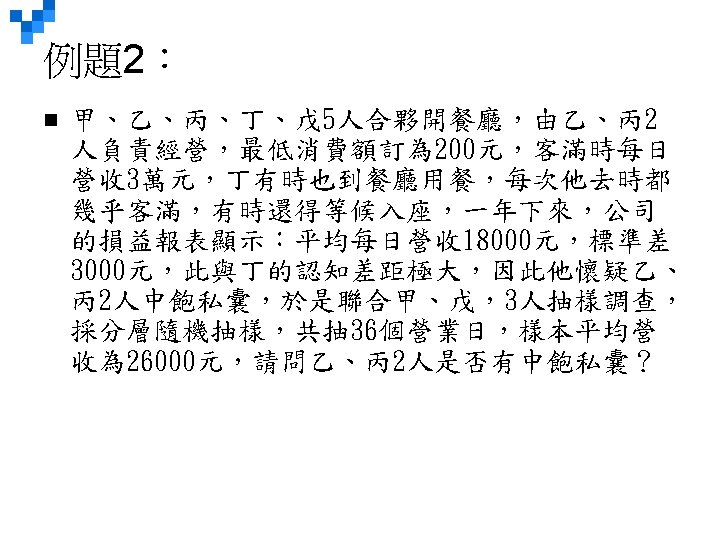
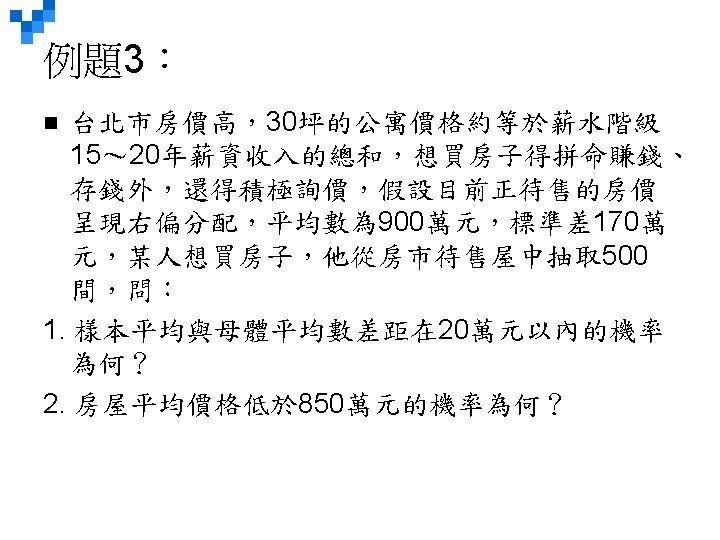
Sampling Methods and the Central Limit Theorem Chapter


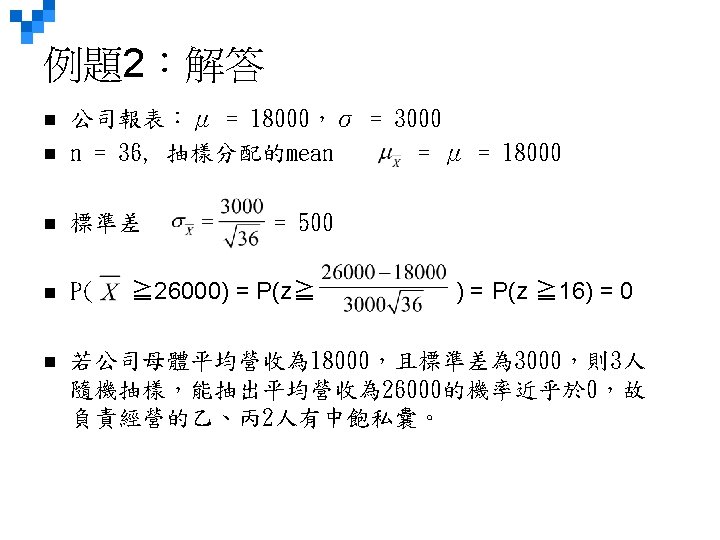
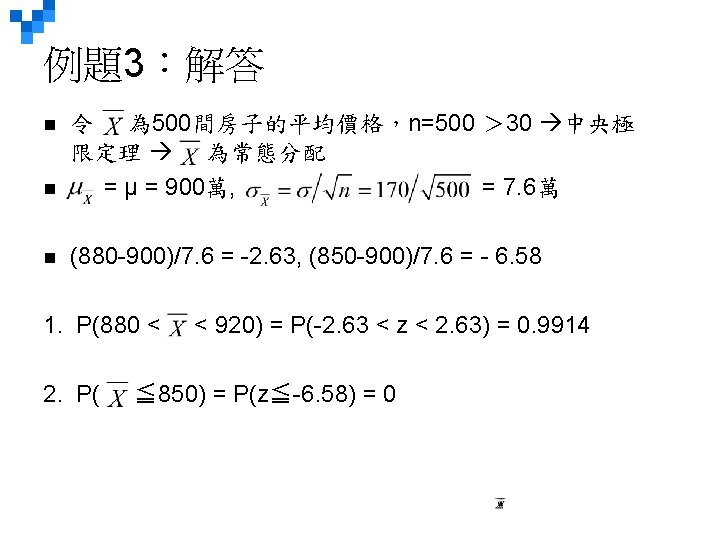
 Stratified Random Sampling 範例: 若我們想研究美國352家大企業的廣告支出,以便決定是否股本報酬率高的公司比低報 酬或虧損者,花更多錢在廣告上,我們打算抽 50家做為樣本。 Suppose")


 1. P(X > 330) = P(z > (330 -300)/30) = P(z")
- Slides: 65
Sampling Methods and the Central Limit Theorem Chapter 8 Copyright © 2015 Mc. Graw-Hill Education. All rights reserved. No reproduction or distribution without the prior written consent of Mc. Graw-Hill Education.
Learning Objectives LO 8 -1 Explain why populations are sampled and describe four methods to sample a population. n LO 8 -2 Define sampling error. n LO 8 -3 Demonstrate the construction of a sampling distribution of the sample mean. n LO 8 -4 Recite the central limit theorem and define the mean and standard error of the sampling distribution of the sample mean. n LO 8 -5 Apply the central limit theorem to calculate probabilities. n 8 -*
LO 8 -1 Explain why populations are sampled and describe four methods to sample a population. Why Sample a Population? § 收集母體資料非常耗費時間 Contacting the whole population would be time consuming. § 收集並研究母體資料的成本極高 The cost of studying all the items in a population may be prohibitive. § 可能無法實際審查、收集、計算所有母體資料 The physical impossibility of checking all items in the population § 檢定、測試會毀壞受測試的檢體、樣本(因此,檢測 母體將會毀壞所有母體,如此一來,對母體檢測,將 會得不)償失 The destructive nature of some tests § 抽樣的結果(用來推論母體)還算恰當 The sample results are adequate. 8 -*
LO 8 -1 較常使用的機率抽樣方法: Commonly Used Sampling Methods n 簡單隨機抽樣 Simple Random Sampling n 系統隨機抽樣 Systematic Random Sampling n 分層隨機抽樣 Stratified Random Sampling n 部落抽樣 Cluster Sampling 8 -*
LO 8 -1 Simple Random Sampling SIMPLE RANDOM SAMPLING A sample selected so that each item or person in the population has the same chance of being included. 母體中每個元素被抽中的機率相同 範例:(1. 抽籤法) Nitra企業有845個員 ,由員 母體中抽出 52人,將員 的名字 寫在紙條上,將所有紙條放入盒子中,充分攪動混和後,抽出 52 張紙條。 A population consists of 845 employees of Nitra Industries. A sample of 52 employees will be selected from that population. The name of each employee is written on a small slip of paper and all slips are deposited in a box. After they have been thoroughly mixed, the first selection is made by drawing a slip out of the box without looking at it. This process is repeated until the sample of 52 employees is chosen. 注意:此法乃抽出後不放回,所以每個名字被抽中的機率略有不 同,但若母體極大,則其機率的差異很小。此處,差異約為 0. 001。 Note: This process is sampling without replacement, so the probability of each selection changes: 1/845, 1/844, 1/843, etc. When the population is large, the difference in the probabilities is very small. In this case, the probability for each of the 52 selections is about 0. 001. 8 -*
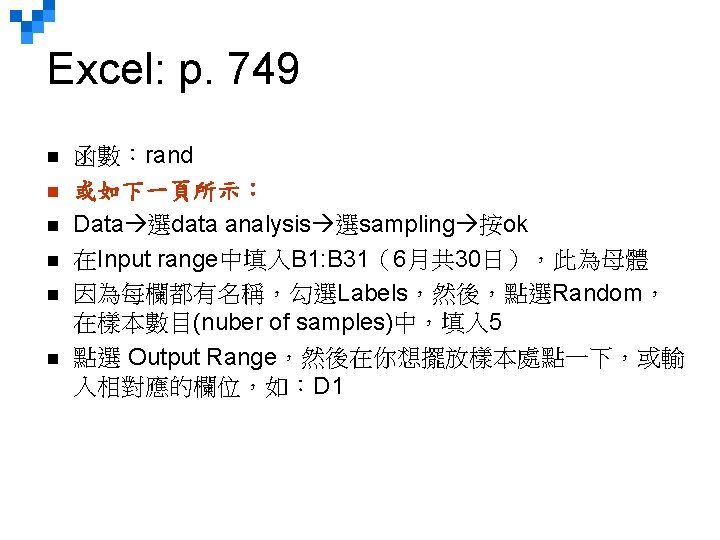
LO 8 -1 簡單隨機抽樣: 2. 使用隨機亂數表 p. 250 Simple Random Sampling: Using Table of Random Numbers 由母體Nitra企業的845名員 中抽出 52位,而比抽籤法更方便的方法 是:將每位員 編號,然後使用附錄B. 4的隨機亂數表。由亂數表中, 隨便選一行與一列,作為起始值,以下51個數值加上起始值,就是被 抽中的52個樣本(此處用前3位數作為被抽中的號碼,若數值大於 845, 則跳到下一號)。 A population consists of 845 employees of Nitra Industries. A sample of 52 employees will be selected from that population. A more convenient method of selecting a random sample is to use the identification number of each employee and a table of random numbers such as the one in Appendix B. 4. 8 -*
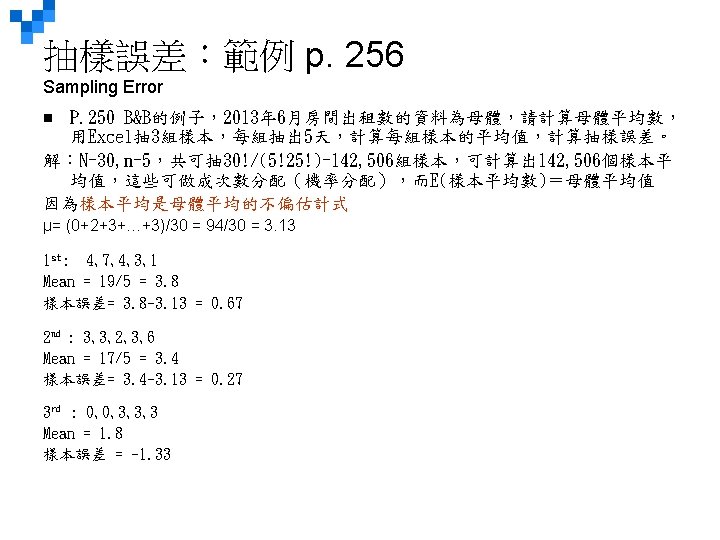
LO 8 -1 簡單隨機抽樣: 3. 用電腦抽號 p. 250 Simple Random Sampling: Using Excel Jane and Joe Miley 經營位於Tryon, North Carolina的Foxtrot Inn(共 有8個房間),下表為此B&B在 2013年 6月的出租情形,可用Excel選 6 月中的5個晚上作為樣本。注意:Excel選取樣本時採取抽後放回的方 式,因此,5個樣本中可能會抽中同一日。 Jane and Joe Miley operate the Foxtrot Inn, a bed and breakfast in Tryon, North Carolina. There are eight rooms available for rent at this B&B. Listed below is the number of these eight rooms rented each day during June 2013. Use Excel to select a sample of five nights during the month of June. 8 -*
LO 8 -1 簡單隨機抽樣: 3. 用電腦抽號 Simple Random Sampling: Using Excel 用Excel選 5個樣本,列於D 欄內。 注意:Excel選取樣本時採 取抽後放回的方式,因此, 5個樣本中可能會抽中同一 日。 Jane and Joe Miley operate the Foxtrot Inn, a bed and breakfast in Tryon, North Carolina. There are eight rooms available for rent at this B&B. Listed is the number of these eight rooms rented each day during June 2012. Use Excel to select a sample of five nights during the month of June. 8 -*
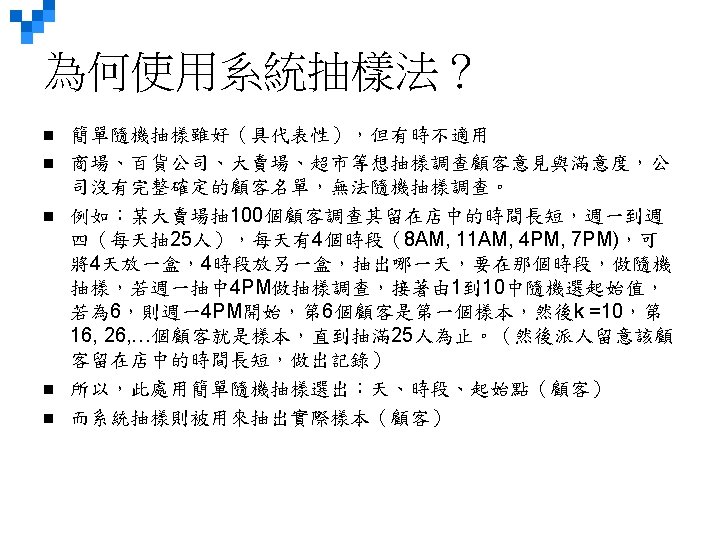
LO 8 -1 系統隨機抽樣 Systematic Random Sampling SYSTEMATIC RANDOM SAMPLING The items or individuals of the population are arranged in some order. A random starting point is selected and then every kth member of the population is selected for the sample. 範例:由 845為員 中選出 52人做為樣本。 1. 先算k值:k = 845/52 = 16. 25,四捨五入後,k = 16 2. 先隨機抽出第一個樣本,之後每次往後算,第 16個人將被選入樣本 中。 A population consists of 845 employees of Nitra Industries. A sample of 52 employees will be selected from that population. First, k is calculated as the population size divided by the sample size. For Nitra Industries, we would select every 16 th (845/52) employee list. If k is not a whole number, then round down. Random sampling is used in the selection of the first name. Then, select every 16 th name on the list thereafter. 8 -*
LO 8 -1 分層隨機抽樣 Stratified Random Sampling STRATIFIED RANDOM SAMPLING A population is first divided into subgroups, called strata, and a sample is selected from each stratum. This is useful when a population can be clearly divided in groups based on some characteristics. EXAMPLE: (將在後面說明解釋) Suppose we want to study the advertising expenditures for the 352 largest companies in the United States to determine whether firms with high returns on equity (a measure of profitability) spend more of each sales dollar on advertising than firms with a low return or deficit. We decide to sample a total of 50 companies. To make sure that the sample is a fair representation of the 352 companies, the companies are grouped on percent return on equity and the number to sample in each group is proportional to the relative size of the group. Then, the number of companies is randomly selected from each group. * Number sampled for Stratum 1 is (0. 02)(50)=1; Stratum 2 is (0. 10)(50)=5, etc. 8 -*
LO 8 -1 分層隨機抽樣 (p. 253) Stratified Random Sampling 範例: 若我們想研究美國352家大企業的廣告支出,以便決定是否股本報酬率高的公司比低報 酬或虧損者,花更多錢在廣告上,我們打算抽 50家做為樣本。 Suppose we want to study the advertising expenditures for the 352 largest companies in the United States to determine whether firms with high returns on equity (a measure of profitability) spend more of each sales dollar on advertising than firms with a low return or deficit. We decide to sample a total of 50 companies. 為保證樣本能代表這 352家企業,我們將它們分成 5個類別,按照其股本報酬率來分類, 下表列出此 5類、家數、以及其相對次數,最後列出每層的抽樣數。每類別的抽樣皆以 隨機抽樣方式抽出樣本。 To make sure that the sample is a fair representation of the 352 companies, the companies are grouped on percent return on equity and the number to sample in each group is proportional to the relative size of the group. Then, the number of companies is randomly selected from each group. *第 1組的抽樣數為: (0. 02)(50)=1; 第 2組的抽樣數為: (0. 10)(50)=5, etc. 第 4組的抽樣數為: (0. 33)(50)=16. 5~ 16 第 5組的抽樣數為: (0. 01)(50)=0. 5~ 1 8 -*
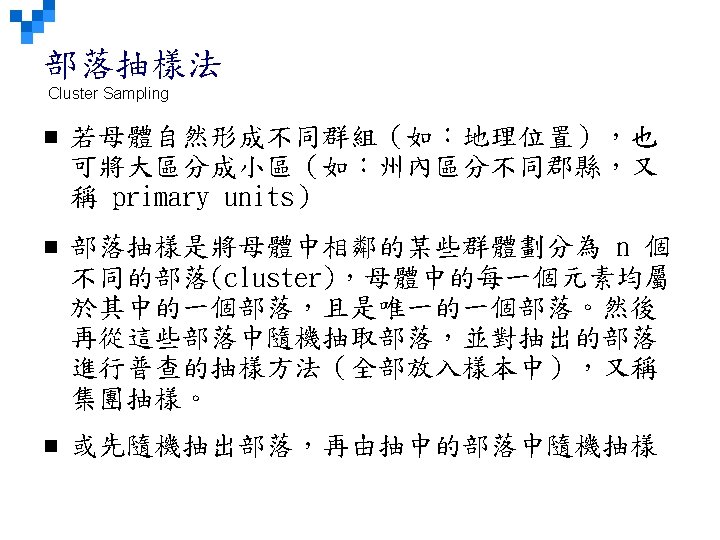
LO 8 -1 部落抽樣法 Cluster Sampling CLUSTER SAMPLING A population is divided into clusters using naturally occurring geographic or other boundaries. Then, clusters are randomly selected and a sample is collected by randomly selecting from each cluster. 範例: 若想知道大芝加哥區居民對環保署、州環 保局的看法如何。 Suppose you want to determine the views of residents in the greater Chicago, Illinois, metropolitan area about state and federal environmental protection policies. 可以將大芝加哥按郡縣分成小區,共可分 成 12郡,隨機抽選 3個郡: La Porte, Cook, and Kenosha,然後再由這 3個郡中隨機抽出我 們需要的樣本。 You can employ cluster sampling by subdividing the region into small units, perhaps by counties. These are often called primary units. Of the twelve counties, you randomly select three: La Porte, Cook, and Kenosha. Next you select a random sample of residents in each of these counties. 8 -*
LO 8 -2 Define sampling error. 抽樣誤差:Sampling Error 抽樣乃是用來計算樣本統計值,作為母體參數的估計值, 因此,樣本統計值與母體參數值的差距,就是抽樣誤差。 By definition, sampling is used to calculate sample statistics which are estimates of population parameters. So there will always be a difference (usually an unknown difference) between the sample statistic and the population parameter. This difference is called sampling error. Examples: 8 -*
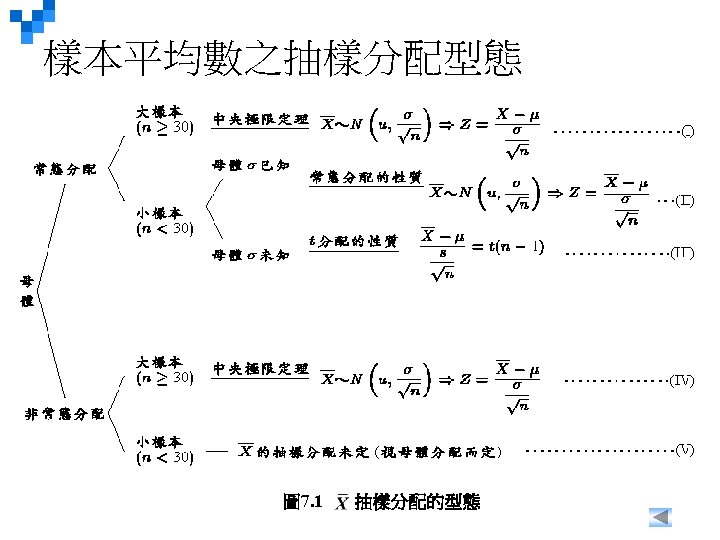
LO 8 -3 Demonstrate the construction of a sampling distribution of the sample mean. 樣本平均數的抽樣分配 Sampling Distribution of the Sample Mean 樣本平均數的抽樣分配是機率分配,包含在既定n(樣本數)下(由同一 母體中抽樣之樣本),所有可能的樣本平均數值的機率分配。 The sampling distribution of the sample mean is a probability distribution consisting of all possible sample means of a given sample size selected from a population. 樣本平均數的抽樣分配可敘述/描繪抽樣誤差的機率分配(抽樣誤差也是 隨機變數) The sampling distribution of the sample mean summarizes the probabilities of sampling error: 8 -*
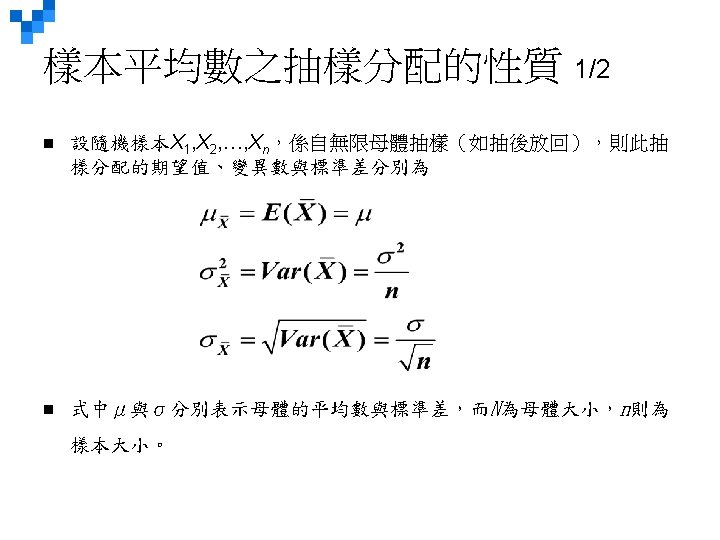
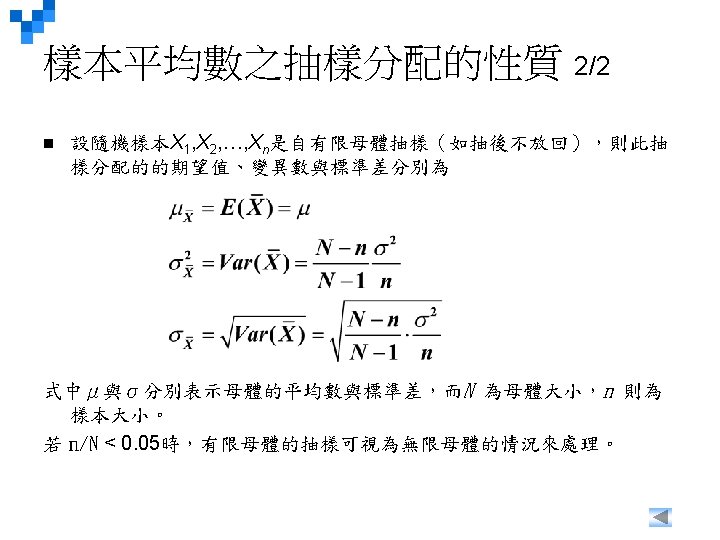
LO 8 -3 樣本平均數的抽樣分配 Sampling Distribution of the Sample Mean § 樣本平均數的抽樣分配的mean等於母體平均數 The mean of the distribution of sample means will be exactly equal to the population mean if we are able to select all possible samples of the same size from a given population. § 抽樣分配的標準差:The Standard Error of the Mean: § 所以,抽樣分配的離散度比母體分配小。 當樣本數目變大時,其標 準差變小。 There will be less dispersion in the sampling distribution of the sample mean than in the population. As the sample size increases, the standard error of the mean decreases. 8 -*
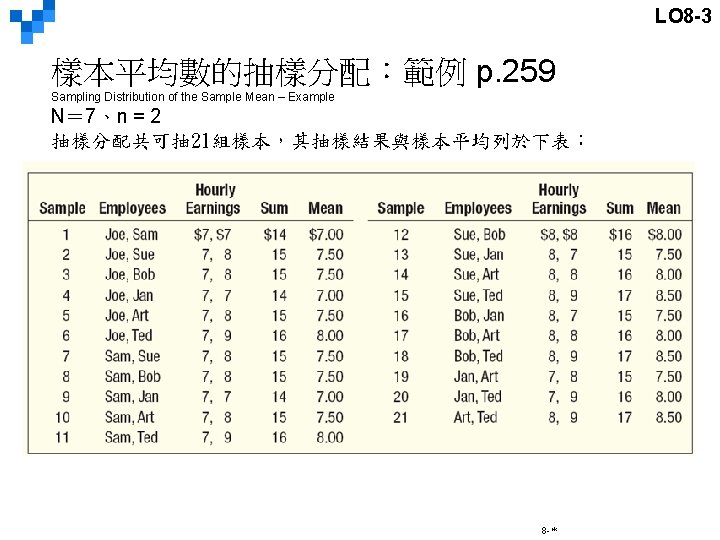
LO 8 -3 樣本平均數的抽樣分配:範例 p. 258 Sampling Distribution of the Sample Mean – Example Tartus企業有7名生產員 (可視為母體),他們的時薪資料如下: N=7 Tartus Industries has seven production employees (considered the population). The hourly earnings of each employee are given in the table below. § § § What is the population mean? What is the population standard deviation? What is the sampling distribution of the sample mean for samples of size 2? n=2 What is the mean of the sampling distribution? What is the standard deviation of the sampling distribution? What observations can be made about the population and the sampling distribution? 8 -*
LO 8 -3 樣本平均數的抽樣分配:範例 p. 258 -259 Sampling Distribution of the Sample Mean – Example The population standard deviation 8 -*
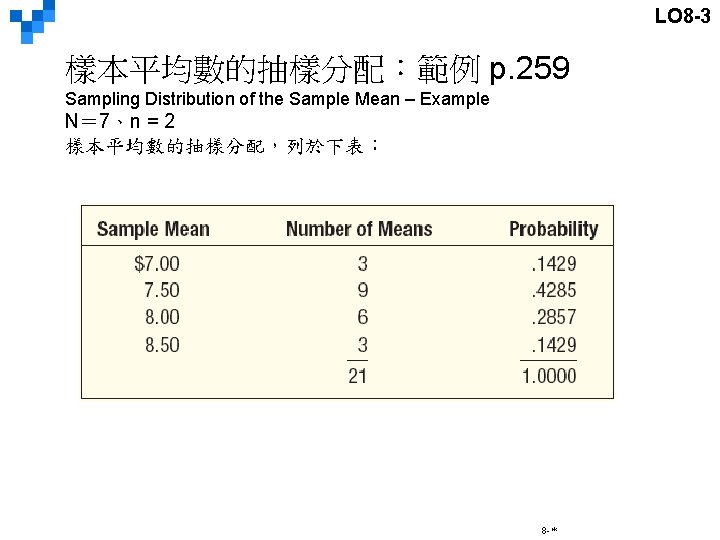
LO 8 -3 樣本平均數的抽樣分配:範例 p. 259 Sampling Distribution of the Sample Mean – Example 8 -*
LO 8 -3 樣本平均數的抽樣分配:範例 p. 259 Sampling Distribution of the Sample Mean – Example These observations can be made: § 抽樣分配的平均值等於母體平均值= 7. 71。 The mean of the distribution of the sample mean ($7. 71) is equal to the mean of the population. § 抽樣分配的離散度低於母體,且當n增大時,離散度變小。( ) The spread in the distribution of the sample mean is less than the spread in the population values. As size of the sample is increased, the spread of the distribution of the sample mean becomes smaller. ( ) § 抽樣分配與母體分配的形狀不同,抽樣分配比較接近常態分配。 The shape of the sampling distribution of the sample mean and the shape of the frequency distribution of the population values are different. The distribution of the sample mean tends to approximate the normal probability distribution. 8 -*
LO 8 -4 Recite the central limit theorem and define the mean and standard error of the sampling distribution of the sample mean. 中央極限定理 Central Limit Theorem CENTRAL LIMIT THEOREM 樣本平均數的抽樣分配接近常態分配(若在固定n之下的所有可能樣本 組合都被抽出,做成抽樣分配),n越大越接近常態分配。 If all samples of a particular size are selected from any population, the sampling distribution of the sample mean is approximately a normal distribution. This approximation improves with larger samples. n 若母體為常態分配,則不管n多小,樣本平均數的抽樣分配也是常態分配。 If the population follows a normal probability distribution, then for any sample size the sampling distribution of the sample mean will also be normal. n 若母體為對稱分配(非常態分配),若n≧ 10,則樣本平均數的抽樣分配即 接近常態分配。 If the population distribution is symmetrical (but normal), the normal shape of the distribution of the sample mean emerges with samples as small as 10. n 若母體為偏態分配,若n≧ 30,則樣本平均數的抽樣分配即接近常態分配。 If a distribution is skewed or has thick tails, it may require samples of 30 or more to observe the normality feature. n 抽樣分配的平均值為μ,變異數為σ2/n,標準差為 The mean of the sampling distribution is equal to μ. The variance is equal to σ2/n and the standard deviation is equal to. 8 -*
LO 8 -4 8 -*
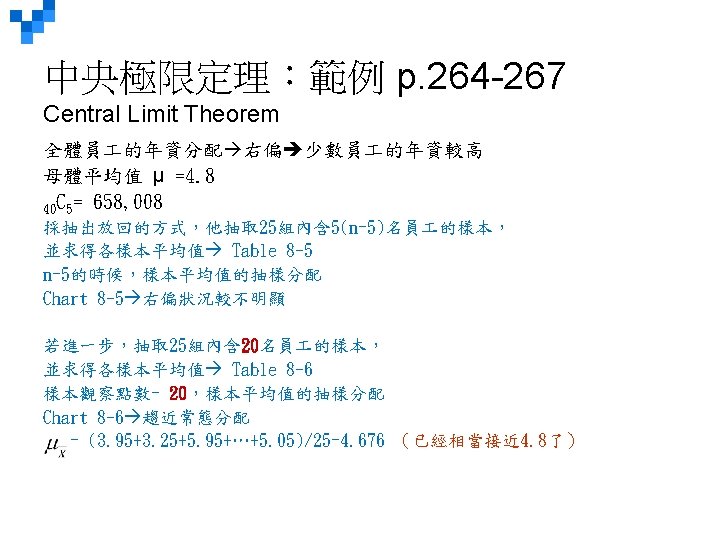
LO 8 -4 中央極限定理:範例 p. 263 -264 Central Limit Theorem Spence Sprockets公司雇用 40名員 ,必須為他們買健保,在選購健保方案前, 由員 中選出 5位代表成立委員會,委員會必須謹慎評估研究員 的健康需求, 然後推薦何種方案最適合員 需求,老闆Ed發現新員 與老員 的需求不同, 若他隨機抽樣,平均年資=?樣本平均年資與母體平均年資是否相等? 40名員 的年資(四捨五入)列於下表。 Spence Sprockets, Inc. employs 40 people and faces some major decisions regarding health care for these employees. Before making a final decision on what health care plan to purchase, Ed decides to form a committee of five representative employees. The committee will be asked to study the health care issue carefully and make a recommendation as to what plan best fits the employees’ needs. Ed feels the views of newer employees toward health care may differ from those of more experienced employees. If Ed randomly selects this committee, what can he expect in terms of the mean years with Spence Sprockets for those on the committee? How does the shape of the distribution of years of experience of all employees (the population) compare with the shape of the sampling distribution of the mean? The lengths of service (rounded to the nearest year) of the 40 employees currently on the Spence Sprockets, Inc. , payroll are as follows. 8 -*
LO 8 -4 中央極限定理:範例 p. 264 -267 Central Limit Theorem 25 Samples of 5 Employees 25 Samples of 20 Employees 8 -*
LO 8 -5 Apply the central limit theorem to calculate probabilities. 採用樣本平均數的抽樣分配 Using the Sampling Distribution of the Sample Mean § 若母體為常態分配,則樣本平均數的抽樣分配也是常態分配 If a population follows the normal distribution, the sampling distribution of the sample mean will also follow the normal distribution § 若為非常態分配,但樣本數大於 30,中央極限定理保證樣本平均 的抽樣分配為常態分配 If the shape is known to be non-normal but the sample contains at least 30 observations, the central limit theorem guarantees the sampling distribution of the mean follows a normal distribution. § 若母體標準差已知,樣本平均的抽樣分配的z值如下: When the population standard deviation is known, a z-statistic for the sampling distribution of the sample mean is calculated as: 8 -*
LO 8 -5 採用樣本平均數的抽樣分配:範例 p. 271 Using the Sampling Distribution of the Sample Mean – Example 可樂公司的品管部門紀錄大瓶裝可樂的注入量,每一瓶的量或多或少有 些出入,但差距不能太大,他們既不願量過少,也不願量過多,紀錄顯 示裝瓶量為常態分配,平均值為 31. 2盎司,母體標準差為 0. 4盎司。 The Quality Assurance Department for Cola, Inc. maintains records regarding the amount of cola in its jumbo bottle. The actual amount of cola in each bottle is critical, but varies a small amount from one bottle to the next. Cola, Inc. does not wish to underfill the bottles. On the other hand, it cannot overfill each bottle. Records indicate that the amount of cola follows the normal probability distribution. The mean amount per bottle is 31. 2 ounces and the population standard deviation is 0. 4 ounces. 今天上午8點品管技師由生產線隨機選了16瓶,平均值為 31. 38盎司,請 問這是否不尋常?此生產線是否裝填過量的可樂?換句話說,樣本誤差 為 0. 18盎司是否不尋常? At 8 a. m. today the quality technician randomly selected 16 bottles from the filling line. The mean amount of cola contained in the bottles is 31. 38 ounces. Is this an unlikely result? Is it likely the process is putting too much soda in the bottles? To put it another way, is the sampling error of 0. 18 ounces unusual? 8 -*
LO 8 -5 採用樣本平均數的抽樣分配:範例 p. 271 Using the Sampling Distribution of the Sample Mean – Example Step 1: 先算樣本平均31. 38的z值為多少? Find the z-value corresponding to the sample mean of 31. 38. 8 -*
LO 8 -5 採用樣本平均數的抽樣分配:範例 p. 271 Using the Sampling Distribution of the Sample Mean – Example Step 2: 再看z≧ 1. 8的機率為多少? Find the probability of observing a Z equal to or greater than 1. 80. 8 -*
LO 8 -5 採用樣本平均數的抽樣分配:範例 p. 271 Using the Sampling Distribution of the Sample Mean – Example 樣本平均31. 38的確不尋常,因 為根據抽樣分配,這個樣本平均 發生的機率低於 4%,所以,這 條生產線裝得太滿了! What do we conclude? It is unlikely, less than a 4 percent chance, we could select a sample of 16 observations from a normal population with a mean of 31. 2 ounces and a population standard deviation of 0. 4 ounces and find the sample mean equal to or greater than 31. 38 ounces. We conclude the process is putting too much cola in the bottles. 8 -*
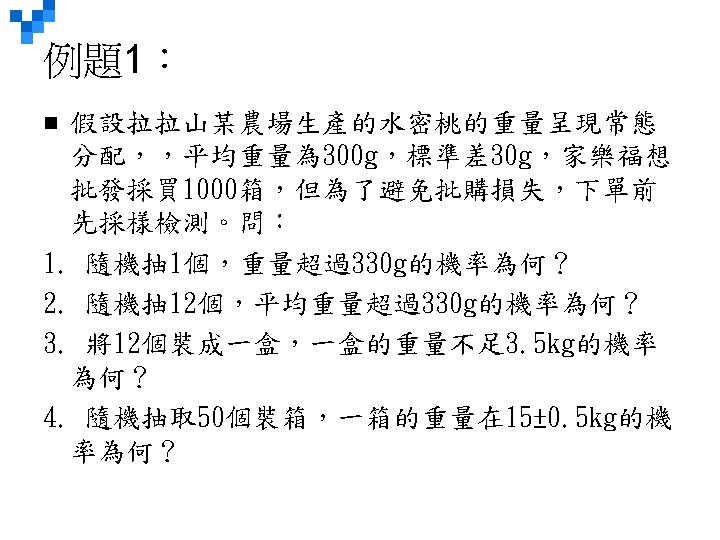
例題1:解答 X~N(300, 302) 1. P(X > 330) = P(z > (330 -300)/30) = P(z > 1) = 0. 5 -0. 3413= 0. 1587 2. 抽樣分配~ N(300, 900/12) , n = 12, mean = 300, s 2 = 302 /12 s = 8. 66, z = (330 -300)/8. 66 = 3. 464 P(mean > 330) = P(z > 3. 46) = 0. 0003 3. 12粒水密桃裝一盒,每粒的重量都是常態分配,故採用加法定理 E(ΣX) = 12μ = 12*300=3600 V(ΣX) = 12σ2 = 12*900 = 10800 s = 103. 923 重量不足X=3. 5 kg=3500 g z = (3500 -3600)/103. 923 = -0. 9623 P(X < 3500) = P(z < -0. 96) = 0. 1685 4. n = 50 >30 中央極限定理 E(ΣX) = 50μ = 50*300=15000 V(ΣX) = 50σ2 = 50*900 = 45000 s = 212. 132 重量介於(15 -0. 5 kg, 15+0. 5 kg)=(14500, 15500)g z = ± 500/212. 132= -2. 357 P(14500< X < 15500) = P(-2. 36 < z < 2. 36) =0. 9818