Sampling is the other method of getting data


- Slides: 12
• Sampling is the other method of getting data, along with experimentation. It involves looking at a sample from a population with the hope of making inferences about the population from the sample. We can consider many different sample designs, the various methods of taking the sample from the population. – Ex. 3. 23 (3. 2, 1/5) shows an example of voluntary response samples, consisting of people who choose themselves to be part of the sample, often by responding to a general appeal for volunteers. These type samples are highly biased, since people with very strong opinions (esp. negative ones!) are most likely to respond…
• The remedy for voluntary samples is to have chance involved in the choice … i. e. , to involve random selection of sample points. • A simple random sample (SRS) of size n consists of n individuals from the population of interest, chosen in such a way that every collection of n individuals is as equally likely to be picked as any other. Go over Ex. 3. 24 (3. 2, 2/5) • Other types of samples are also in use: – Stratified random sample: first divide the population into strata, then choose a SRS from each stratum and combine them to form the full sample – Multistage sample: choose the sample in stages, as in national political samples…see p. 203 (3. 2, 4/5)
• There are many things to be concerned with in sample surveys… – Undercoverage occurs when some groups in the population are left out of the process of choosing the sample – Nonresponse occurs when an individual chosen for the sample can’t be contacted or decides not to cooperate - see Example 3. 27, p. 205 (3. 2, 5/5) – Response bias occurs when an individual in the sample lies; or when the interviewer has a manner that elicits a particular response; respondents often have bad memories or “telescope” events in the past; see Example 3. 29 on page 206 (3. 2, 5/5) – Wording of questions can influence answers on a sample survey; see Example 3. 30 on page 207 (3. 2, 5/5)
• HW: Read section 3. 2 and go over all the examples. Do #3. 52 -3. 55, 3. 57 -3. 59, 3. 61, 3. 62, 3. 68, 3. 71 -3. 74. • Read ahead to section 3. 3 on inference from samples. . .
Inference from Samples… • If a sample represents the population from which it is drawn, then we should be able to use the information in it to make inferences about its population – this is one example of statistical inference in action. • A sample is to its population as a statistic is to its corresponding parameter. • A simple example of the above is the parameter defined as the proportion of people in the population of US adults who approve of the job Pres. Obama is doing as president (call it p); now take a sample from this population and compute the proportion of people in the sample who approve of the job he's doing. This value is called
Population versus sample • Population: The entire group of individuals in which we are interested but can’t usually assess directly. Example: All humans, all working-age people in California, all crickets • A parameter is a number describing a characteristic of • Sample: The part of the population we actually examine and for which we do have data. –How well the sample represents the population depends on the sample design. Population the population (like p) • A statistic is a number describing a characteristic of a sample (like ) Sample
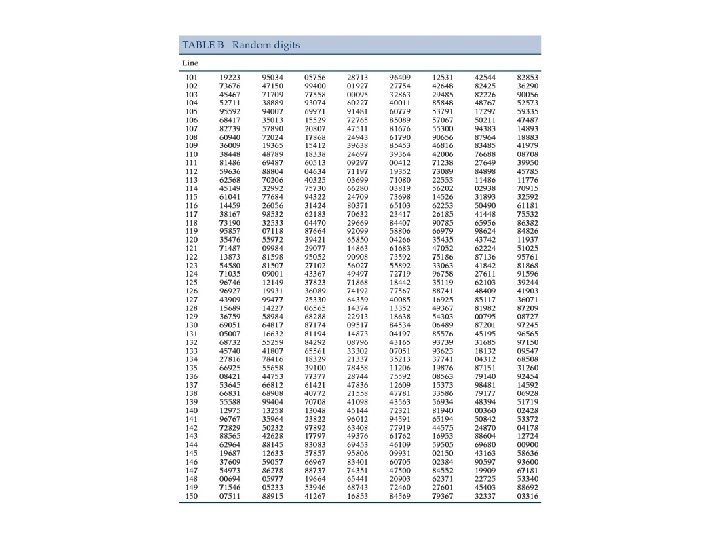
• exhibits sampling variability: different random samples will give rise to different ‘s • But sampling variability is not bad; in fact we use this fact as the basis for many statistical inferential procedures… “what would happen if we took many samples” or “what would happen if we repeated a particular procedure many times? ” • Simulation is a way of illustrating sample variability and we’ll use Table B as an example… – Suppose 40% of the population approves of the job the president is doing. How would samples of size 20 vary if we asked each person in the sample: “Do you approve of the job the president is doing? ” and require a “yes” or “no” answer ? Try it with Table B – how would you set up the simulation?
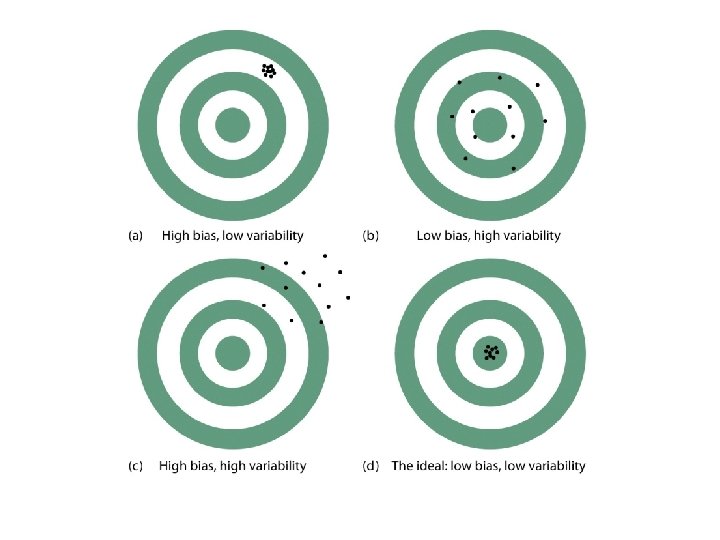
• The sampling distribution of a statistic is the distribution of values taken on by the statistic in all possible samples of the same size from the same population. Many times, sampling distributions of statistics based on large sample sizes tend to be normally distributed. Check out the sampling distribution of … • A statistic is unbiased if the mean of its sampling distribution equals the true value of the parameter being estimated • The variability of a statistic is described by the spread of its sampling distribution. Statistics from samples with large sample sizes have smaller variability.
Definition, pg 217– 218 Introduction to the Practice of Statistics, Sixth Edition © 2009 W. H. Freeman and Company
• Read section 3. 3. • Do # 3. 84 -3. 86, 3. 89, 3. 95. • Make sure you understand the process of simulation done in these last two exercises and in Example 3. 32, (page 214 or ebook, 3. 3, 2/6) and how these lead to an estimate of the sampling distribution, as in Figures 3. 11 and 3. 12 on page 215 (ebook, 3. 3, 3/6) Definition, pg 215 Introduction to the Practice of Statistics, Sixth Edition © 2009 W. H. Freeman and Company