Sampling Design Sampling Terminology Sample A subset or

Sampling Design

Sampling Terminology • Sample – A subset, or some part, of a larger population • Population or universe – Any complete group of entities that share some common set of characteristics • Population element – An individual member of a population • Census – An investigation of ALL the individual elements that make up a population

Why Sample? • Sampling – Cuts costs – Reduces labor requirements – Gathers vital information quickly • Most properly selected samples give sufficiently accurate results

Target Population • A. k. a. , the Relevant population • Operationally define – All women still capable of bearing children vs. – All women between the ages of 12 and 50 • Comic book reader? – Does this include children under 6 years of age who do not actually read the words?

Sampling Frame • A list of elements from which the sample may be drawn • A. K. A. , the working population • Mailing lists - data base marketers – Sampling services or list brokers

Two Major Categories of Sampling • Probability sampling • Known, nonzero, & equal probability of selection for every population element • Nonprobability sampling • Probability of selecting any particular member is unknown

Nonprobability Sampling • • Convenience Judgment Quota Snowball

Convenience Sampling • Also called haphazard or accidental sampling • The sampling procedure of obtaining the people or units that are most conveniently available

Judgment Sampling • Also called purposive sampling • An experienced individual selects the sample based on his or her judgment about some appropriate characteristics required of the sample member

Quota Sampling • Ensures that the various subgroups in a population are represented on pertinent sample characteristics to the exact extent that the investigators desire • It should not be confused with stratified sampling.

Snowball Sampling • A variety of procedures • Initial respondents are selected by probability methods • Additional respondents are obtained from information (or referrals) provided by the initial respondents

Comparing the Nonprobability Techniques Technique Strengths Weaknesses Convenience Sampling • Least expensive • Least time needed • Most convenient • Selection bias • Not representative Judgmental Sampling • Low expense • Little time needed • Convenient • Subjective • Does not allow generalizations Quota Sampling • Can control sample characteristics • Selection bias • Most likely not representative Snowball Sampling • Can estimate rare characteristics • Time consuming • Most likely not representative

Most Commonly-Used Probability Sampling Techniques Simple Random Sampling Systematic Sampling Stratified Sampling

Simple Random Sampling • A sampling procedure that ensures that each element in the population will have an equal chance of being included in the sample

Systematic Sampling • A simple process • Every nth name from the list will be drawn • Periodicity – Problem that occurs in systematic sampling when the original list has a systematic pattern (I. e. , the original list is not random in character)

Stratified Sampling • Probability sample • Subsamples are drawn within different strata using simple random sampling • Each stratum is more or less equal on some characteristic • Do not confuse with quota sample

Comparing the Probability Techniques Technique Strengths Simple Random Sampling • Easily understood • Can project results Weaknesses • Expensive • Difficult to construct sampling frame • No assurance of representativeness Systematic Sampling • Easier to implement than • Can decrease SRS representativeness • Increased representativeness • Sampling frame not necessary Stratified Sampling • Precision • Includes all important subpopulations • Selection of stratification variables difficult • Expensive

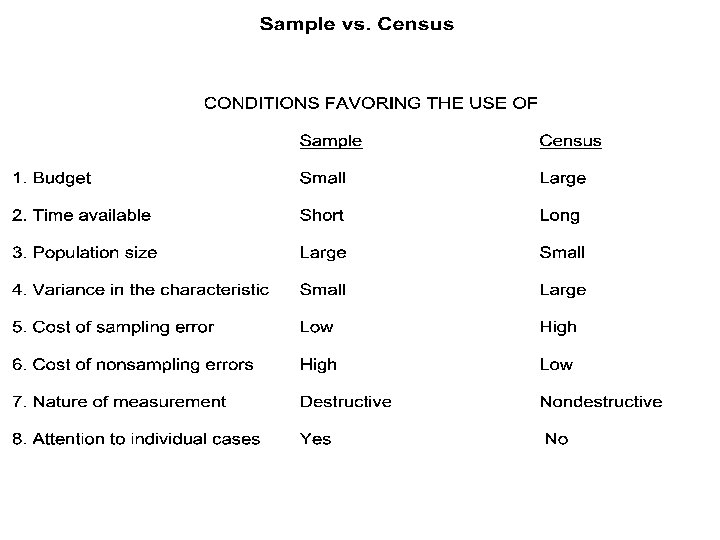
What is the Appropriate Sample Design? • • • Degree of accuracy Resources Time Advanced knowledge of the population National versus local Need for statistical analysis

Choosing Between Nonprobability & Probability Sampling Factor Nonprobability Probability Nature of Research Exploratory Conclusive Relative Magnitude of Sampling & Nonsampling Errors Nonsampling errors larger Sampling errors larger Population Variability Homogeneous (low variability) Heterogeneous (high variability) Statistical Considerations Unfavorable Favorable Operational Considerations Favorable Unfavorable

Internet Samples • Recruited Ad Hoc Samples • Opt-in Lists
 – Get from pilot")
Information Needed to Determine Sample Size • Variance (standard deviation) – Get from pilot study or rule of thumb (managerial judgment) • Magnitude of error – Managerial judgment or calculation • Confidence level – Managerial judgment

Sample Size Formula for Questions Involving Means

Sample Size Formula - Example Suppose a survey researcher is studying expenditures on lipstick Wishes to have a 95 percent confident level (Z) and Range of error (E) of less than $2. 00. The estimate of the standard deviation is $29. 00.

Sample Size Formula - Example

Sample Size Formula - Example Suppose, in the same example as the one before, the range of error (E) is acceptable at $4. 00 (rather than the original $2. 00), sample size is reduced.

Sample Size Formula - Example
( 29 ) n=ê")
Calculating Sample Size 99% Confidence é ù ( 2. 57 )( 29 ) n=ê ú 2 ë û 2 é 74. 53 ù =ê ú ë 2 û 2 = [37. 265] =1389 2 é ù ( 2. 57 )( 29 ) n=ê ú 4 ë û 2 é ù 74. 53 =ê ú ë 4 û 2 = [18. 6325] = 347 2

Sample Size for a Proportion

z 2 pq n= 2 E Where: n = Number of items in samples Z 2 = The square of the confidence interval in standard error units. p = Estimated proportion of success q = (1 -p) or estimated the proportion of failures E 2 = The square of the maximum allowance for error between the true proportion and sample proportion or zsp squared.

Sample Size for a Proportion: Example • A researcher believes that a simple random sample will show that 60 percent of a population (p =. 6) recognizes the name of an automobile dealership. • Note that 40% of the population would not recognize the dealership’s name (q =. 4) • The researcher wants to estimate with 95% confidence (Z = 1. 96) that the allowance for sampling error is not greater than 3. 5 percentage points (E = 0. 035)

Calculating Sample Size at the 95% Confidence Level p q =. 6 =. 4 n = ( 1. 96 (. = 2 ) (. 6 )(. 4 ) 035 ( 3. 8416 )2 )(. 001225. =. = 922 001225 753 24 )
- Slides: 32