Sampling Concepts Population Population refers to any group


Higher is the likeability of the advertisement higher is the recall rate. • 1")


 • The independent-measures design is used in situations where a")

 • To prepare the")
 1. State the hypotheses")
 3. Compute the test")
 • This difference is")


 of many businesses can be severely damaged")

- Slides: 42
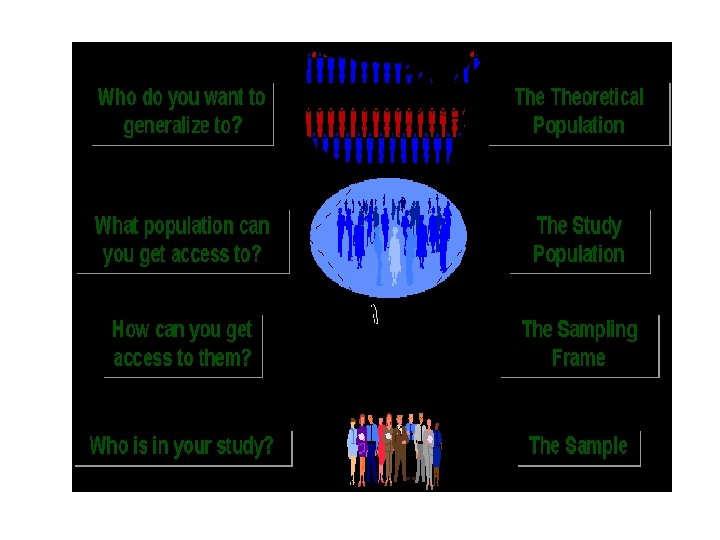
Sampling Concepts • • Population: Population refers to any group of people or objects that form the subject of study in a particular survey and are similar in one or more ways. Element: An element comprises a single member of the population. Sampling frame: Sampling frame comprises all the elements of a population with proper identification that is available to us for selection at any stage of sampling. Sample: It is a subset of the population. It comprises only some elements of the population. Sampling unit: A sampling unit is a single member of the sample. Sampling: It is a process of selecting an adequate number of elements from the population so that the study of the sample will not only help in understanding the characteristics of the population but will also enable us to generalize the results. Census (or complete enumeration): An examination of each and every element of the population is called census or complete enumeration.
What you want to talk about Population Sampling Frame What you actually observe in the data Sampling Process Inference Sample Using data to say something (make an inference) with confidence, about a whole (population) based on the study of a only a few (sample).
Advantages of Sample over Census �Sample saves time and cost. �A decision-maker may not have too much of time to wait till all the information is available. �There are situations where a sample is the only option. �The study of a sample instead of complete enumeration may, at times, produce more reliable results. A census is appropriate when the population size is small.
Sampling versus Non-Sampling Error �Sampling error: This error arises when a sample is not representative of the population. �Non-sampling error: This error arises not because a sample is not a representative of the population but because of other reasons. Some of these reasons are listed below: � Plain lying by the respondent. � The error can arise while transferring the data from the questionnaire to the spreadsheet on the computer. � There can be errors at the time of coding, tabulation and computation. � Population of the study is not properly defined � Respondent may refuse to be part of the study. � There may be a sampling frame error.
Standard Normal probability Distribution • A random variable that has a mean 0 and SD 1 is said to have a standard normal probability distribution. • This particular random variable is designated by the letter Z. • The Z formula is
The z score can be defined as the number of SD that a value X is above or below the mean of distribution. If the value of X is more than mean Z score is …………… If the value of X is less than mean Z score is …………… If the value of X is equal to mean Z score is ……………
In a grocery store, the mean expenditure per customer is Rs 25000 with a SD of Rs. 3000. If a random sample of 50 customer is selected, what is the probability that the sample average expenditure per customer is more than Rs. 26000?
1 -A placement company has conducted a written test to recruit people in a software company. Assume that the test marks are normally distributed with mean 120 and SD 50. Calculate the following: a) Probability of randomly obtaining scores greater than 200 in this test. b) Probability of randomly obtaining a scores greater that is 180 or less.
Sampling Distributions • Suppose our samples each consist of thirty 25 years old women from a city with a population of 1000. By computing the Mean and SD of that height for each of these samples, we see that the mean and sd of each sample would be different. A probability distribution of all the possible means of the sample is a distribution of the sample mean. Statistician call this sampling distribution.
Central Limit Theorem • The central limit theorem states that when an infinite number of successive random samples are taken from a population, the distribution of sample means calculated for each sample will become approximately normally distributed with mean μ and standard deviation σ / √ N (∼N(μ, σ / √ N)) as the sample size (N) becomes larger, irrespective of the shape of the population distribution. successive sampling from a population • increasing sample size • population distribution • Keep in mind that this theorem applies only to the mean and not other statistics. The revised version of Z formula is
Confidence Interval The selection of a confidence level for an interval determines the probability that the confidence interval produced will contain the true parameter value. Common choices for the confidence level C are 0. 90, 0. 95, and 0. 99. These levels correspond to percentages of the area of the normal density curve. For example, a 95% confidence interval covers 95% of the normal curve -- the probability of observing a value outside of this area is less than 0. 05. Because the normal curve is symmetric, half of the area is in the left tail of the curve, and the other half of the area is in the right tail of the curve.
Population mean is located within the confidence interval. the confidence For a 95% confidence interval, the area in each tail is equal to 0. 05/2 = 0. 025. Area that lie on the right side of the normal curve is 0. 500 -0. 025=0. 475 Similarly the area that lie on the left side of the curve is 0. 500 -0. 025=0. 475
Value of Z for most commonly used Confidence Interval Confidence Level 90% 95% 98% 99% 94% (α) 0. 10 (α /2) 0. 05 Z (α /2)
Example: Imagine that a tutor asks 100 students to complete a Math's test. The tutor wants to know why some students perform better than others. Whilst the tutor does not know the answer to this, she thinks that it might be because of two reasons: (1) some students spend more time revising for their test; and (2) some students are naturally more intelligent than others. As such, the tutor decides to investigate the effect of revision time and intelligence on the test performance of the 100 students. The dependent and independent variables for the study are
Hypothesis • A hypothesis is any assumption or statement that may or may not be true. • A hypothesis is tested on the basis of information obtained from the sample. • Hypothesis test are used in business and industry for making decisions
• Null Hypothesis: These are proposed with the intent of receiving rejection denoted by H 0 It requires that we hypothesize the opposite of what is desired to be proved. If you want to examine that the New drug is better than the old drug. H 0= Alternate Hypothesis: Rejection of null hypothesis leads to acceptance of alternate hypothesis.
• Research Question for Relationships: Is there a relationship between height and weight? Null Hypothesis: There is no relationship between height and weight. Alternative Hypothesis: There is a relationship between height and weight. • Research Question for Differences: Do boys like reading more than girls? Null Hypothesis: There is no difference between reading habits of boys and girls. Alternative Hypothesis: Boys do like reading more than girls.
A)Higher is the likeability of the advertisement higher is the recall rate. • 1 -Research Question • 2 -One Tailed Relational Hypothesis • 3 -Descriptive Hypothesis • 4 -Two Tailed Relational Hypothesis • B)Children have a higher IQ if they eat oily fish for a period of time.
• Your alternative hypothesis, H 1 would be • “Children who eat oily fish for six months will show a higher IQ increase than children who have not. ” • Therefore, your null hypothesis, H 0 would be • “”
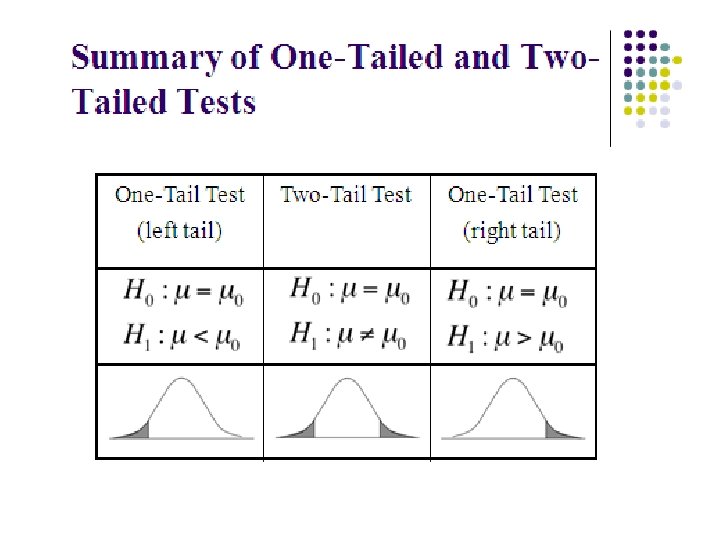
One Tailed and Two tailed The case is of a soft drink bottling plant which dispenses soft drink in bottles of 300 ml capacity. The bottling is done through an automatic plant. An overfilling of bottle means huge loss to the company given the large volume of sales. An under-filling of bottle means customer’s are getting less than 300 ml while they are paying for 300 ml. This could bring bad reputation to the company. So the company want to avoid both under-filling and overfilling. Therefore it would prefer to test the hypothesis that the mean content of bottle is different from 300 ml Overfilling: mean>300 ml Underfilling: mean<300 ml
• Is there a difference between brain sizes of male and female university students Two Tailed Hypothesis One tailed Hypothesis
Type I and Type II Error • When you reject the null hypothesis when it is true. (type I Error) • When you accept the null hypothesis when it is false. (type II error)
Testing of Hypothesis A marketing research firm conducted a survey 10 years ago and found that the average household income of a particular geographic region is Rs. 10, 000. Mr. Gupta , who has recently joined the firm as a VP has expressed doubts about the accuracy of data. For verifying the data the firm has taken a random sample of 200 households that has given a sample mean of Rs 11, 000. the SD of household income is Rs 1200. Verify Mr. Gupta doubt using seven steps of hypothesis testing.
Hypothesis testing Procedure 1 - Set Null and Alternate hypotheses 2 -Determine the appropriate statistical test 3 -Set the level of significance 4 -Set the decision rule 5 -Collect the sample data 6 -Analyse the data (calculation part) 7 -Arrive at a statistical conclusions and business implications
An insurance company is reviewing its current policy rates. When originally setting the rates they believed that the average claim amount was $1, 800. They are concerned that the true mean is actually higher than this, because they could potentially lose a lot of money. They randomly select 40 claims, and calculate a sample mean of $1, 950. Assuming that the standard deviation of claims is $500, and set significance level =. 05, test to see if the insurance company should be concerned.
P-value approach for hypothesis testing • Large sample • Observed level of significance • The decision rule for rejecting a null hypothesis based on p value is: • P value< alpha (reject null hypothesis) Otherwise accept null hypothesis
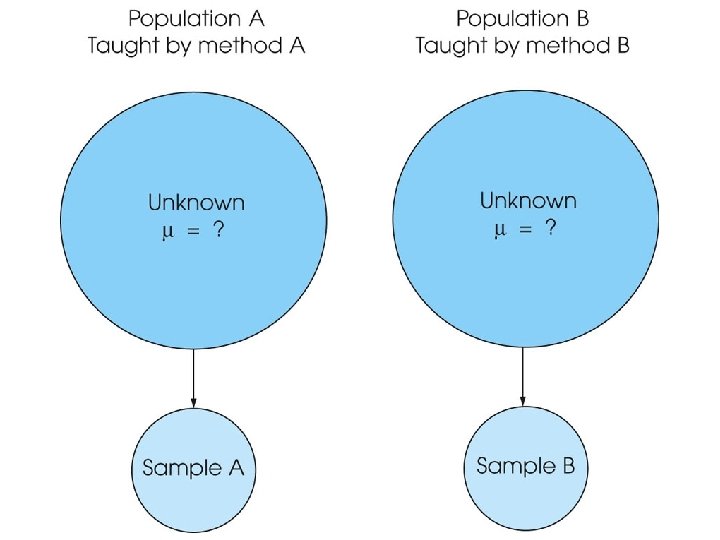
Independent-Measures Designs • The independent-measures hypothesis test allows researchers to evaluate the mean difference between two populations using the data from two separate samples. • The identifying characteristic of the independentmeasures or between-subjects design is the existence of two separate or independent samples. • Thus, an independent-measures design can be used to test for mean differences between two distinct populations (such as men versus women) or between two different treatment conditions (such as drug versus no-drug). 29
Independent-Measures Designs (cont. ) • The independent-measures design is used in situations where a researcher has no prior knowledge about either of the two populations (or treatments) being compared. • In particular, the population means and standard deviations are all unknown. • Because the population variances are not known, these values must be estimated from the sample data. 31
Hypothesis Testing with the Independent. Measures t Statistic • As with all hypothesis tests, the general purpose of the independent-measures t test is to determine whether the sample mean difference obtained in a research study indicates a real mean difference between the two populations (or treatments) or whether the obtained difference is simply the result of sampling error. • Remember, if two samples are taken from the same population and are given exactly the same treatment, there still will be some difference between the sample means. . 32
Hypothesis Testing with the Independent. Measures t Statistic (cont. ) • To prepare the data for analysis, the first step is to compute the sample mean and SS (or s, or s 2) for each of the two samples. • The hypothesis test follows the same four-step procedure. 33
Hypothesis Testing with the Independent. Measures t Statistic (cont. ) 1. State the hypotheses and select an α level. For the independent-measures test, H 0 states that there is no difference between the two population means. 2. Locate the critical region. The critical values for the t statistic are obtained using degrees of freedom that are determined by adding together the df value for the first sample and the df value for the second sample. 34
Hypothesis Testing with the Independent. Measures t Statistic (cont. ) 3. Compute the test statistic. The t statistic for the independent -measures design has the same structure as the single sample t introduced in Chapter 9. However, in the independentmeasures situation, all components of the t formula are doubled: there are two sample means, two population means, and two sources of error contributing to the standard error in the denominator. 4. Make a decision. If the t statistic ratio indicates that the obtained difference between sample means (numerator) is substantially greater than the difference expected by chance (denominator), we reject H 0 and conclude that there is a real mean difference between the two populations or treatments. 35
Hypothesis Testing with the Independent. Measures t Statistic (cont. ) • This difference is called sampling error • The hypothesis test provides a standardized, formal procedure for determining whether the mean difference obtained in a research study is significantly greater than can be explained by sampling error 36
The Homogeneity of Variance Assumption • Although most hypothesis tests are built on a set of underlying assumptions, the tests usually work reasonably well even if the assumptions are violated. • The one notable exception is the assumption of homogeneity of variance for the independent-measures t test. • The assumption requires that the two populations from which the samples are obtained have equal variances. • This assumption is necessary in order to justify pooling the two sample variances and using the pooled variance in the calculation of the t statistic. 37
Two consumer durable companies market two brands of electric iron A and B. A researcher has taken a random sample of size 35 from the first company and size 40 from the second company. The researcher computed the average life of both the brand. The variance of Sample A is 2. 1815 and sample B is 3. 0769. The mean of sample A is 62. 37 and sample B is 63. Is there a significant difference between average life of two brands A and B at 95% confidence level.
Test for difference between two Population Means Two drugs meant to provide relief to arthritis were produced in two different labs. The first drug was given to a group of 12 patients and produced an average of 8. 5 hours with a s. d of 1. 8 hours. The second drug was tested on sample of 8 patients and produced an average of 7. 9 hours with s. d of 2. 1 hours. Test the hypothesis that first drug provides a significantly higher period of relief at 5% level of significance.
Population Proportion The production manager of a company that manufactures electric heater believes that at least 10% of the heaters are defective. For testing his belief, he take a random sample of 100 heaters and find that 12 heaters are defective. He takes a level of significance as 5% for testing the hypothesis. Apply the seven steps of hypothesis testing to test his belief.
• The reputation (and hence sales) of many businesses can be severely damaged by shipments of manufactured items that contain a large percentage of defectives. For example, a manufacturer of alkaline batteries may want to be reasonably certain that fewer than 5% of its batteries are defective. Suppose 300 batteries are randomly selected from a very large shipment; each is tested and 10 defective batteries are found.
Diff. Between two population proportion • A researcher want to assess the stress level of two banks employee. He selected two banks A and B for this purpose. The working hour of bank A is 7 hours and bank B is 9 hours. the researcher has selected 40 from bank A and 10 of them have indicated high stress. The res. Has randomly selected 50 from bank B and 22 indicated high stress. Does this indicate stress level of employee of Bank B is significantly higher at 99% level of confidence.