Sampling A PRESENTATION BY GAURAV KUMAR PRAJAPAT SR
, RAJASTHAN")
Sampling A PRESENTATION BY: GAURAV KUMAR PRAJAPAT SR. AUDIT OFFICER O/O AG (AUDIT-II), RAJASTHAN JAIPUR

What is sampling? Sampling is the process of selecting units (e. g. , people, organizations) from a population of interest so that by studying the sample we may fairly generalize our results back to the population from which they were chosen.

A sample is a subset containing the characteristics of a larger population. Sample Population

Why we need sampling in Audit? Making an audit assertion with absolute certainty would be vastly expensive. There would always be some risk that audit fails to discover all material errors, even when 100% of the transactions are audited. Recognizing this, the auditor defines an audit risk that he is willing to accept Sampling in audit means testing less than 100% of the items in the population for some characteristic and then drawing a conclusion about that characteristic for the entire population.

What is ‘Statistical Sampling’? Drawing a sample with the use of statistical tools is called statistical sampling.

Why we need Statistical Sampling in Audit? statistical sampling provides greater objectivity in the sample selection and in the audit conclusion. Statistical Sampling can provide a valid and defensible methodology but it is important to match the type of sample needed to the type of analysis required. It is usually not cost effective or practicable to collect and examine all the data that might be available. Resources v/s Assurance

Why random sampling? This permits justifiable inference from the sample to the population, at quantified levels of precision. Random selection guards against bias in a way that selecting by judgment or convenience cannot. However, a random selection may not always be either possible or what is required. If Audit uses non random methods of sampling care must be taken to match clear audit objectives to the sample design to prevent introducing unintended bias.

Sampling errors and Non-sampling errors Sampling error is the error that arises in a data collection process as a result of taking a sample from a population rather than using the whole population The sampling error for a given sample is unknown but when the sampling is random, for some estimates (for example, sample mean, sample proportion) theoretical methods may be used to measure the extent of the variation caused by sampling error Non-sampling error is the error that arises in a data collection process as a result of factors other than taking a sample. Non-sampling errors have the potential to cause bias in polls, surveys or samples.

Sampling errors Vs Non-sampling errors ITEMS SAMPLING ERROR NON-SAMPLING ERROR Meaning Sampling error is a type of error, occurs due to the sample selected does not perfectly represents the population. Cause Deviation between sample mean and population mean Random Only when sample is selected. Possibility of error reduced with the increase in sample size. An error occurs due to sources other than sampling, while conducting survey activities is known as non sampling error. Deficiency and analysis of data Random or Non-random Both in sample and census. It has nothing to do with the sample size. Type Occurs Sample size

Important factors in drawing a sample Sampling Design Sampling Frame Sampling Method Size of the Population Sample Size Required level of Confidence

Sample Design Sample design covers the method of selection, the sample structure and plans for analyzing and interpreting the results. Sample designs can vary from simple to complex and depend on the type of information required and the way the sample is selected. The design may make use of the characteristics of the population, but it does not have to be proportionally representative.

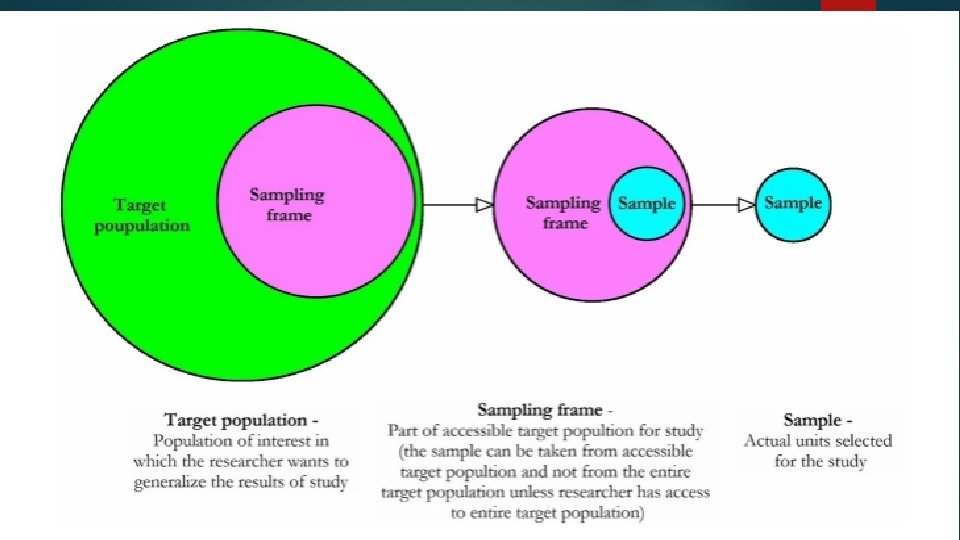
Defining the population-Sample Frame A sampling frame is a list of all units in your population. Ensure that the specification of the target population is as clear and complete as possible to ensure that all elements within the population are represented. The target population is sampled using a sampling frame like Aadhar Numbers, PAN, Unit Name, Registration Number etc. A sampling frame could also be geographical; for example postcodes have become a well-used means of selecting a sample.

Sample size For any sample design deciding upon the appropriate sample size will depend on five key factors: Confidence level - The higher the confidence level the larger the sample size. Variability in the population – The more variability the less accurate the estimate and the larger the sample size required. Margin of error or precision - The better the design, the less the margin of error and the tighter the precision but in most cases the larger the sample size. Population size –the larger the population size the lower the proportion of that population that needs to be sampled to be representative. The population proportion – the proportion of items in the population displaying the attributes that you are seeking.

Sample Size Practical limitations will often be the chief determinant of the sample size. A sample size of between 50 and 100 should ensure that the results are sufficiently reliable for the majority of purposes, although there will be occasions when a sample as small as 30 may be sufficient. Samples smaller than this fall into the category of case studies where statistical inferences to the population cannot be made, however, they can still form part of a valid and defensible methodology.

Sampling Methods Non Statistical Methods of Sampling

Non-statistical sampling is the selection of a test group that is based on the examiner's judgment, rather than a formal statistical method. For example, an examiner could use his own judgment to determine or more of the following: • The sample size • The items selected for the test group • How the results are evaluated It can make sense to use non-statistical sampling when the population size is very small. This approach is also useful in areas where specific records contain sensitive information, and so must be examined.

Some Non-Statistical Sampling Techniques 18 I Accidental/ Haphazard Sampling The auditor selects sample (audit units, bills, vouchers, Districts) without any conscious bias; the sample is expected to be representative of the population. For e. g. avoiding first and last voucher in a bundle. II Judgmental /Purposive Sampling The auditor selects sample (audit units, bills, vouchers, Departments) which in his opinion contains maximum errors; say vouchers with the highest values or vouchers of some particular treasury.

Non-statistical sampling Advantages: Practical and easy to conduct Greater application of audit experience and knowledge about the Audited Entity. Dis-advantages: Not representative of the population Can not be extrapolated Not possible to (i) assess the validity of estimates (ii) Determine sample size using statistical methods.

Statistical Sampling Each unit in the study population has a known probability (may not be equal) of being included in the sample. Advantages: It provides estimates free from personal bias It permits application of objective methods of minimizing error under the resource constraints. Allows to draw valid conclusions about population Dis-advantages: Needs sampling frame Compared to Non Prob. sampling it is difficult to apply

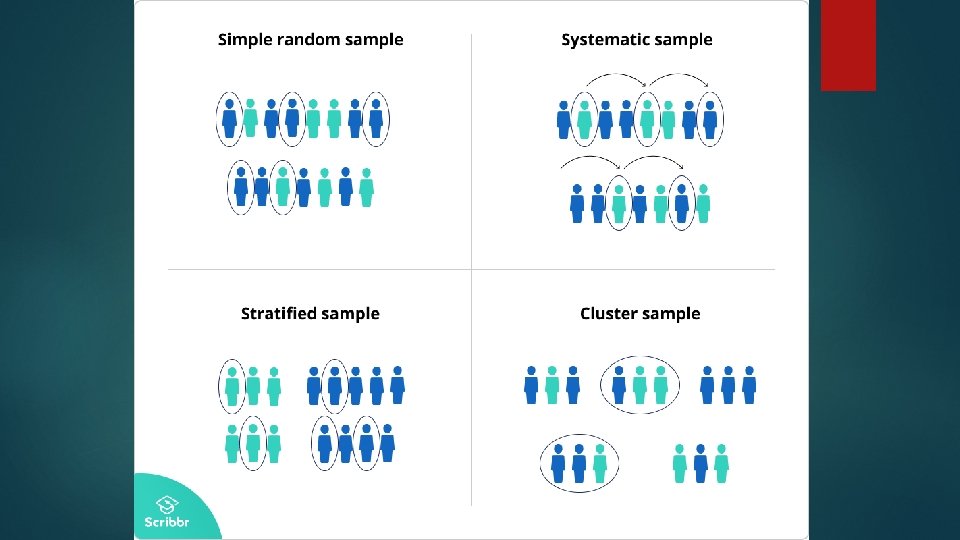
Statistical Methods of Sampling Simple random sampling Systematic Stratified Cluster sampling Multistage sampling Probability Proportional to size Quota sampling
 22 The most commonly used Statistical sampling v Principle: Equal")
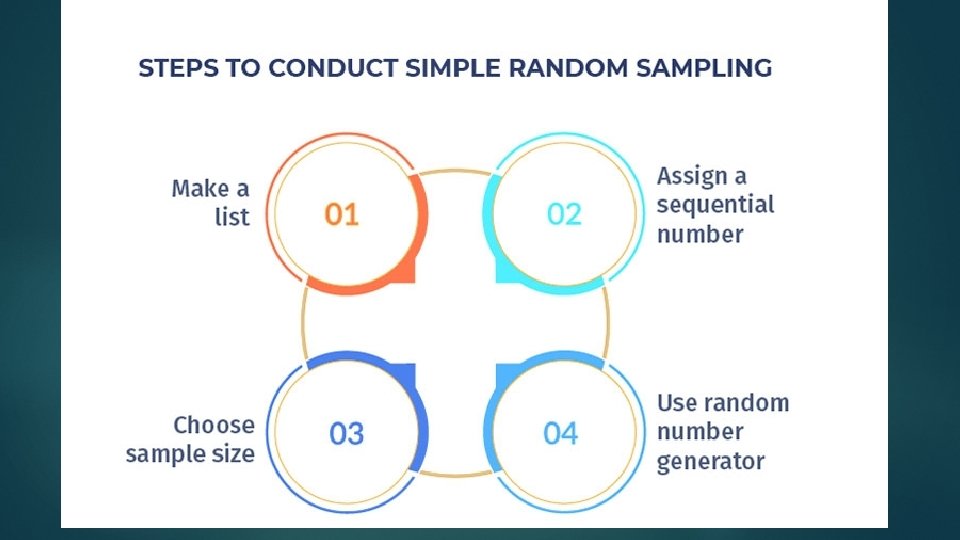
Simple random sampling (SRS) 22 The most commonly used Statistical sampling v Principle: Equal chance for each sampling unit to be included in the sample v Procedure 1. Identify all sampling units in the population – sampling frame 2. Determine sample size (n) using appropriate formula/table 3. Draw (n) units using random tables or computer programs like Excel or IDEA. v Advantages: (i) Simple (ii) Sampling error easily measured v Disadvantages: (i) Need complete list of units (ii) Not always best representative (iii) Coverage of various strata and clusters can not be insured
 First The unit is randomly selected from population. sampled unit")
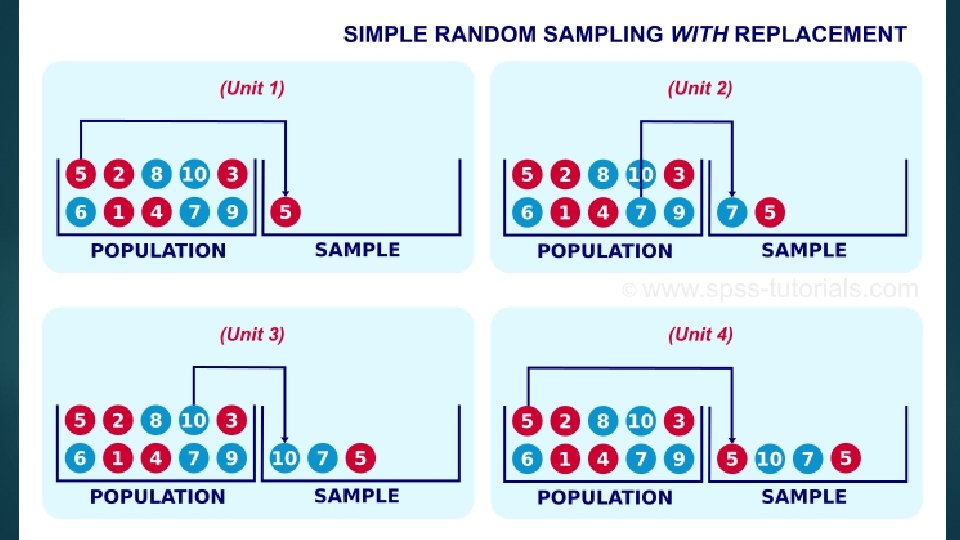
SRS with replacement (SRSWR) First The unit is randomly selected from population. sampled unit is replaced in the population. Then second unit is drawn; probability of selection of an element remains unchanged after each draw. The procedure is repeated until the requisite sample of size 'n' is drawn. In practice SRSWR is not attractive; same units can be selected more than once which may not add any value/additional information to audit. But in mathematical terms, it is simpler to relate the sample to population by SRSWR. 24
 26 Unlike SRSWR, once an element is selected as a")
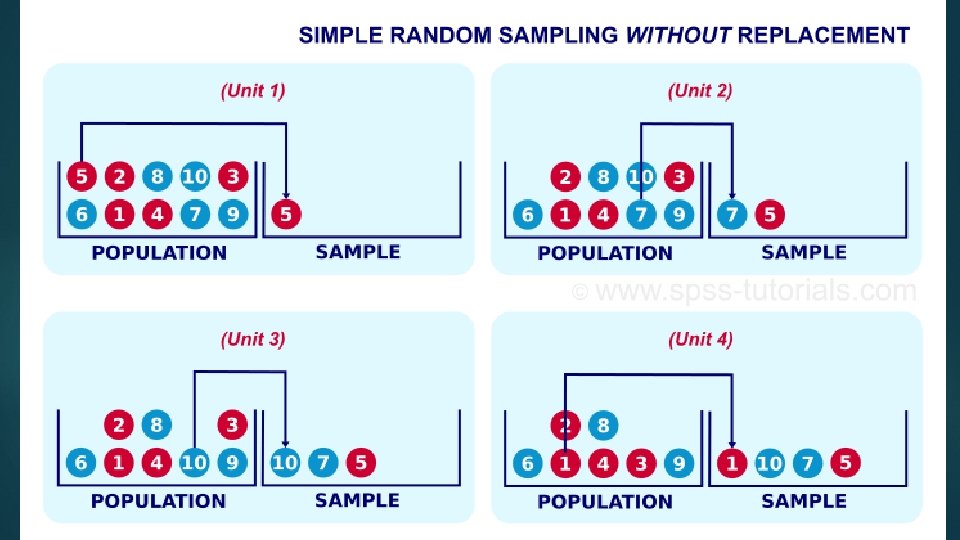
SRS without replacement (SRSWOR) 26 Unlike SRSWR, once an element is selected as a sample unit, it is not replaced in the population The selected sample units are distinct. If a sample is selected with the help of random number table; a random number selected more than once is ignored in SRSWOR Advantage of SRSWOR is that Elements are not repeated so resources are not wasted. We select a slip from 10 slips and replace the slip before selecting the next slip, then it is sampling with replacement and if we do not replace the slip before selecting the second slip, it is sampling without replacement.

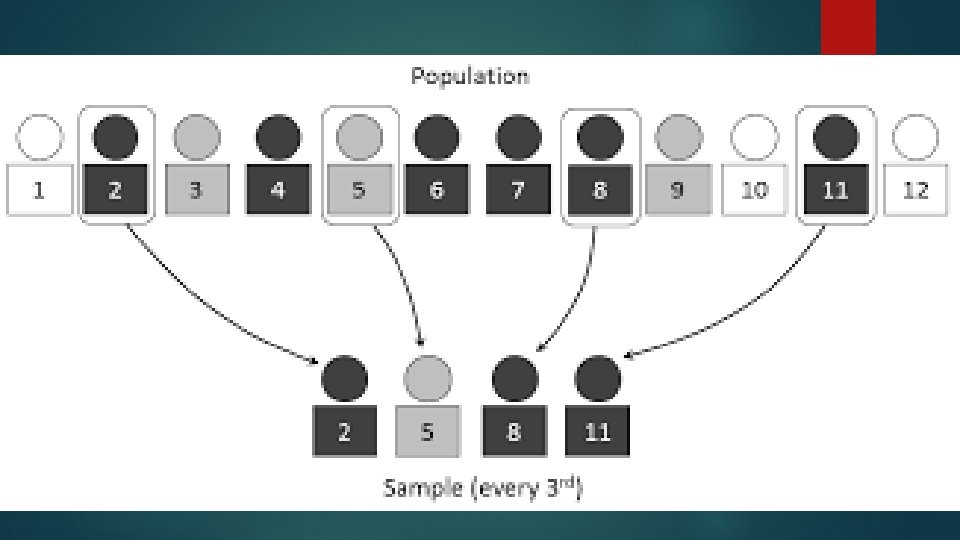
Systematic Sampling 28 Principle: In this method, first unit is drawn by random numbers; thereafter, every kth (k = N/n is sampling interval; ‘N’ is the population size and ‘n’ the sample size) unit is drawn. It gives equal chance of selection to each unit; . Procedure 1. Prepare a list of all elements in the study population (N) 2. Decide the sample size (n) 3. Determine the sampling interval ‘k’ as the integer nearest to N/n 4. Have the random start by choosing an integer ‘r’ between 1 and k. 5. Select every kth unit starting with the unit corresponding to the number ‘r’.
 Sample size")
Systematic Sampling contd. 30 Say, Target Population N= 54000 vouchers (Sampling Frame) Sample size n = 6000 Sample Fraction (K)= Target Population / Sample size =54000/6000 = 9 Number all vouchers of the population Select 1 number from 1 to 9 (here k = 9) randomly Say, number 5 is selected then 5 th voucher is selected Next 5+9=14 th, 14 + 9 = 23 rd voucher is selected and so on … 1, 2, 3, 4, 5, 6, 7, 8, 9, 10, 11, 12, 13, 14, 15, 16, 17, 18, 19, 20, 21, 22, 23, 24, 25, 26, 27, 28, 29, 30, 31, 32, 33, 34, 35 , ……. [Circular, multiple or random systematic methods also used]
 31 v Advantages – § Requires less time, sometimes")
Systematic Sampling (contd. . ) 31 v Advantages – § Requires less time, sometimes less costly than SRS § Ensures representativeness across list § Easy to implement v Disadvantages- Works well only if the complete and up-to-date frame is available and if the units are randomly arranged in the frame; for this reason the units are arranged in some order say alphabetical or in increasing/decreasing order of value before selecting a sample.
 § Stratification may")
3. Stratified sampling v Principle Classify population into homogeneous subgroups (strata) § Stratification may be done on the basis of income, age, rural-urban, Revenue-Capital, Treasuries, major heads, etc. § Draw sample (not necessarily equal) from each strata § Combine results of all strata v Advantages § More precise if variable to be studied/audited is associated with strata e. g. in MUS [Monetary Unit Sampling], variable is value of voucher which is related to strata so it is likely to give better results than SRS § All subgroups represented, allowing separate conclusion about each of them; say separate conclusion for each District/ treasury § Administrative convenience § 32
 v Disadvantages § Sampling error difficult to measure")
3. Stratified sampling (contd. . ) v Disadvantages § Sampling error difficult to measure § Loss of precision if small numbers sampled in individual heterogeneous strata v Example of stratified sampling: (i) To select BPL households for a social audit; divide the population of BPL into three categories (strata) say top 25%, Middle 50% and Bottom 25% and select separate samples from 3 categories/strata. (ii) Dividing contracts into value ranges and then selecting separate samples from each value range; say 100% contracts from highest value range, 50% contracts from next highest and so on. (iii) Monetary Unit Sampling (MUS) is also a case of Stratified Sampling where the population (vouchers) is divided into strata based on values. 33
*Ni where ni")
Allocation of Sample size in Stratified sampling Proportional Allocation: ni = (n/N)*Ni where ni is size of sample from ith strata, Ni is population of ith strata; n is sample size and N is the population size Optimum allocation ni’s are chosen so as to (a) Maximise the precision for fixed sample size n; (b) Maximise the precision for fixed cost (c) Minimise the total cost for fixed desired precision v Disproportionate Allocation No. of items selected from a stratum is independent of its size. v A large sample would be required from a stratum if 1. Stratum size Ni is large. 2. Stratum variability Si (Variance or Std. Dev. ) is large. v 34

Exercise: Proportional Allocation Number of Vouchers coming from 3 treasuries are 300, 200 and 500 respectively. Draw a Proportional Stratified sample of size 60 using the random number table. Solution: Here N 1 = 300, N 2 = 200 and N 3 = 500; N = 1000 using ni = (n/N)*Ni; i = 1, 2, 3 n 1 = (60/1000)* 300 = 18, n 2 = (60/1000)* 200 = 12 and n 3 = (60/1000)* 500 = 30. Thus a sample of 18, 12 and 30 vouchers will be selected from these three strata using random number table. 35

4. Cluster Sampling The population is divided into non-overlapping groups known as Clusters are commonly formed on the basis of geographical /administrative/political boundaries, e. g. GPs, Blocks, Departments may act as clusters. Procedure List all the clusters/groups of sampling units of the study population Select Random Sample of clusters Survey all or proportion of sampling units of selected clusters For e. g. selecting some Districts from a state and auditing all the units (say PHCs) under them leaving out the units of other Districts; finally drawing conclusion about the entire state. 36
 v Advantages Simple: Complete list of units (sampling frame)")
Cluster Sampling (contd. . ) v Advantages Simple: Complete list of units (sampling frame) is required only for clusters selected in the sample. Less travel/resources required. v Disadvantages Imprecise if clusters homogeneous (Large sample as compared to SRS is required for the same precision in this case). Sampling error difficult to measure. 37
")
The two stages of a Cluster Sample First stage: Probability proportional to size (PPS) • Find out the number of clusters to be included – How? • Compute cumulative totals of the populations for each cluster with a grand total • Divide the grand total by the number of clusters and obtain the sampling interval (k) • Choose a random number less than or equal to k and identify the first cluster • Add the sampling interval and identify the second cluster • By repeating the same procedure, identify all the clusters to be selected here a cluster may be selected more than once v Second stage: Simple Random sampling v In each selected cluster select a random sample of required number of units using a sampling frame of Basic Sampling Units in the cluster. v 38
 of")
Use the following Random Number Table to draw a simple random sample (i) of 15 vouchers without replacement and (ii) 45 vouchers with replacement; from a treasury having 500 vouchers. Part of Random Number table 2952 6641 3992 9792 7979 5911 3170 5624 4167 9524 1545 1396 7203 5356 1300 2693 2370 7483 3408 2762 3563 1089 6913 7691 0560 5246 1112 6107 6008 8126 4233 8776 2754 9143 1405 9025 7002 6111 8816 6446 39

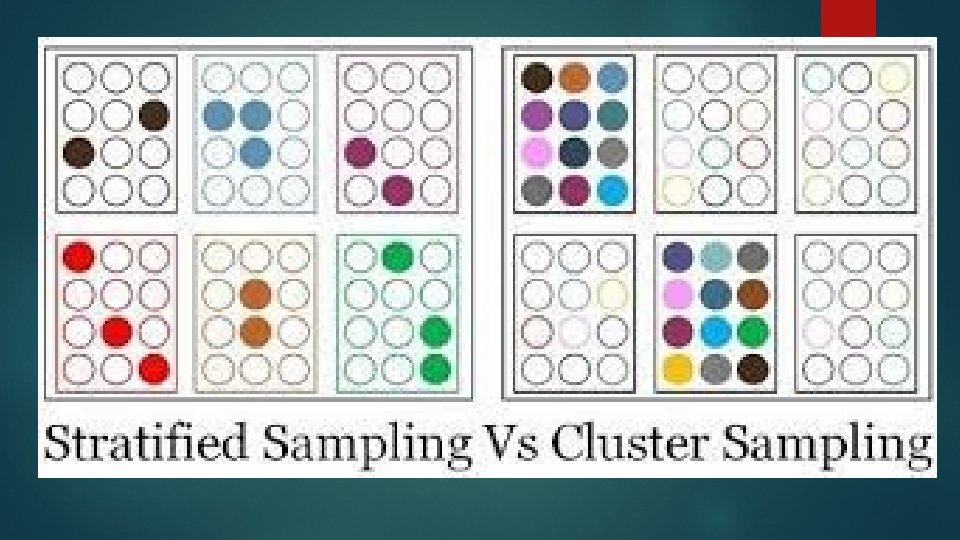
Stratified Sampling Vs Cluster Sampling • In both stratified and cluster sampling, the population is divided into well-defined groups but criteria for Division into groups are different. § Stratified sampling is used when each group has small variation (more homogeneity) within itself but wide variation between the groups – variation is measured by Std. Deviation § Cluster Sampling is used in the opposite case, when there is considerable variation within each group but the groups are essentially similar to each other. § In Stratified sampling estimate of each and every strata is also available but not in cluster sampling. 40

Stratified Vs Cluster Sampling - Cont. • Suppose in a state there are 20 Districts; • We take a sample of 15 villages in each of the 20 Districts to audit the implementation of MGNREGA • In all 300 villages are selected and studied • This is an example of stratified sampling when estimates of the desired characteristics for each of the Districts (Strata) would also be available • On the other hand let us select 5 districts out of 20 and take a sample of 60 villages in each of the selected Districts • In all 300 villages are selected and studied • This is an example of Cluster Sampling • In this case estimates of the desired characteristics for each of the Districts (Clusters) would not be available. 41

Selection of PPS Sample Let’s take treasuries as clusters, the objective is to select 15 clusters – i. e. 15 treasuries using PPS; size being no. of vouchers in a treasury. Procedure: List all Treasuries with number of vouchers in them; find the cumulative totals of number of vouchers: Treasury No. of vouchers Cumulative total 1 34 34 2 60 94 3 30 124 4 76 200 5 315 515 and so on …. Total 2, 358 Divide the cumulative total = 2358 by 15 [no. of clusters to select] 2, 358 /15= 157. 2; Sampling Interval ‘k’ is 157 43
![Selection of PPS Sample contd… Find a three digit random number [less than 157]](http://slidetodoc.com/presentation_image_h2/ac30850df232a84c074b62eca957b69a/image-44.jpg "Selection of PPS Sample contd… Find a three digit random number [less than 157]")
Selection of PPS Sample contd… Find a three digit random number [less than 157] say 123 Select the first cluster corresponding to 123 in Cumulative Total Select the remaining clusters from the cumulative distribution by adding 157 (sampling interval) each time. Treasury no. of vouchers Cum. total Cluster Selected 3 30 124 * selected 4 76 200 5 315 515 ** selected twice (2 nd 123+157=280) (3 rd 280+157=437) Second Stage: In each selected cluster (treasury) choose required number of vouchers by random or systematic selection. 44

Multistage sampling – an example To select a sample of ‘n’ households in the country: first stage units may be states, the second stage units (SSUs) Distts. from selected states, third stage units villages from selected districts, ultimate stage units are households in the selected villages v Advantages § Most feasible approach for large populations § No complete listing of units is required at various stages; second stage frame is required only for the selected first stage units and so on. § This leads to great saving in operational cost. v Disadvantages § Sampling error difficult to measure § May be less efficient compared to a suitable single stage sampling of the same size. v 45
 - systematic")
Monetary Unit Sampling MUS is nothing but Probability Proportional to Size (PPS) - systematic sampling, where one assigns high inclusion probability to the transactions having high value. In MUS method the sampling unit is not an invoice or any other physical unit, but an individual rupee. However, when the individual rupee is selected, the auditor does not verify just that particular rupee, but the rupee acts as a hook and drags the whole invoice with it. 47
 Cumulative total Random")
Monetary Unit Sampling MUS S. No. Unit Sales (Rs in crore) Cumulative total Random No. 1 A 50 50 002 2 B 100 150 134 3 C 5 155 4 D 20 175 5 E 10 185 Two out of 5 units are to be selected Sample using simple random sampling: UNIT C and UNIT E Sample using monetary random sampling: UNIT A and Unit B Probability of selection of UNIT B in SRS : 1/5 = 20% Probability of selection of UNIT B in MUS : 100/185 = 54. 05 %

Attribute Sampling and Variable Sampling Attribute Sampling In attribute sampling, data is in the “attribute” form, and the result either conforms or does not conform. It is a method of measuring quality that consists of noting the presence or absence of some characteristic (attribute) in each of the units under consideration. Attribute sampling checks whether an item is defective or not. It’s a yes or no answer.

Attribute Sampling and Variable Sampling In variable sampling, data is in the “variable” form, and the result is rated on a continuous scale that measures the degree of conformity. Variable sampling is about checking “how much”, “how good”, or “how bad”. Let’s say you need to provide the average adult male and female height by country. Obviously you cannot measure the height of every adult in every country. So, you’ll take a sample of males and females from each country, measure their height and provide the statistics. The actual height of adults in that sample would be variable data, but whether an adult is above 6 ft tall or not, is attribute data.
")
Random Numbers A random number table is a series of digits (0 to 9) arranged randomly in rows and columns Rand’s random numbers

Discovery sampling involves the use of a sample to determine whether a percentage error does not exceed a designated percentage of the population. Discovery sampling to assure that the proportion of units with a particular attribute (i. e. , error) is not in excess of a given percentage of the population. Three determinations needed to use discovery sampling are: (1) size of population; (2) minimum unacceptable error rate; and (3) confidence level. Sample size is provided by a sampling table. If none of the random samples has an error, the auditor can conclude that the actual error rate is below the minimum unacceptable error rate. Usually, discovery sampling is employed to identify batches of documents requiring detailed examination. Assume the auditor desires to determine the correctness of costing of documents from 20 branches. A discovery sample can uncover those batches having, for example, a 95% probability of an error rate below 1%. The auditor will accept those batches as satisfactory and examine in detail the remaining batches.

Hypothesis Testing A claim or premise we want to test. Hypothesis testing is an act in statistics whereby an analyst tests an assumption regarding a population parameter. Hypothesis testing is used to assess the plausibility of a hypothesis by using sample data. Statistical analysts test a hypothesis by measuring and examining a random sample of the population being analyzed. In hypothesis testing, an analyst tests a statistical sample, with the goal of providing evidence on the plausibility of the null hypothesis. Statistical analysts test a hypothesis by measuring and examining a random sample of the population being analyzed. All analysts use a random population sample to test two different hypotheses: the null hypothesis and the alternative hypothesis.
 is usually a hypothesis of equality")
Hypothesis Testing The null hypothesis (currently accepted value) is usually a hypothesis of equality between population parameters. (The acceptable thing) The alternative hypothesis (research hypothesis) is effectively the opposite of a null hypothesis. (The new claim to be tested) Thus, they are mutually exclusive, and only one can be true. However, one of the two hypotheses will always be true. If, for example, a person wants to test that a penny has exactly a 50% chance of landing on heads, the null hypothesis would be that 50% is correct, and the alternative hypothesis would be that 50% is not correct. Mathematically, the null hypothesis would be represented as Ho: P = 0. 5. The alternative hypothesis would be denoted as "Ha" and be identical to the null hypothesis, except with the equal sign struck-through, meaning that it does not equal 50%.

Normalisation It is a scaling technique method in which data points are shifted and rescaled so that they end up in a range of 0 to 1. It is also known as min-max scaling. The formula for calculating normalized score: X new = (X — X min)/ (X max — X min) Here, X max and X min are the maximum and minimum values of the feature respectively.

Normalisation An exam is conducted in two shifts shift A and shift B and questions in shift A were relatively easy as compared to that of shift B. Because questions were relatively easy in shift A maximum marks scored by a candidate out of 300 in shift A is 280 and minimum is 80 on the other hand maximum and minimum marks scored by a candidate in shift B is 250 and 50 respectively. So we cannot compare the score of a candidate who scored 150 in shift A to a candidate who scored the same in shift B. Hence we normalize the scores The normalized score of a candidate who scored 150 in shift A will be calculated as follows For simplicity sake let’s name it Xa Xa =150 -Xmin/(Xmin-Xmax) Xmax = 280 Xmin = 80 Putting these values we get Xa= 150– 80/(280– 80) Xa =0. 35

Normalisation The normalized score of a candidate who scored 150 in shift B will be For simplicity sake let’s name it Xb Xb=150 -Xmin/(Xmin-Xmax) Xmax = 250 Xmin = 50 Putting these values we get Xb = 150– 50/(250– 50) Xb =0. 5

Scatter Diagram The scatter diagram graphs pairs of numerical data, with one variable on each axis, to look for a relationship between them. If the variables are correlated, the points will fall along a line or curve. The better the correlation, the tighter the points will hug the line. https: //www. ncbi. nlm. nih. gov/pmc/articles/PMC 374386/#: ~: text=The%20 m ost%20 commonly%20 used%20 techniques, the%20 form%20 of%20 an%20 e quation.


IDEA Sampling Capabilities IDEA offers five sampling methods together with the ability to calculate sample sizes based on parameters entered and to evaluate the results of sampling tests. Sampling methods include systematic, random, stratified random, monetary unit and classical variables. Attribute Planning and Evaluation can be used to calculate sample sizes, confidence levels, and error limits.

Thank you for giving this opportunity to interact with you and feel free to contact me in case of any doubt regarding sampling Mobile 9461588507
- Slides: 61