Sample Spaces Venn Diagrams Tree Diagrams and TwoWay


.")


 = Number of Favorable")


- Slides: 24
Sample Spaces, Venn Diagrams, Tree Diagrams and Two-Way Tables CCM 2 Unit 6: Probability
Sample Space • Sample Space: The set of all possible outcomes of an experiment. • List the sample space, S, for each of the following: a. Tossing a coin • S = {H, T} b. Rolling a six-sided die • S = {1, 2, 3, 4, 5, 6} c. Drawing a marble from a bag that contains two red, three blue and one white marble • S = {red, blue, white}
Unions of Sets •
Intersections of Sets •
Venn Diagrams One way to represent or visualize sets is to use Venn diagrams:
Use the Venn Diagram A 1 3 5 1. What are the elements of set A? {1, 2, 3, 4, 5} 2. What are the elements of set B? {2, 4, 6, 8, 10} 3. Why are 2 and 4 in both sets? B 2 6 8 4 10
In a class of 60 students, 21 sign up for chorus, 29 sign up for band, and 5 take both. 15 students in the class are not enrolled in either band or chorus. •
A survey of used car salesmen revealed the following information: 24 wear white patent-leather shoes 28 wear plaid trousers 20 wear both of these things 2 wear neither of these things Create a Venn diagram.
Don’t forget these! 2 White Shoes 4 There should be 24 total in the circle, so subtract here! Plaid trousers 20 Always start with the intersection! 8 There should be 28 total in the circle, so subtract here!
How many salesmen were surveyed? 2 + 4 + 20 + 8 = 34 How many salesmen wore both plaid trousers and white shoes? 2 How many salesmen didn’t wear plaid trousers 26
Complement of a set • The complement of a set is the set of all elements NOT in the set. • The complement of a set, A, is denoted as AC or A’ • Ex: S = {…-3, -2, -1, 0, 1, 2, 3, 4, …} A = {…-2, 0, 2, 4, …} If A is a subset of S, what is AC? AC = {-3, -1, 1, 3, 5, …}
Two-Way Table: categorical data organized in 2 dimensions
Android vs. i. Phone -On ONE post-it, please write your name (first and last). -Stick it to the appropriate quadrant on the whiteboard.
Android vs. i. Phone Android Female Male Total i. Phone Total
Using the class data, answer & discuss: 1. 2. 3. 4. 5. 6. How many students total from this class prefer the Android? How many students prefer the i. Phone? How many students are females? How many students are females AND prefer the Android? How many students are males AND prefer the i. Phone?
For example – a fair coin is flipped twice 1 st 2 nd H HH T HT H TH T TT H T Possible Outcomes
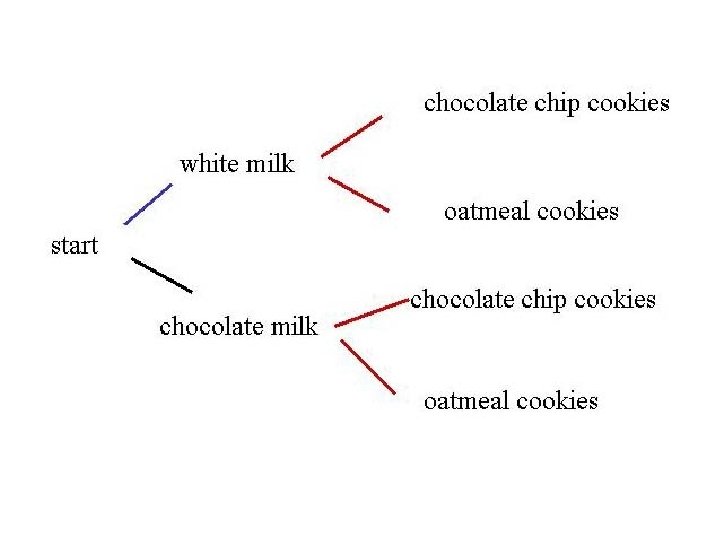
Now you try one! Let’s make a tree diagram to show the different combinations you could make if you could select between white and chocolate milk and either chocolate chip or oatmeal cookies.
Basic Probability
Basic Probability • Probability of an event occurring is: P(E) = Number of Favorable Outcomes Total Number of Outcomes Your answer can be written as a fraction or a %. (Remember to write it as a %, you need to multiply the decimal by 100) • We can use sample spaces, intersections, unions, and compliments of sets to help us find probabilities of events. Ø Note that P(AC) is every outcome except (or not) A, so we can find P(AC) by finding 1 – P(A) Ø Why do you think this works?
An experiment consists of tossing three coins. 12. List the sample space for the outcomes of the experiment. {HHH, HHT, HTH, HTT, THH, THT, TTH, TTT} 13. Find the following probabilities: a. b. c. d. e. P(all heads) 1/8 or 12. 5% P(two tails) 3/8 or 37. 5% P(no heads) 1/8 or 12. 5% P(at least one tail) 7/8 or 87. 5% How could you use compliments to find d? The compliment of at least one tail is no tails, so you could do 1 – P(no tails) = 1 – 1/8 = 7/8 or 87. 5%
A bag contains six red marbles, four blue marbles, two yellow marbles and 3 white marbles. One marble is drawn at random. 14. List the sample space for this experiment. {r, r, r, b, b, y, y, w, w, w} 15. Find the following probabilities: a. P(red) 2/5 or 40% b. P(blue or white) 7/15 or 47% c. P(not yellow) 13/15 or 87% (Note that we could either count all the outcomes that are not yellow or we could think of this as being 1 – P(yellow). Why is this? )
Given the Venn Diagram below, find the probability of the following if a student was selected at random: 16. ) P( blonde hair) 13/26 or ½ or 0. 5 or 50% 17. ) P(blonde hair and blue eyes) 8/26 or 4/13 or 0. 308 or 30. 8% 18. ) P(blonde hair or blue eyes) 15/26 or 0. 577 or 57. 7% 19. ) P(not blue eyes) 16/26 or 8/13 or 0. 615 or 61. 5%