Sample Size Estimation Presentation Plan Definitions Why do


 § Time (Birth date between")


 • Exposure/susceptibility v. Place (urban vs.")


 §")


 of units § In")


- Slides: 63
Sample Size Estimation
Presentation Plan • • • Definitions Why do we use samples? Concept of representativeness Main methods of sampling Sampling error Sample size calculation
EPIDEMIOLOGIC STUDY TYPES OBSERVATIONAL STUDIES DESCRIPTIVE • Case series • Cross-sectional ANALITICAL • Case control studies • Cohort studies EXPERIMENTAL STUDIES • Randomised controlled trials • Field trials
Randomised Controlled Trials= RCT Disease New treatment Randomization Cure Patients Diseased Standart treatment Araştırmanın yönü Time Cure
Cohort Studies Disease + Cause + Disease - Time Disease + Cause Disease -
Case-Control Studies a b c d From outcome to cause Smoking and Lung Ca; Doll &Hill, 1950
Population Data Collection Sampling Sample Cross-sectional Studies Cause+ Outcome a+ Cause+ Outcome- b Cause. Outcome+ c Caused Outcome-
DEFINING THE STUDY GROUP FOR DIFFERENT STUDY TYPES v Cross-sectional studies Target population/Sample v Case-control studies Diseased and healthy v Cohort studies People exposed and unexposed v Clinical controlled trials Defining the intervention and control groups among the suitable and voluntered patients (Randomisation)
Which risk measure can be estimated from which study type?
Sample size estimation for a descriptive survey Simple random / systematic sampling z² * p * q n = -------d² 1. 96²*0. 15*0. 85 -----------0. 03² = 544 Cluster sampling z² * p * q n = g* -------d² z: alpha risk express in z-score p: expected prevalence q: 1 - p d: absolute precision g: design effect 2*1. 96²*0. 15*0. 85 = 1088 ------------0. 03²
v In studies that we test hypothesis or compare groups statistical power should be taken into account v Sample size formulas include α or β (Type 1 or Type 2 error)
POWER Ho=Null hypothesis ce n ca Decision i if n g Si l e v le H 1= Alternative hypothesis Reality H 0 True H 0 False ct e d ER y to nce W d e PO stu iffer he nt d t True type II error f o H 0 Accept negative ca i y f lit gni i 1 - Ab si tip I error H 0 Reject True positive 1 -
SAMPLE SIZE CALCULATION Using OPENEPI http: //www. openepi. com/Menu/OE_Menu. htm
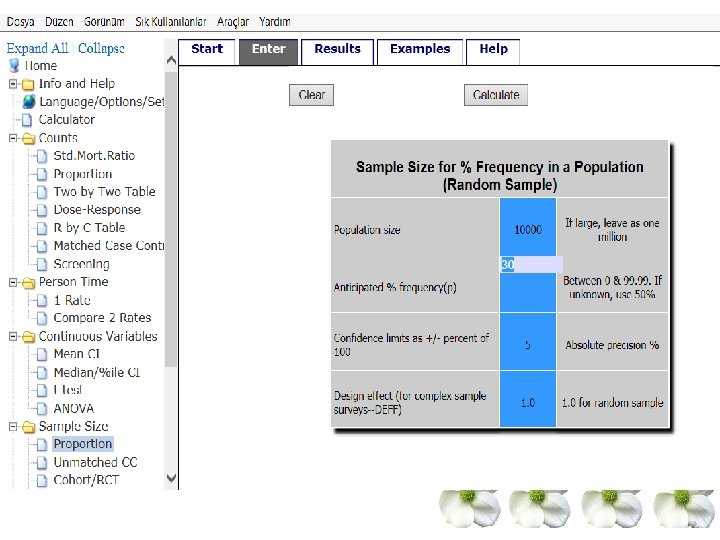
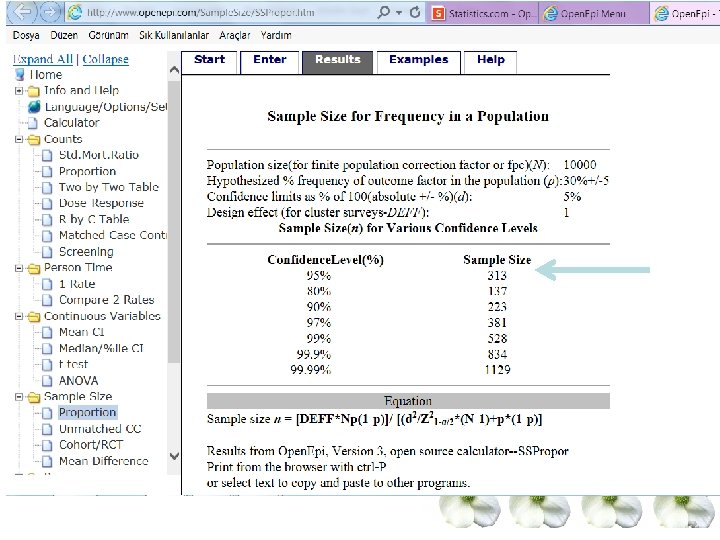
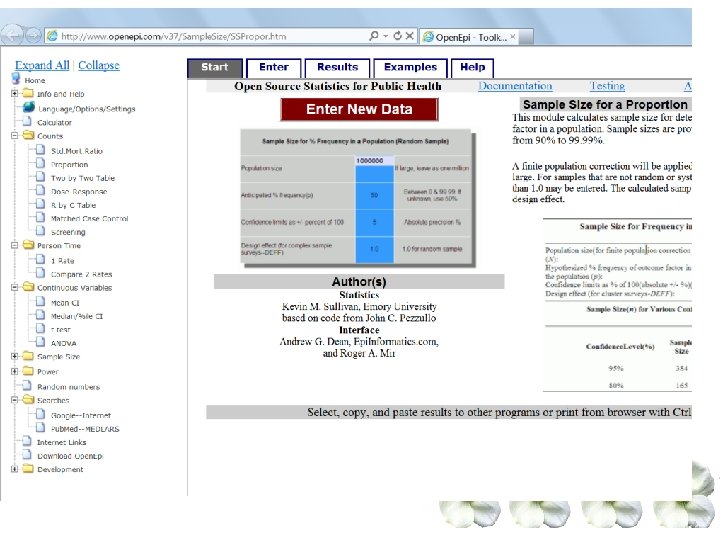
Question 1 v A researcher plans a survey to determine the prevalence of hypertension among women aged 15 and over in Çeşme. What kind of information she needs to estimate the number of women to include the study? v Population of over 15 years women: 10 000 v Prevalence of hypertension reported in other studies: %30 v Absolute precision: %5
Steps Open. Epi Sample size & proportion Enter new data Size of the Population Expected frequency Worst acceptable result Calculate
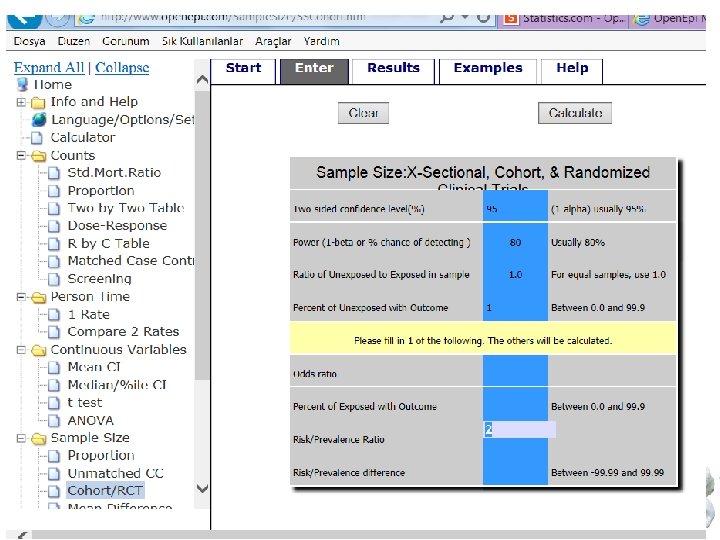
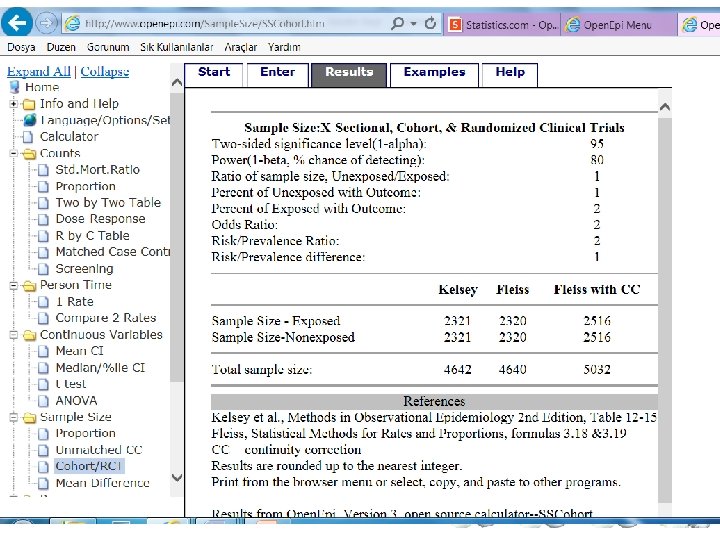
Question 2 In a cohort study the association between oral contraceptives and breast cancer risk is evaluated. What kind of information we need to calculate the sample size? v Breast cancer incidence rate is %1 in women who did not use OCA v Significance level : %5) v Statistical power(1 -β)=%90 v RR= 2. 0
Steps Open. Epi Sample size & Cohort/RCT Enter new data Calculate
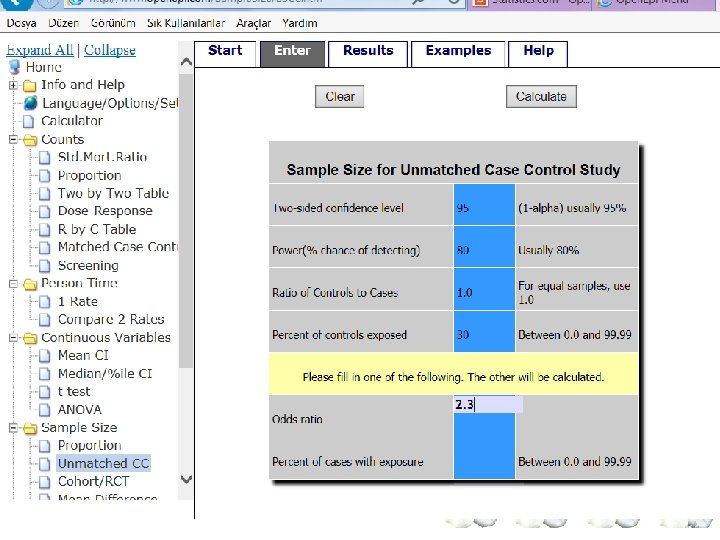
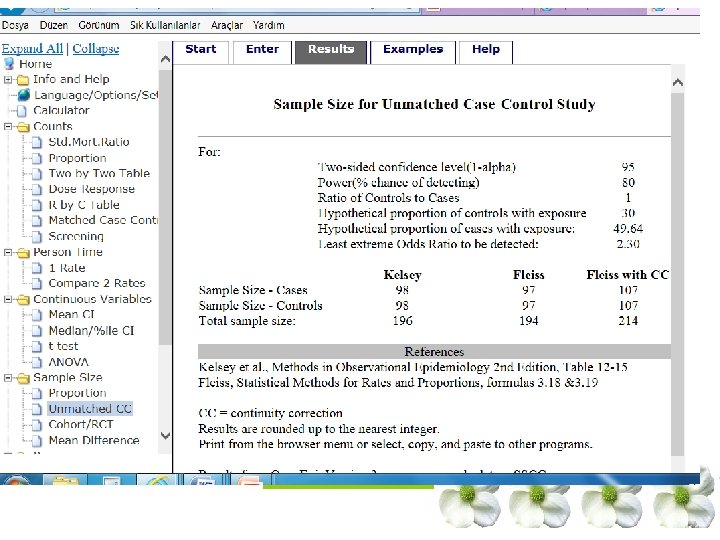
Question 3 A study aims to determine the risk of smoking during pregnancy on congenital urinary deformation. What kind of information are needed to estimate the number of cases and controls for the study? v Congenital urinary abnormality OR of smoking during pregnancy : 2. 3 from previous studies v Smoking during pregnancy%30 v Confidence level: %95 v Statistical power: %80
Steps Open. Epi Sample size & Unmatched CC Enter new data Calculate
Sampling Methods Belgin Ünal Dokuz Eylül University Faculty of Medicine Department of Public Health, İzmir
Target Population and Sample Target Population Sample
TARGET POPULATION –STUDY POPULATION § Geographically (Narlıdere Health District) § Time (Birth date between Jan 1 and 31 Dec 2011) § Personal characteristics (age, sex, etc) (children under 5 yrs of age)
What is sampling? Procedure by which some members of a given population are selected as representatives of the entire population
Sampling terms Sampling unit v. Subject under observation on which information is collected § Example: Children <5 years, hospital discharges, health events… Sampling fraction v. Ratio between the sample size and the population size § Example: 100 out of 2000 (5%)
Sampling terms Sampling frame v. Any list of all the sampling units in the population § List of households, health care units… Sampling scheme v. Method of selecting sampling units from sampling frame § Randomly, convenience sample…
Why do we use samples ? Get information from large populations § At minimal cost § At maximum speed § At increased accuracy § Using enhanced tools
Sampling Precision Cost
What we need to know v Concepts § Representativeness § Sampling methods § Choice of the right study design v Calculations § Sampling error § Design effect § Sample size
Sampling and representativeness Study on prevalence of chlamydial infection in women in Berlin Female population of 4 city wards Women Female population of Berlin Target Population Sampling Population Sample
Representativeness v. Person • Demographic characteristics (age, sex…) • Exposure/susceptibility v. Place (urban vs. rural. . ) v. Time • Seasonality • Day of the week • Time of the day Ensure representativeness before starting, confirm once completed !!!!!!
Types of samples v. Non-probability samples v. Probability samples
Non probability samples v. Quotas • Sample reflects population structure • Time/resources constraints v. Convenience samples (purposive units) • Biased • Best or worst scenario Probability of being chosen : unknown
Probability samples v. Random sampling § Each subject has an equal probability of being chosen § Reduces possibility of selection bias § Allows application of statistical theory to results
Sampling error v. No sample is the exact mirror image of the population v. Magnitude of error can be measured in probability samples v. Expressed by standard error § of mean, proportion, differences, etc v. Function of § amount of variability in measuring factor of interest § sample size
Quality of an estimate Precise & valid No precision Random error ! Precise but not valid Systematic error (Bias) !
Example Measuring height: 179 v. Measuring tape hold differently by different 178 investigators 177 → loss of precision § standard error v. Tape shrunk/wrong → systematic error § bias (cannot be corrected afterwards!) 176 175 174 173
Methods used in probability samples v. Simple random sampling v. Systematic sampling v. Stratified sampling v. Multistage sampling v. Cluster sampling
Simple random sampling v. Principle – Equal chance of drawing each unit v. Procedure – Number all units – Randomly draw units
Simple random sampling v. Advantages – Simple – Sampling error easily measured v. Disadvantages – Need complete list of units – Does not always achieve best representativeness – Units may be scattered
Simple random sampling Example: evaluate the prevalence of tooth decay among the 1200 children attending a school v. List of children attending the school v. Children numerated from 1 to 1200 v. Sample size = 100 children v. Random sampling of 100 numbers between 1 and 1200 How to select randomly?
Simple random sampling
Table of random numbers
Systematic sampling v. N = 1200, and n = 60 sampling fraction = 1200/60 = 20 v. List persons from 1 to 1200 v. Randomly select a number between 1 and 20 (ex : 8) 1 st person selected = the 8 th on the list 2 nd person = 8 + 20 = the 28 th etc. . .
Systematic sampling
1 2 16 17 31 3 4 18 19 32 33 46 47 5 48 6 20 34 35 49 50 7 8 21 22 36 51 23 37 38 52 53 9 24 39 54 10 11 12 25 26 27 40 55 41 42 ……. . 13 28 43 14 15 29 44 45 30
Systematic sampling
Stratified sampling v. Principle : § Classify population into internally homogeneous subgroups (strata) § Draw sample in each strata § Combine results of all strata
Example: Stratified sampling v. Determine vaccination coverage in a country v. One sample drawn in each region v. Estimates calculated for each stratum v. Each stratum weighted to obtain estimate for country (average)
Multiple stage sampling Principle v= consecutive samplings vexample : sampling unit = household § 1 rst stage : drawing areas or blocks § 2 nd stage : drawing buildings, houses § 3 rd stage : drawing households
Cluster sampling v. Principle § Random sample of groups (“clusters”) of units § In selected clusters, all units or proportion (sample) of units included
Example: Cluster sampling Section 1 Section 2 Section 3 Section 5 Section 4
Cluster sampling v. Advantages § Simple as complete list of sampling units within population not required § Less travel/resources required v. Disadvantages § Imprecise if clusters homogeneous and therefore sample variation greater than population variation (large design effect) § Sampling error difficult to measure
Selecting a sampling method v. Population to be studied § Size/geographical distribution § Heterogeneity with respect to variable v. Level of precision required v. Resources available v. Importance of having a precise estimate of the sampling error
Steps in estimating sample size • • • Identify major study variable Determine type of estimate (%, mean, ratio, . . . ) Indicate expected frequency of factor of interest Decide on desired precision of the estimate Decide on acceptable risk that estimate will fall outside its real population value • Adjust for estimated design effect • Adjust for expected response rate
Sample size formula in descriptive survey Simple random / systematic sampling z² * p * q n = -------d² 1. 96²*0. 15*0. 85 -----------0. 03² = 544 Cluster sampling z² * p * q n = g* -------d² z: alpha risk express in z-score p: expected prevalence q: 1 - p d: absolute precision g: design effect 2*1. 96²*0. 15*0. 85 = 1088 ------------0. 03²
REFERENCES v Portney LG, Watkins, MP. Foundations of Clinical Research: Applications to Practice v Douglas G. Altman. Practical Statistics for Medical Research