Sample BoxandWhisker Plot Definition A graph that displays

Sample Box-and-Whisker Plot Definition: A graph that displays the highest and lowest quarters of data as whiskers, the middle two quarters of the data as a box, and the median. 1 st quartile, the median of the lower half of the data set lower extreme, or minimum value • • 3 rd quartile, the median of the upper half of the data set 2 nd quartile, the median of the data set • upper extreme, or maximum value • ES: Explicitly assess information and draw conclusions •

Reading a Box-and-Whisker Plot Example 1: Number of DS games at home • 10 12 • • 14 16 • 18 20 Questions: 1. ) What is the largest data value (upper extreme)? 2. ) What is the lowest data value (lowest extreme)? • 22 24

• 10 12 • • 14 16 • 18 20 • 22 3. )What is the range of data values? 4. ) hat is the first quartile? 5. ) hat is the median of the data set? 6. ) hat is the third quartile? 7. ) About what fraction of the values are greater than 20? 24
 What is the median rental costs? 2. ) What is the range")
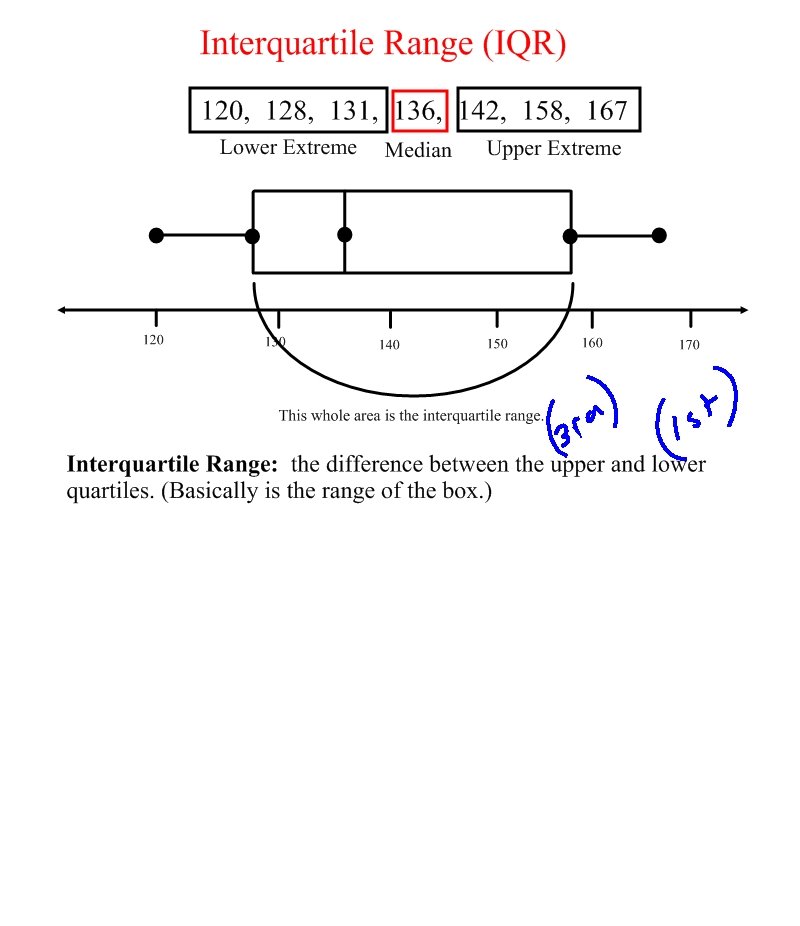
1. ) What is the median rental costs? 2. ) What is the range of rental costs? 3. ) What is the 3 rd quartile? 4. ) About what fraction of the rental costs are between $400 and $450? 5. ) What is the interquartile range (IQR)?

The box and whiskers plots below represent the number of points scored in each game of the 20012002 season for the New England Patriots and the St. Louis Rams. 1. ) Which team has a higher median points per game? Explain your answer. 2. ) What was the lowest number of points scored per game for each team? The highest? 3. ) What is the interquartile range (IQR) for the New England Patriots? 4. ) Which team has a higher 1 st quartile? Explain.

• • 8 10 12 • • 14 16 • 18 20 Demonstrate Understanding: 1. ) What is the range? 2. ) What is the first quartile? 3. ) What is the interquartile range? 4. ) In a Box-and-Whisker Plot, can we tell how many values are in a data set? 22
- Slides: 7