
Sallys demand curve Quantities of coffee demanded Sallys




- Slides: 10
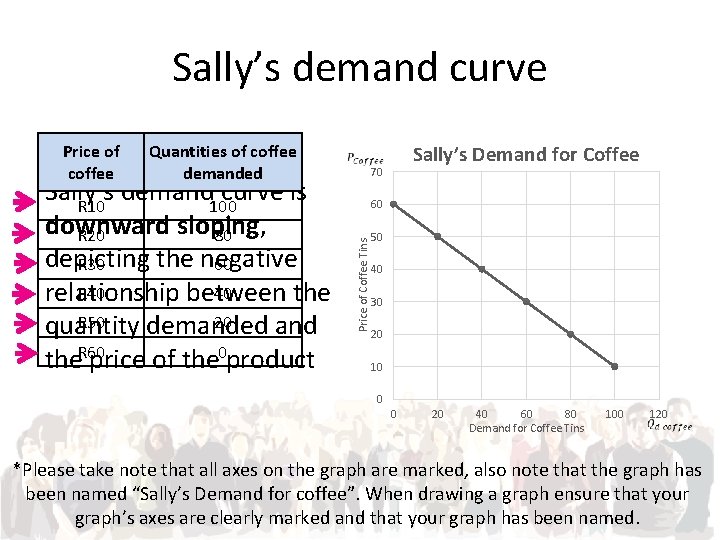
Sally’s demand curve Quantities of coffee demanded Sally’s demand curve is R 10 100 downward sloping, R 20 80 depicting the negative R 30 60 R 40 40 relationship between the R 50 20 quantity demanded and R 60 0 the price of the product Sally’s Demand for Coffee 70 60 Price of Coffee Tins Price of coffee 50 40 30 20 10 0 0 20 40 60 80 Demand for Coffee Tins 100 120 *Please take note that all axes on the graph are marked, also note that the graph has been named “Sally’s Demand for coffee”. When drawing a graph ensure that your graph’s axes are clearly marked and that your graph has been named.
Market Demand • Firms are interested in their market as a whole as opposed to an individual consumer’s demand, they need a market demand curve • The market demand is the sum of all the individual demands • The market demand curve has the same characteristics of the individual demand curve with the exception that the number of prospective buyers become a factor as opposed to the number of people in an individual household. • To determine the market demand for coffee, we will assume that there are 5 consumers of coffee tins in the market. Sally, Norma, Thando, Jessica and Refilwe, they all have their own demand preferences as illustrated in the next graph.
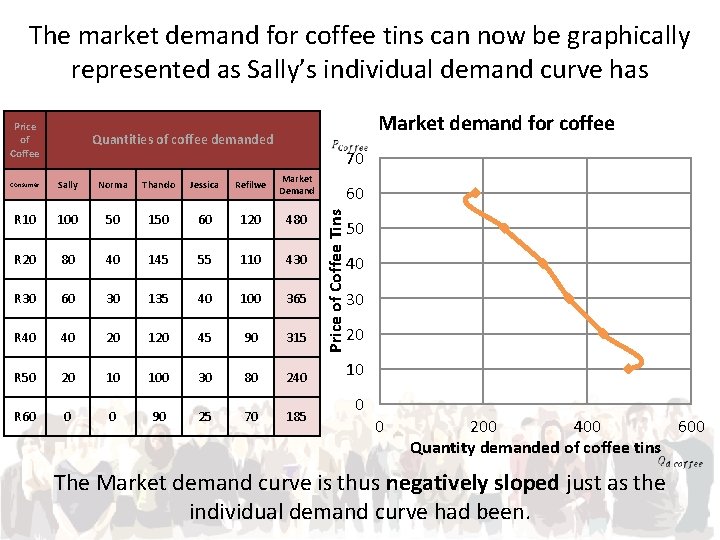
Market demand for coffee The Market demand can be determined by adding up all the individual quantities demanded by each individual at a particular price. Let’s calculate the market demand when a coffee is R 10 Price of Coffee Quantities of coffee demanded Consumer Sally Norma Thando Jessica Refilwe Market demand R 10 100 50 150 60 120 480 R 20 80 40 145 55 110 430 R 30 60 30 135 40 100 365 R 40 40 20 120 45 90 315 R 50 20 10 100 30 80 240 R 60 0 0 90 25 70 185 100 + 50 + 150 + 60 + 120 = 480
The market demand for coffee tins can now be graphically represented as Sally’s individual demand curve has Market demand for coffee Quantities of coffee demanded Consumer Sally Norma Thando Jessica Refilwe Market Demand R 10 100 50 150 60 120 480 R 20 80 40 145 55 110 430 R 30 60 30 135 40 100 365 R 40 40 20 120 45 90 315 R 50 20 10 100 30 80 240 R 60 0 0 90 25 70 185 70 60 Price of Coffee Tins Price of Coffee 50 40 30 20 10 0 0 200 400 600 Quantity demanded of coffee tins The Market demand curve is thus negatively sloped just as the individual demand curve had been.
Movements along and shifts of the demand curve • It is very important to distinguish between a movement along in a demand curve and a shift of the demand curve • A movement along the curve has to do with the slope of a curve • A shift of the curve relates to the position or intercept of the curve. • An easy way to remember the difference is if there is a change on one of the variables that can be found on the axis of the curve (x-axis or y-axis) there will be a movement along the curve, changes in all other variables will cause a shift of the curve.
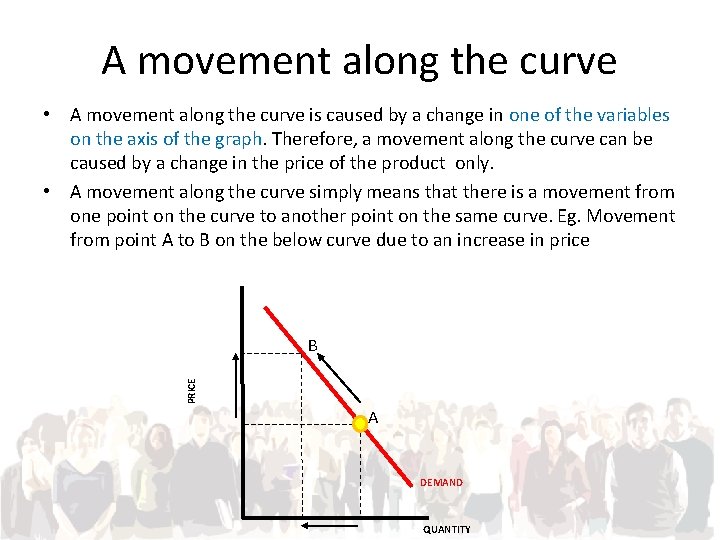
A movement along the curve • A movement along the curve is caused by a change in one of the variables on the axis of the graph. Therefore, a movement along the curve can be caused by a change in the price of the product only. • A movement along the curve simply means that there is a movement from one point on the curve to another point on the same curve. Eg. Movement from point A to B on the below curve due to an increase in price PRICE B A DEMAND QUANTITY
A shift of the curve •
Substitutes like coffee and tea Demand for coffee Price A substitute is a good that can be used in place of another good to satisfy a consumer’s want. Tea can be used as a substitute for coffee, if people cannot afford coffee, they will buy tea instead. Hence, a decrease in the price of tea (movement along the tea demand curve) will cause a decrease in the demand for coffee. The more tea is demanded, the less coffee will be demanded, this will cause a shift to the left for the demand of coffee tins. Quantity *Note that the price of coffee remains constant while the decrease in demand causes the quantity demanded of coffee to decrease as well.
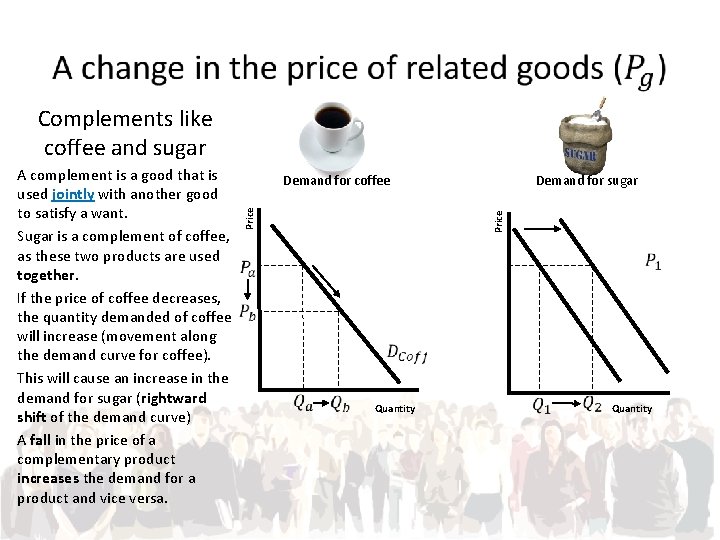
Complements like coffee and sugar Demand for coffee Demand for sugar Price A complement is a good that is used jointly with another good to satisfy a want. Sugar is a complement of coffee, as these two products are used together. If the price of coffee decreases, the quantity demanded of coffee will increase (movement along the demand curve for coffee). This will cause an increase in the demand for sugar (rightward shift of the demand curve) A fall in the price of a complementary product increases the demand for a product and vice versa. Quantity
Change in the income (Y) of consumers • A fall in income of consumers will result in a decrease in the demand for a product as consumers will buy fewer amounts of the product. An increase in income will result in an increase in demand, provided that the product demanded is a normal good. • An inferior good’s demand will decrease if income increases. • This will cause a shift in the demand curve Change in consumer’s tastes or preferences (T) • A change in consumer’s preferences due to factors such as advertising or fashion will cause an increase/decrease in demand. • This will cause a shift in the demand curve