
Safety Inventories Chapter 11 of Chopra 1 utdallas
- Slides: 64
Safety Inventories Chapter 11 of Chopra 1 utdallas. edu/~metin
Why to hold Safety Inventory? u Desire for quick product availability – Ease of search for another supplier – “I want it now” culture u Demand uncertainty – Short product life cycles u Safety inventory 2 utdallas. edu/~metin
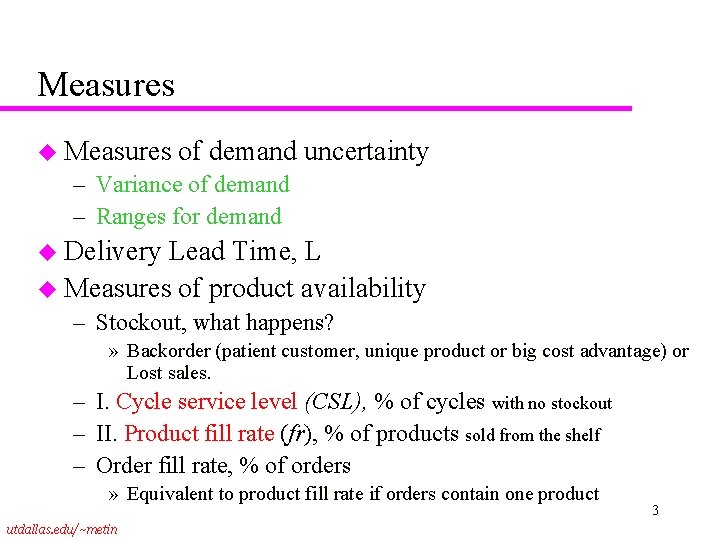
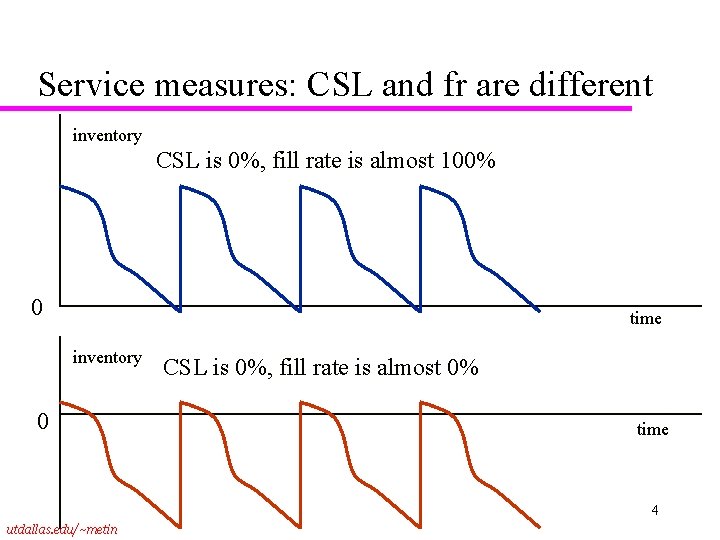
Measures u Measures of demand uncertainty – Variance of demand – Ranges for demand u Delivery Lead Time, L u Measures of product availability – Stockout, what happens? » Backorder (patient customer, unique product or big cost advantage) or Lost sales. – I. Cycle service level (CSL), % of cycles with no stockout – II. Product fill rate (fr), % of products sold from the shelf – Order fill rate, % of orders » Equivalent to product fill rate if orders contain one product utdallas. edu/~metin 3
Service measures: CSL and fr are different inventory CSL is 0%, fill rate is almost 100% 0 time inventory 0 CSL is 0%, fill rate is almost 0% time 4 utdallas. edu/~metin
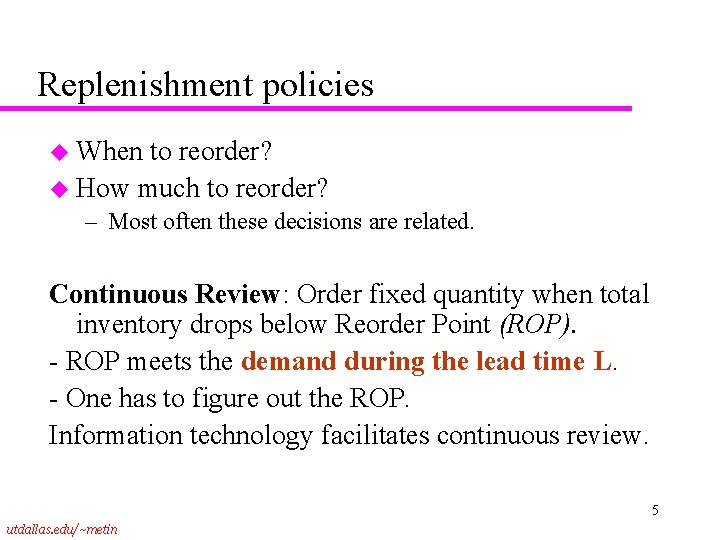
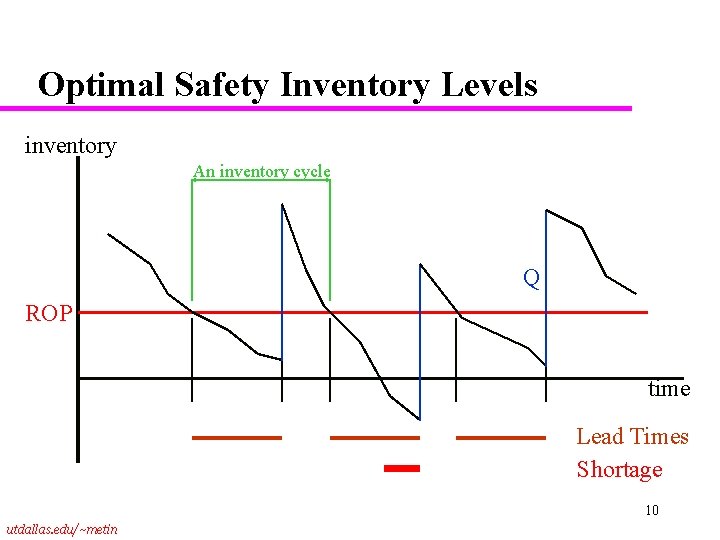
Replenishment policies u When to reorder? u How much to reorder? – Most often these decisions are related. Continuous Review: Order fixed quantity when total inventory drops below Reorder Point (ROP). - ROP meets the demand during the lead time L. - One has to figure out the ROP. Information technology facilitates continuous review. 5 utdallas. edu/~metin
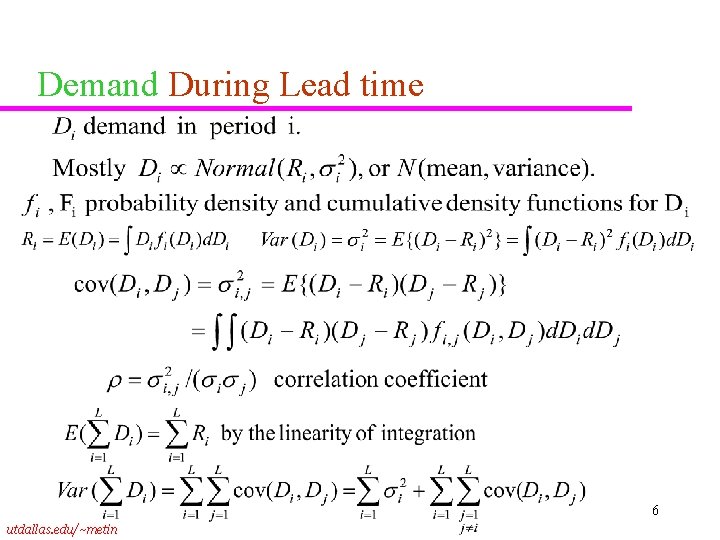
Demand During Lead time 6 utdallas. edu/~metin
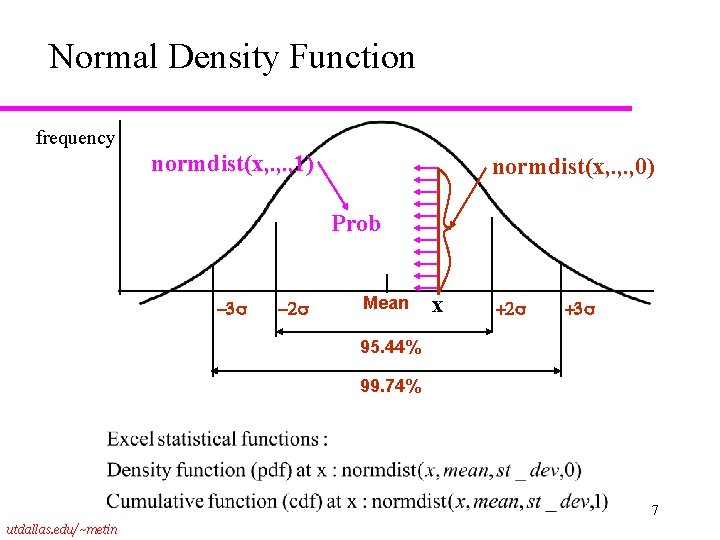
Normal Density Function frequency normdist(x, . , 1) normdist(x, . , 0) Prob Mean x 95. 44% 99. 74% 7 utdallas. edu/~metin
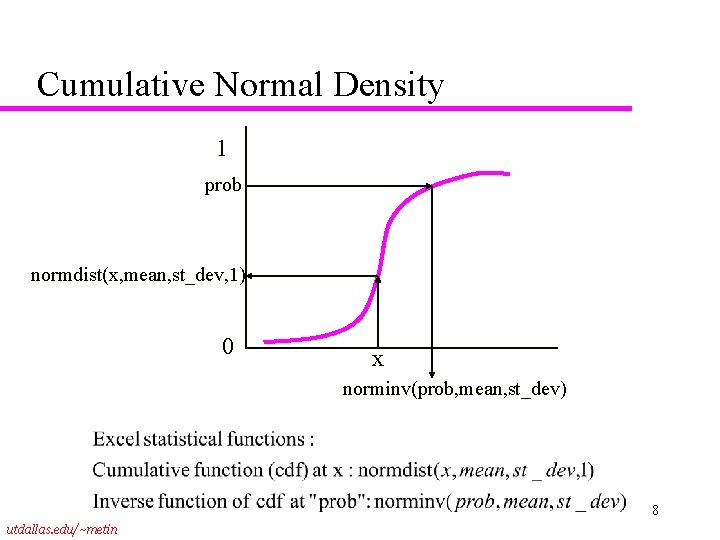
Cumulative Normal Density 1 prob normdist(x, mean, st_dev, 1) 0 x norminv(prob, mean, st_dev) 8 utdallas. edu/~metin
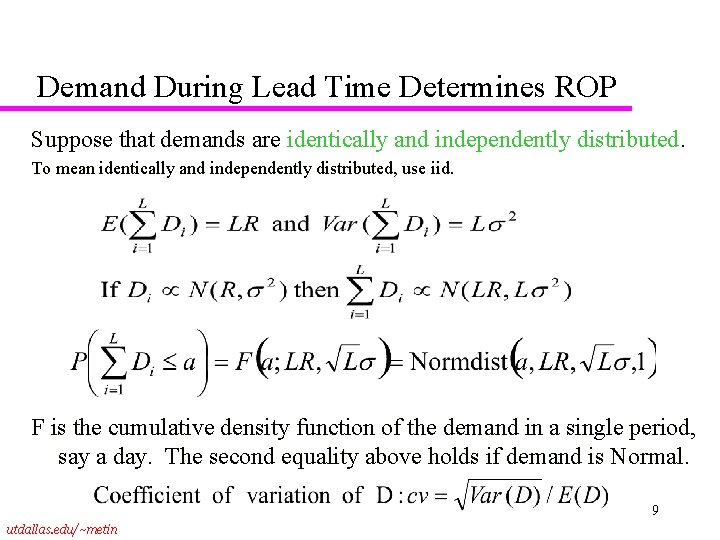
Demand During Lead Time Determines ROP Suppose that demands are identically and independently distributed. To mean identically and independently distributed, use iid. F is the cumulative density function of the demand in a single period, say a day. The second equality above holds if demand is Normal. 9 utdallas. edu/~metin
Optimal Safety Inventory Levels inventory An inventory cycle Q ROP time Lead Times Shortage 10 utdallas. edu/~metin
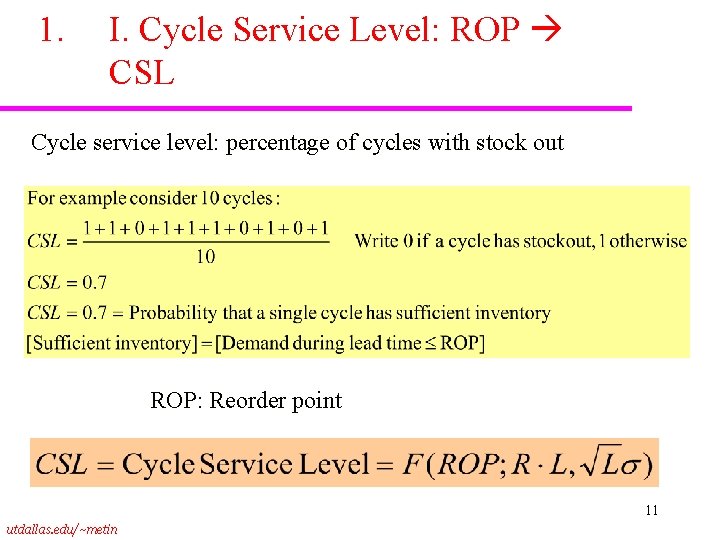
1. I. Cycle Service Level: ROP CSL Cycle service level: percentage of cycles with stock out ROP: Reorder point 11 utdallas. edu/~metin
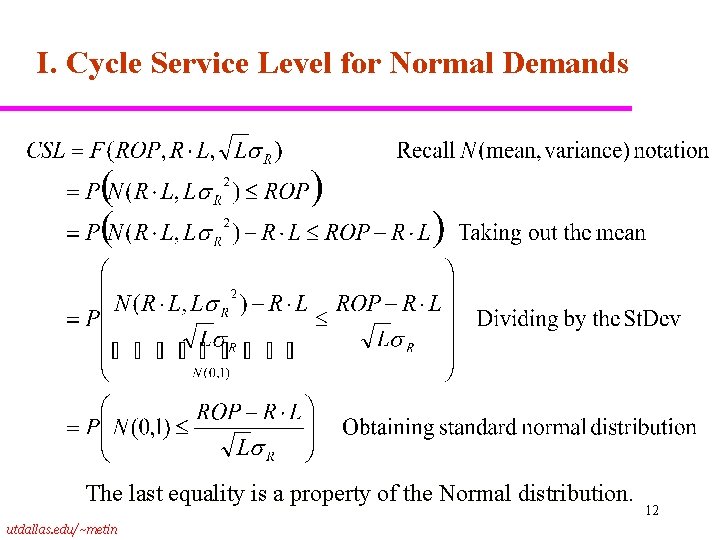
I. Cycle Service Level for Normal Demands The last equality is a property of the Normal distribution. utdallas. edu/~metin 12
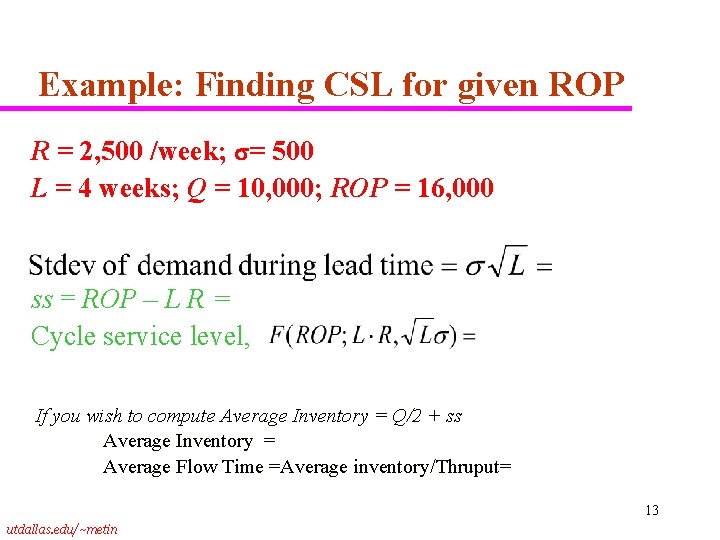
Example: Finding CSL for given ROP R = 2, 500 /week; = 500 L = 4 weeks; Q = 10, 000; ROP = 16, 000 ss = ROP – L R = Cycle service level, If you wish to compute Average Inventory = Q/2 + ss Average Inventory = Average Flow Time =Average inventory/Thruput= 13 utdallas. edu/~metin
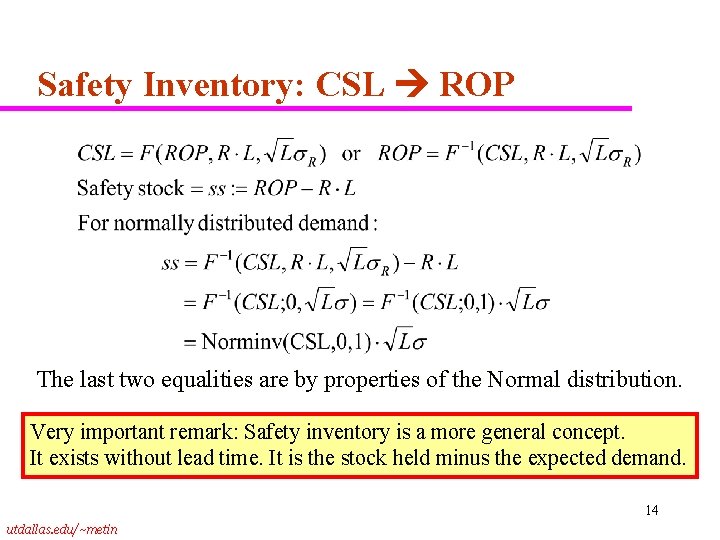
Safety Inventory: CSL ROP The last two equalities are by properties of the Normal distribution. Very important remark: Safety inventory is a more general concept. It exists without lead time. It is the stock held minus the expected demand. 14 utdallas. edu/~metin
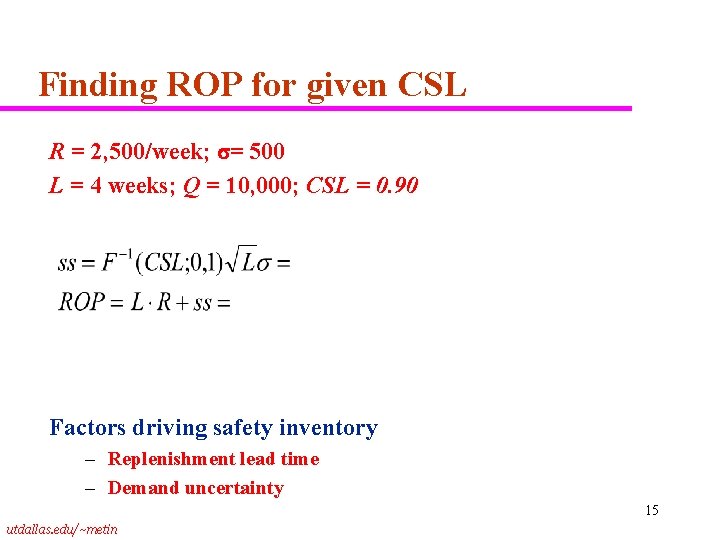
Finding ROP for given CSL R = 2, 500/week; = 500 L = 4 weeks; Q = 10, 000; CSL = 0. 90 Factors driving safety inventory – Replenishment lead time – Demand uncertainty 15 utdallas. edu/~metin
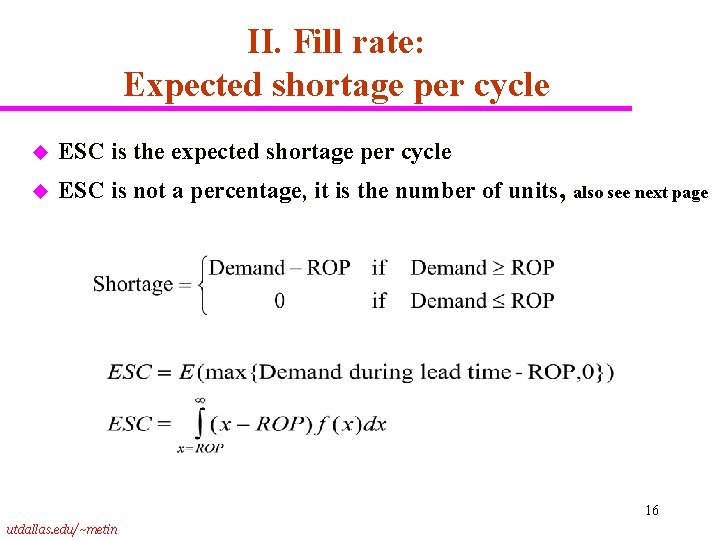
II. Fill rate: Expected shortage per cycle u ESC is the expected shortage per cycle u ESC is not a percentage, it is the number of units, also see next page 16 utdallas. edu/~metin
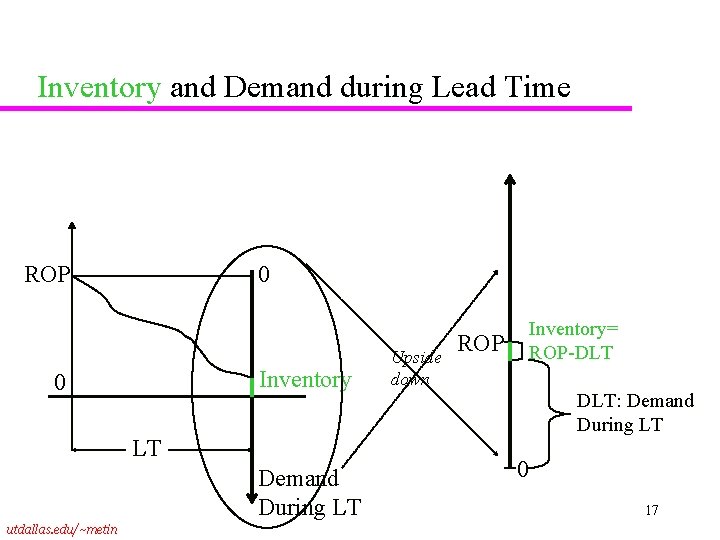
Inventory and Demand during Lead Time ROP 0 Inventory 0 LT Demand During LT utdallas. edu/~metin Upside down Inventory= ROP-DLT ROP DLT: Demand During LT 0 17
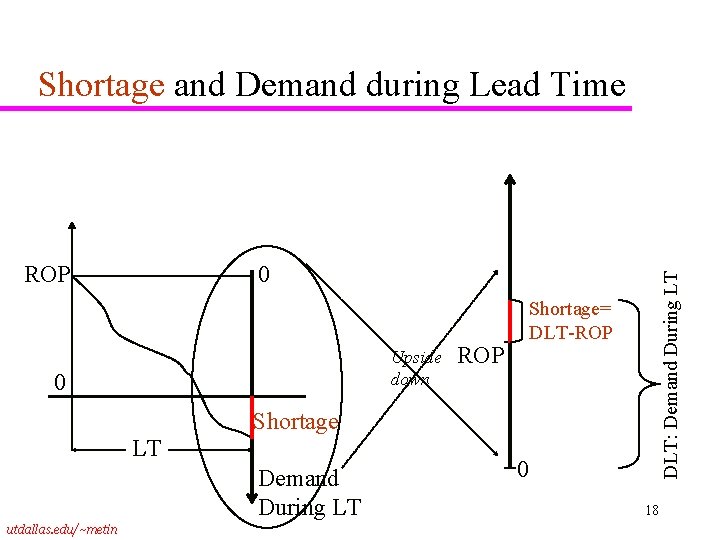
Shortage and Demand during Lead Time 0 Upside down 0 DLT: Demand During LT ROP Shortage= DLT-ROP Shortage LT Demand During LT utdallas. edu/~metin 0 18
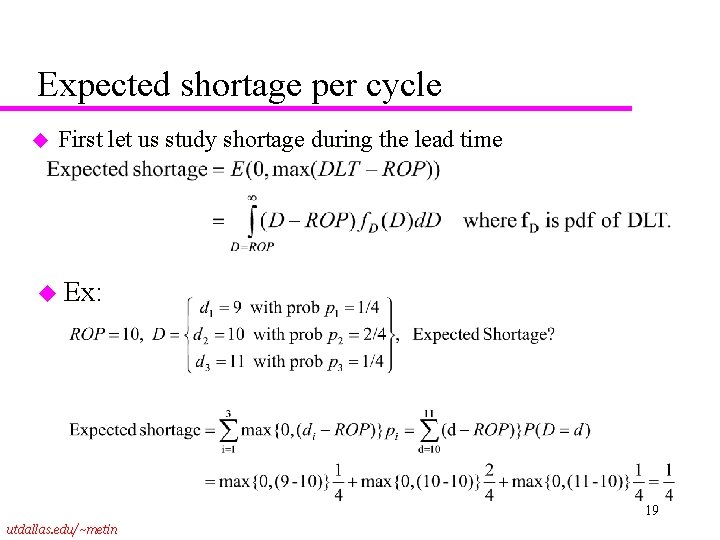
Expected shortage per cycle u First let us study shortage during the lead time u Ex: 19 utdallas. edu/~metin
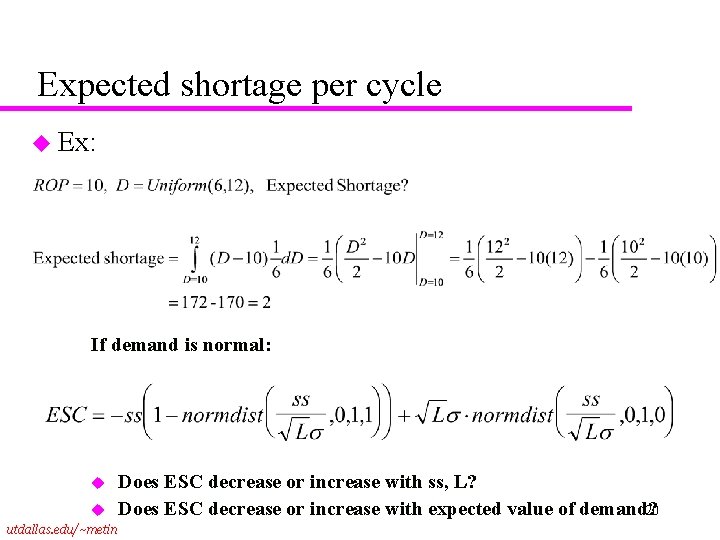
Expected shortage per cycle u Ex: If demand is normal: u u utdallas. edu/~metin Does ESC decrease or increase with ss, L? Does ESC decrease or increase with expected value of demand? 20
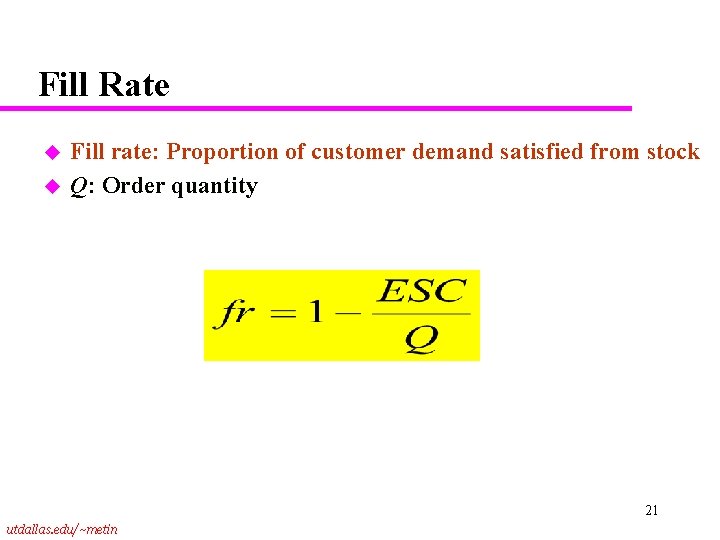
Fill Rate u u Fill rate: Proportion of customer demand satisfied from stock Q: Order quantity 21 utdallas. edu/~metin
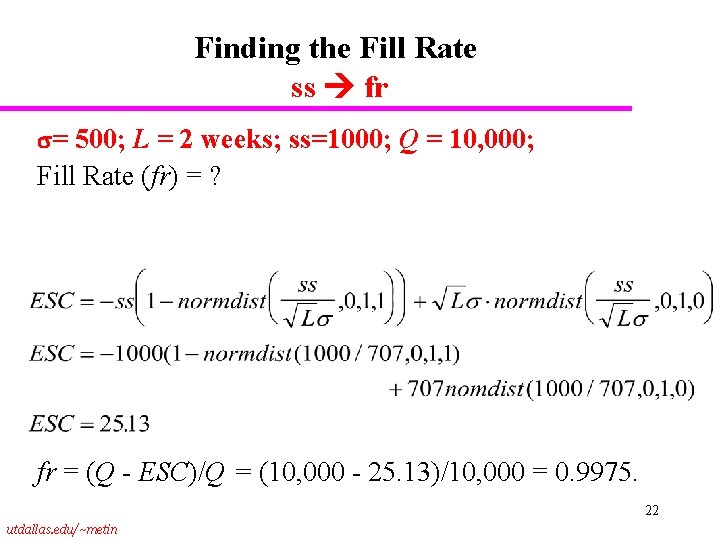
Finding the Fill Rate ss fr = 500; L = 2 weeks; ss=1000; Q = 10, 000; Fill Rate (fr) = ? fr = (Q - ESC)/Q = (10, 000 - 25. 13)/10, 000 = 0. 9975. 22 utdallas. edu/~metin
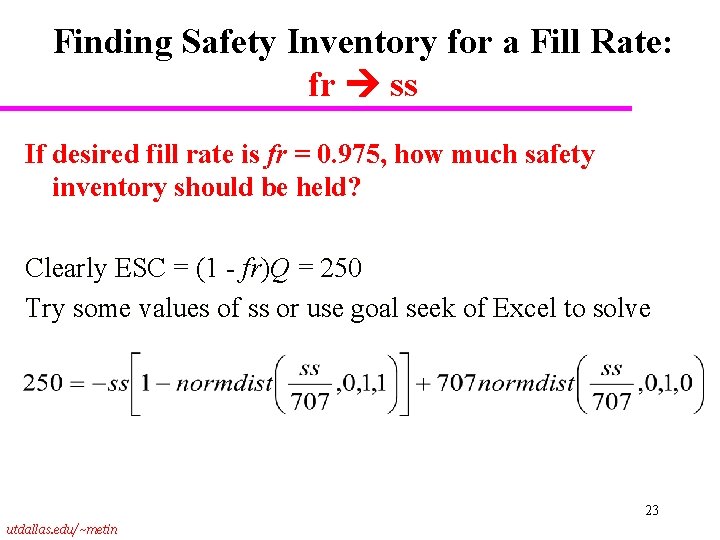
Finding Safety Inventory for a Fill Rate: fr ss If desired fill rate is fr = 0. 975, how much safety inventory should be held? Clearly ESC = (1 - fr)Q = 250 Try some values of ss or use goal seek of Excel to solve 23 utdallas. edu/~metin
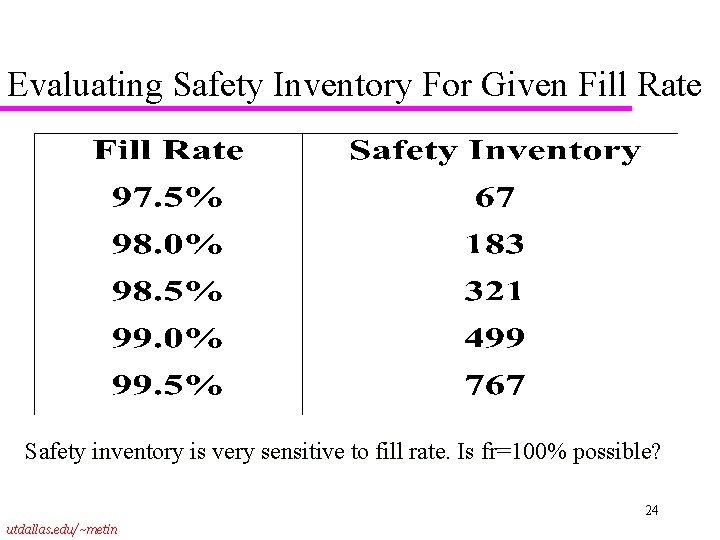
Evaluating Safety Inventory For Given Fill Rate Safety inventory is very sensitive to fill rate. Is fr=100% possible? 24 utdallas. edu/~metin
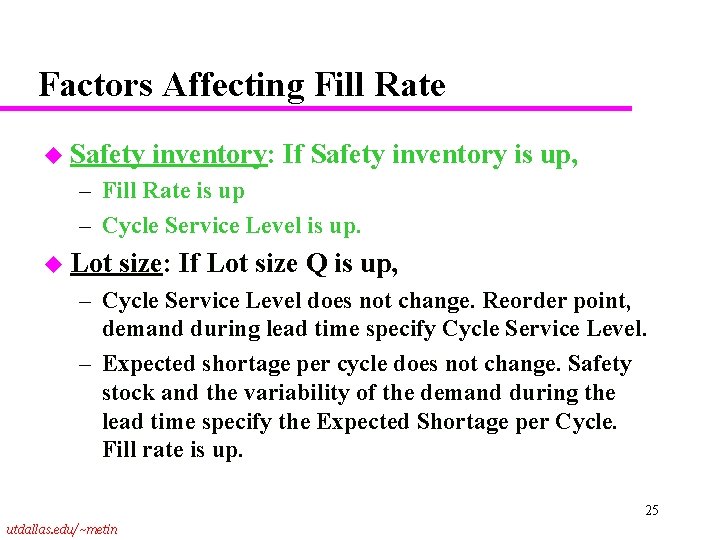
Factors Affecting Fill Rate u Safety inventory: If Safety inventory is up, – Fill Rate is up – Cycle Service Level is up. u Lot size: If Lot size Q is up, – Cycle Service Level does not change. Reorder point, demand during lead time specify Cycle Service Level. – Expected shortage per cycle does not change. Safety stock and the variability of the demand during the lead time specify the Expected Shortage per Cycle. Fill rate is up. 25 utdallas. edu/~metin
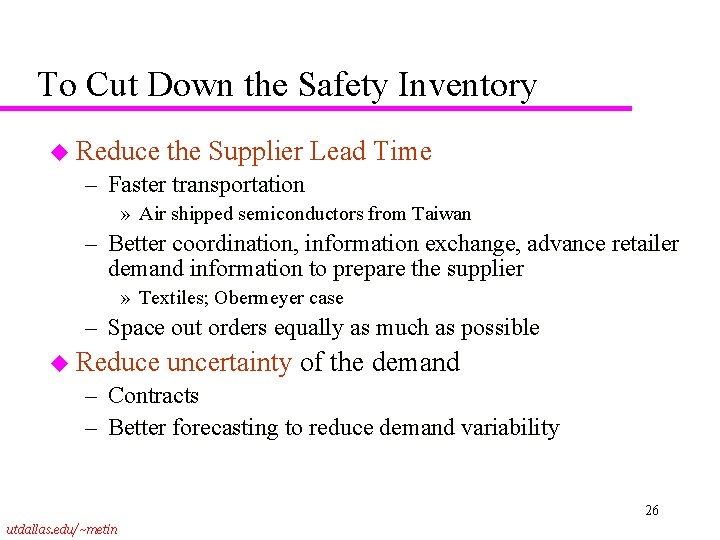
To Cut Down the Safety Inventory u Reduce the Supplier Lead Time – Faster transportation » Air shipped semiconductors from Taiwan – Better coordination, information exchange, advance retailer demand information to prepare the supplier » Textiles; Obermeyer case – Space out orders equally as much as possible u Reduce uncertainty of the demand – Contracts – Better forecasting to reduce demand variability 26 utdallas. edu/~metin
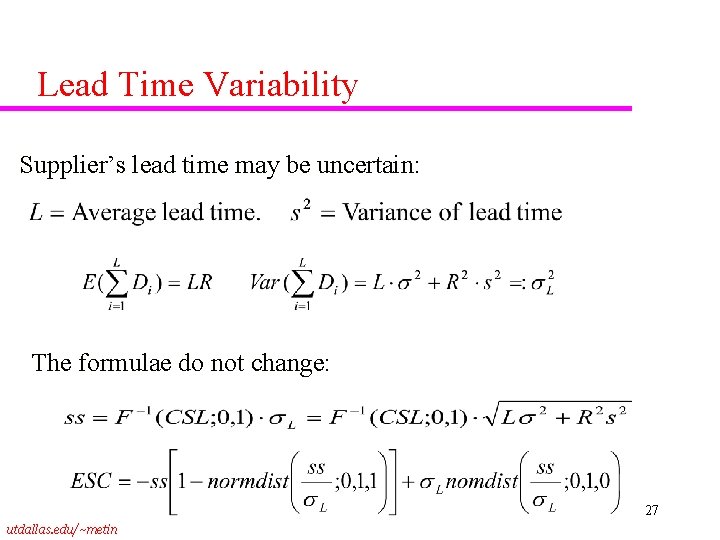
Lead Time Variability Supplier’s lead time may be uncertain: The formulae do not change: 27 utdallas. edu/~metin
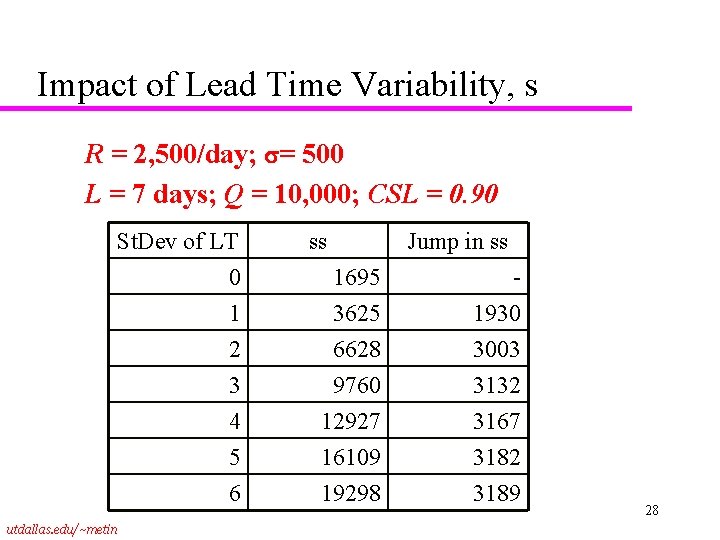
Impact of Lead Time Variability, s R = 2, 500/day; = 500 L = 7 days; Q = 10, 000; CSL = 0. 90 St. Dev of LT 0 1 2 3 4 5 6 utdallas. edu/~metin ss Jump in ss 1695 3625 6628 1930 3003 9760 12927 16109 19298 3132 3167 3182 3189 28
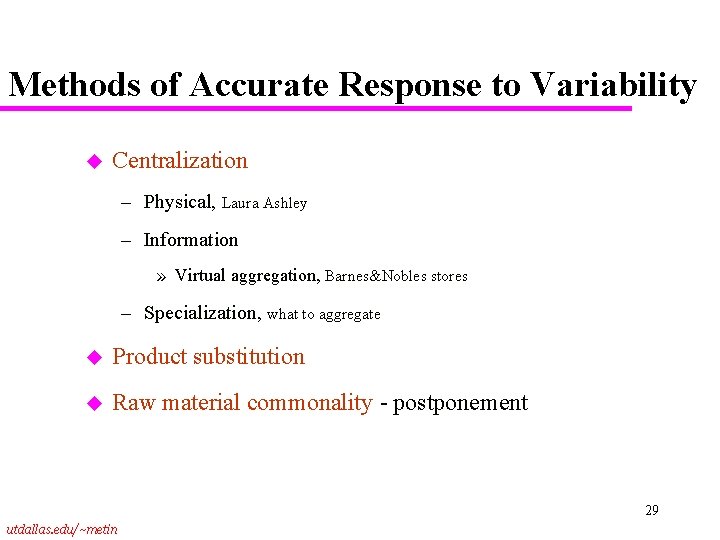
Methods of Accurate Response to Variability u Centralization – Physical, Laura Ashley – Information » Virtual aggregation, Barnes&Nobles stores – Specialization, what to aggregate u Product substitution u Raw material commonality - postponement 29 utdallas. edu/~metin
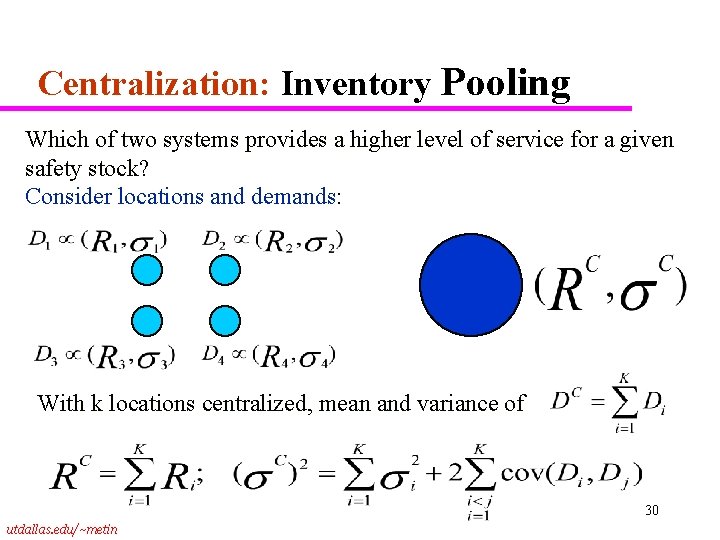
Centralization: Inventory Pooling Which of two systems provides a higher level of service for a given safety stock? Consider locations and demands: With k locations centralized, mean and variance of 30 utdallas. edu/~metin
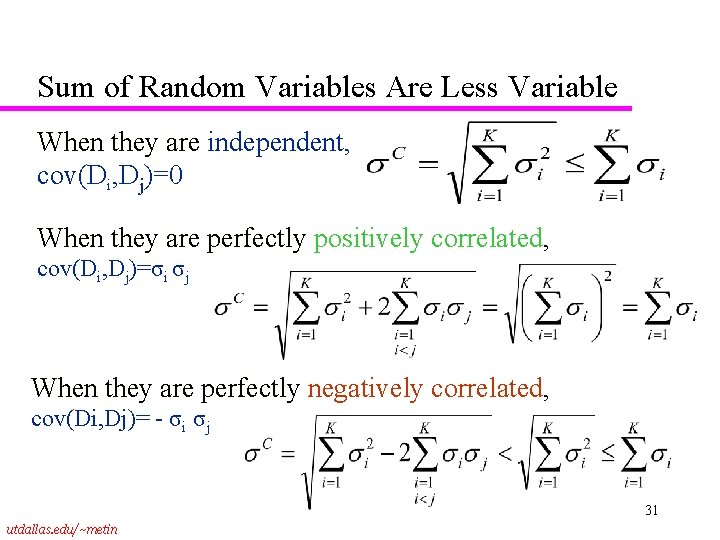
Sum of Random Variables Are Less Variable When they are independent, cov(Di, Dj)=0 When they are perfectly positively correlated, cov(Di, Dj)=σi σj When they are perfectly negatively correlated, cov(Di, Dj)= - σi σj 31 utdallas. edu/~metin
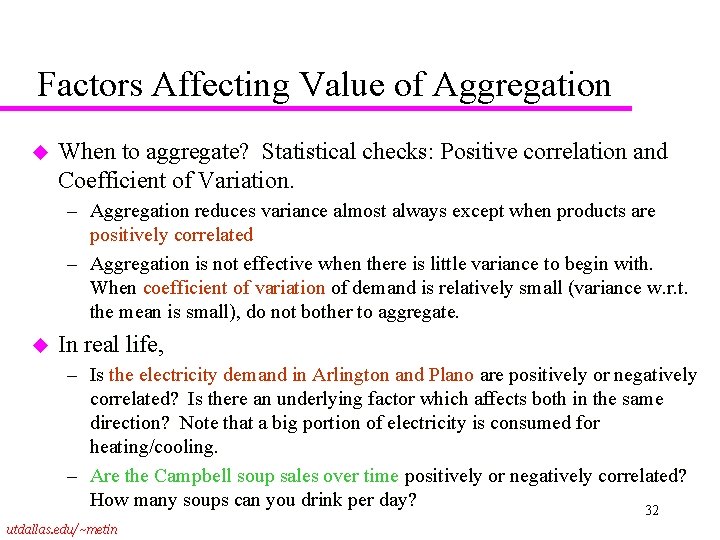
Factors Affecting Value of Aggregation u When to aggregate? Statistical checks: Positive correlation and Coefficient of Variation. – Aggregation reduces variance almost always except when products are positively correlated – Aggregation is not effective when there is little variance to begin with. When coefficient of variation of demand is relatively small (variance w. r. t. the mean is small), do not bother to aggregate. u In real life, – Is the electricity demand in Arlington and Plano are positively or negatively correlated? Is there an underlying factor which affects both in the same direction? Note that a big portion of electricity is consumed for heating/cooling. – Are the Campbell soup sales over time positively or negatively correlated? How many soups can you drink per day? 32 utdallas. edu/~metin
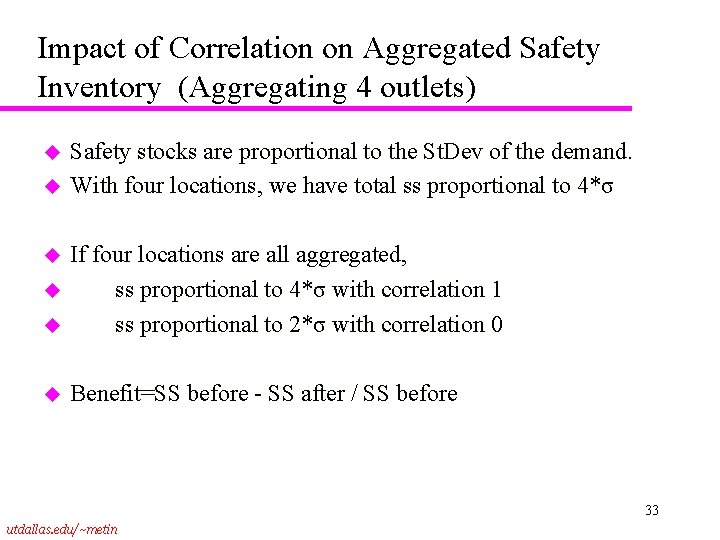
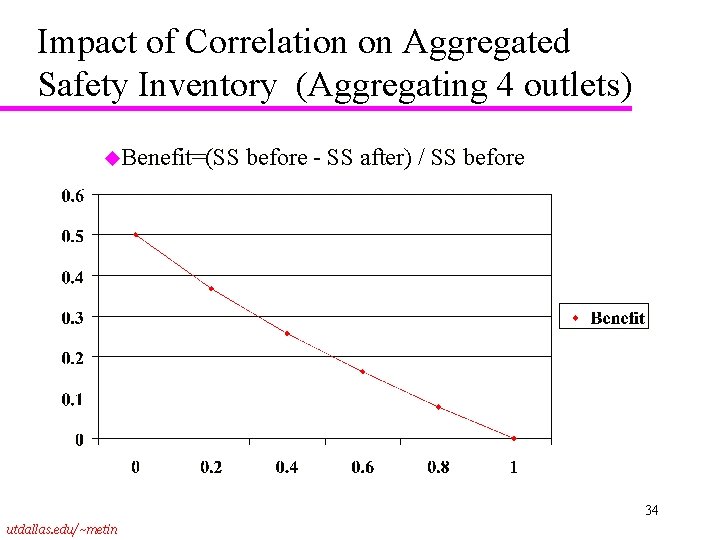
Impact of Correlation on Aggregated Safety Inventory (Aggregating 4 outlets) u u Safety stocks are proportional to the St. Dev of the demand. With four locations, we have total ss proportional to 4*σ u If four locations are all aggregated, ss proportional to 4*σ with correlation 1 ss proportional to 2*σ with correlation 0 u Benefit=SS before - SS after / SS before u u 33 utdallas. edu/~metin
Impact of Correlation on Aggregated Safety Inventory (Aggregating 4 outlets) u. Benefit=(SS before - SS after) / SS before 34 utdallas. edu/~metin
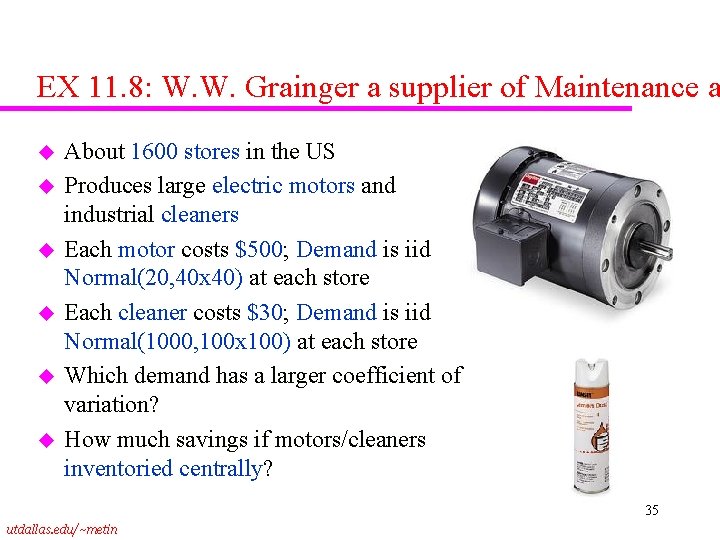
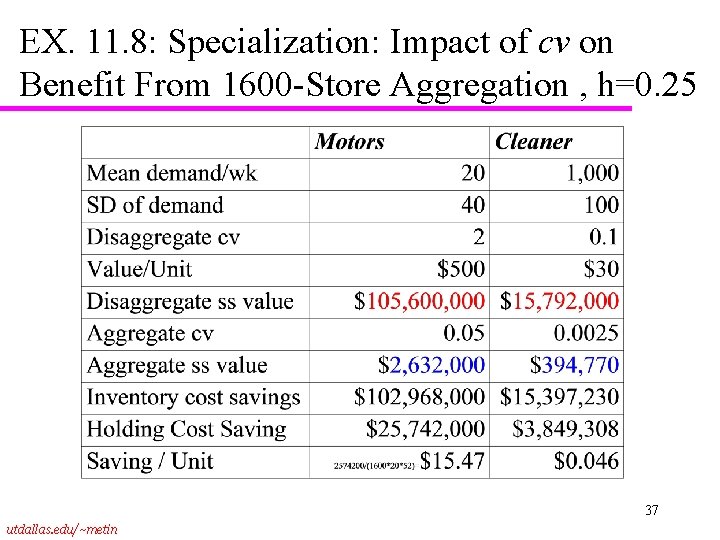
EX 11. 8: W. W. Grainger a supplier of Maintenance a u u u About 1600 stores in the US Produces large electric motors and industrial cleaners Each motor costs $500; Demand is iid Normal(20, 40 x 40) at each store Each cleaner costs $30; Demand is iid Normal(1000, 100 x 100) at each store Which demand has a larger coefficient of variation? How much savings if motors/cleaners inventoried centrally? 35 utdallas. edu/~metin
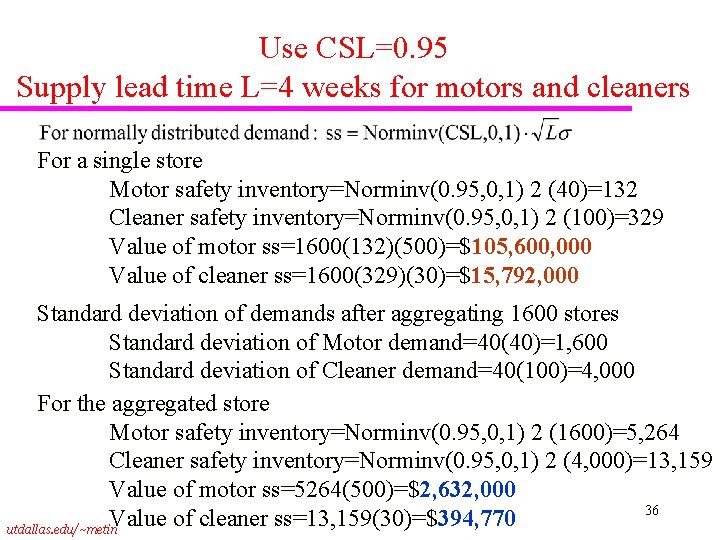
Use CSL=0. 95 Supply lead time L=4 weeks for motors and cleaners For a single store Motor safety inventory=Norminv(0. 95, 0, 1) 2 (40)=132 Cleaner safety inventory=Norminv(0. 95, 0, 1) 2 (100)=329 Value of motor ss=1600(132)(500)=$105, 600, 000 Value of cleaner ss=1600(329)(30)=$15, 792, 000 Standard deviation of demands after aggregating 1600 stores Standard deviation of Motor demand=40(40)=1, 600 Standard deviation of Cleaner demand=40(100)=4, 000 For the aggregated store Motor safety inventory=Norminv(0. 95, 0, 1) 2 (1600)=5, 264 Cleaner safety inventory=Norminv(0. 95, 0, 1) 2 (4, 000)=13, 159 Value of motor ss=5264(500)=$2, 632, 000 36 Value of cleaner ss=13, 159(30)=$394, 770 utdallas. edu/~metin
EX. 11. 8: Specialization: Impact of cv on Benefit From 1600 -Store Aggregation , h=0. 25 37 utdallas. edu/~metin
Slow vs Fast Moving Items u Low demand = Slow moving items, vice versa. – Repair parts are typically slow moving items u u Slow moving items have high coefficient of variation, vice versa. Stock slow moving items at a central store Buying a best seller at Amazon. com vs. a Supply Chain book vs. a Banach spaces book, which has a shorter delivery time? - Why cannot I find a “driver-side-door lock cylinder” for my 1994 Toyota Corolla at Pep Boys? - Your instructor on March 26 2005. - “Case Interview books” are not in our s. k. u. list. You must check with our central stores. - Store keeper at Barnes and Nobles at Collin Creek, March 2002. 38 utdallas. edu/~metin
Product Substitution u u Manufacturer driven Customer driven Consider: The price of the products substituted for each other and the demand correlations u One-way substitution – Army boots. What if your boot is large? Aggregate? u Two-way substitution: – Grainger motors; water pumps model DN vs IT. – Similar products, can customer detect specifications. If products are very similar, why not to eliminate one of them? 39 utdallas. edu/~metin
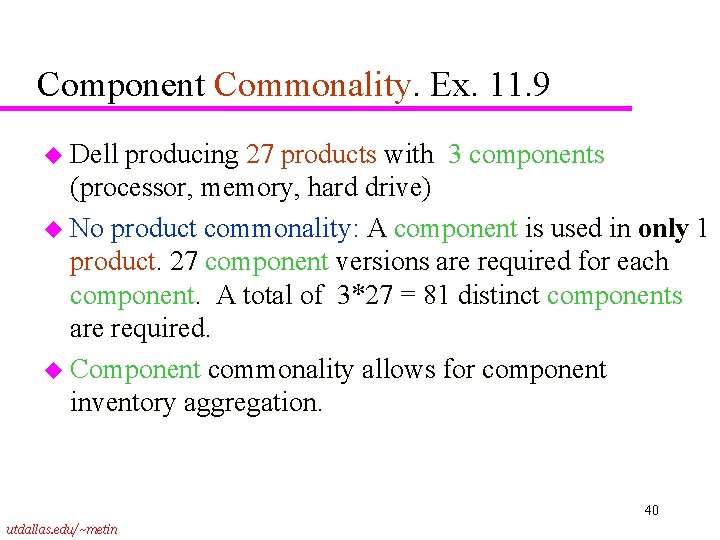
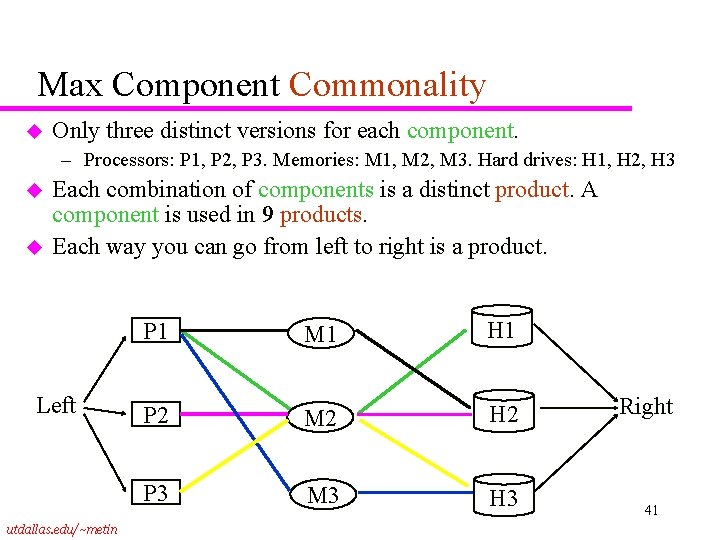
Component Commonality. Ex. 11. 9 u Dell producing 27 products with 3 components (processor, memory, hard drive) u No product commonality: A component is used in only 1 product. 27 component versions are required for each component. A total of 3*27 = 81 distinct components are required. u Component commonality allows for component inventory aggregation. 40 utdallas. edu/~metin
Max Component Commonality u Only three distinct versions for each component. – Processors: P 1, P 2, P 3. Memories: M 1, M 2, M 3. Hard drives: H 1, H 2, H 3 u u Each combination of components is a distinct product. A component is used in 9 products. Each way you can go from left to right is a product. Left utdallas. edu/~metin P 1 M 1 H 1 P 2 M 2 H 2 P 3 M 3 H 3 Right 41
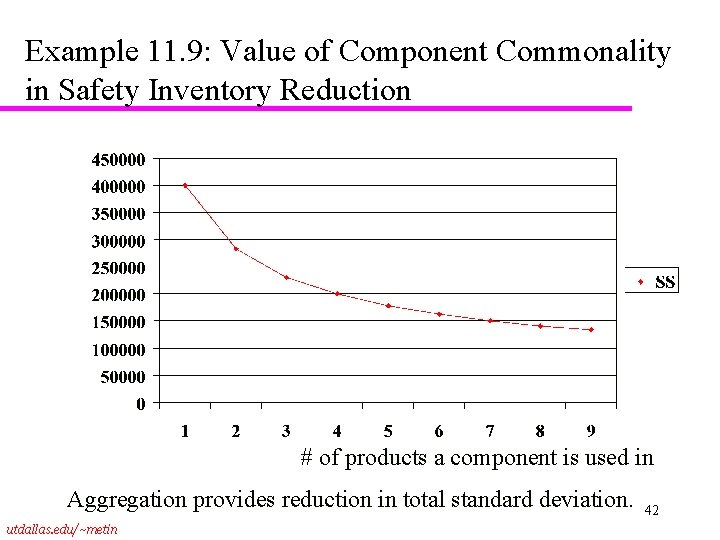
Example 11. 9: Value of Component Commonality in Safety Inventory Reduction # of products a component is used in Aggregation provides reduction in total standard deviation. utdallas. edu/~metin 42
Standardization u. Standardization – Extent to which there is an absence of variety in a product, service or process u. The degree of Standardization? u. Standardized products are immediately available to customers u. Who wants standardization? – The day we sell standard products is the day we lose a significant portion of our profit – A TI manager on November 1, 2005 43 utdallas. edu/~metin
Advantages of Standardization u Fewer parts to deal with in inventory & manufacturing – Less costly to fill orders from inventory u Reduced training costs and time u More routine purchasing, handling, and inspection procedures u Opportunities for long production runs, automation u Need for fewer parts justifies increased expenditures on perfecting designs and improving quality control procedures. 44 utdallas. edu/~metin
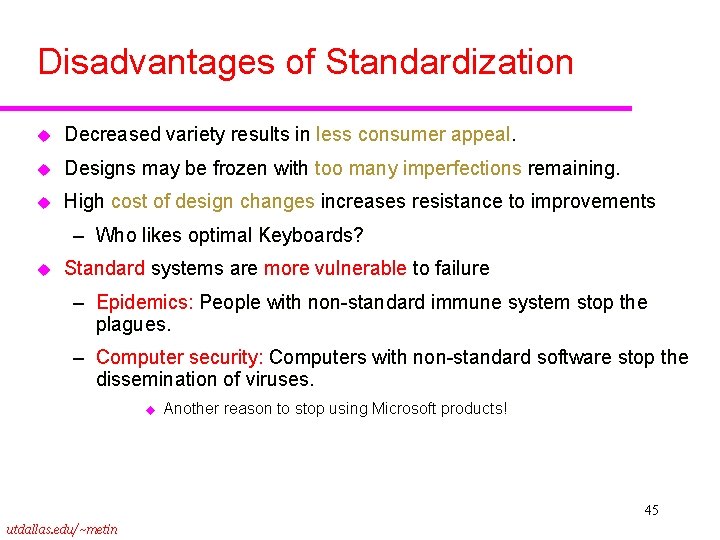
Disadvantages of Standardization u Decreased variety results in less consumer appeal. u Designs may be frozen with too many imperfections remaining. u High cost of design changes increases resistance to improvements – Who likes optimal Keyboards? u Standard systems are more vulnerable to failure – Epidemics: People with non-standard immune system stop the plagues. – Computer security: Computers with non-standard software stop the dissemination of viruses. u Another reason to stop using Microsoft products! 45 utdallas. edu/~metin
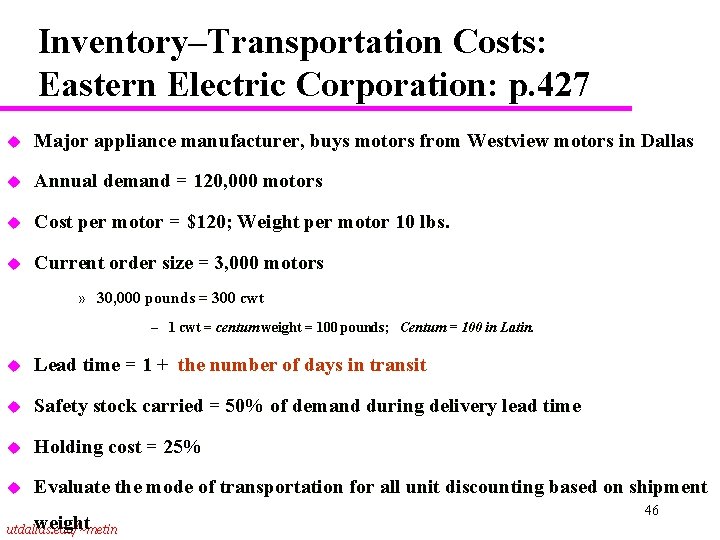
Inventory–Transportation Costs: Eastern Electric Corporation: p. 427 u Major appliance manufacturer, buys motors from Westview motors in Dallas u Annual demand = 120, 000 motors u Cost per motor = $120; Weight per motor 10 lbs. u Current order size = 3, 000 motors » 30, 000 pounds = 300 cwt – 1 cwt = centum weight = 100 pounds; Centum = 100 in Latin. u Lead time = 1 + the number of days in transit u Safety stock carried = 50% of demand during delivery lead time u Holding cost = 25% u Evaluate the mode of transportation for all unit discounting based on shipment weight utdallas. edu/~metin 46
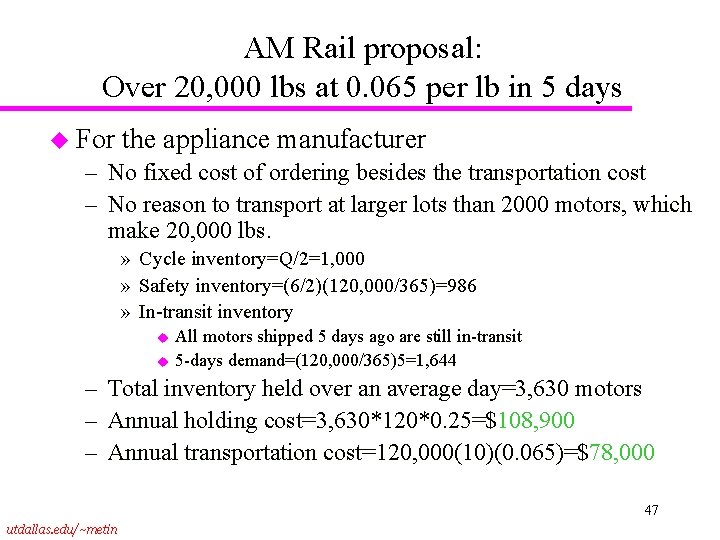
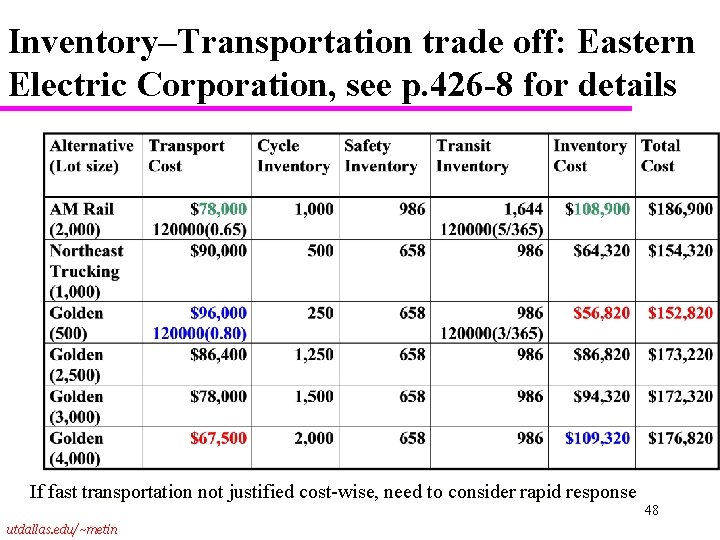
AM Rail proposal: Over 20, 000 lbs at 0. 065 per lb in 5 days u For the appliance manufacturer – No fixed cost of ordering besides the transportation cost – No reason to transport at larger lots than 2000 motors, which make 20, 000 lbs. » Cycle inventory=Q/2=1, 000 » Safety inventory=(6/2)(120, 000/365)=986 » In-transit inventory u u All motors shipped 5 days ago are still in-transit 5 -days demand=(120, 000/365)5=1, 644 – Total inventory held over an average day=3, 630 motors – Annual holding cost=3, 630*120*0. 25=$108, 900 – Annual transportation cost=120, 000(10)(0. 065)=$78, 000 47 utdallas. edu/~metin
Inventory–Transportation trade off: Eastern Electric Corporation, see p. 426 -8 for details If fast transportation not justified cost-wise, need to consider rapid response 48 utdallas. edu/~metin
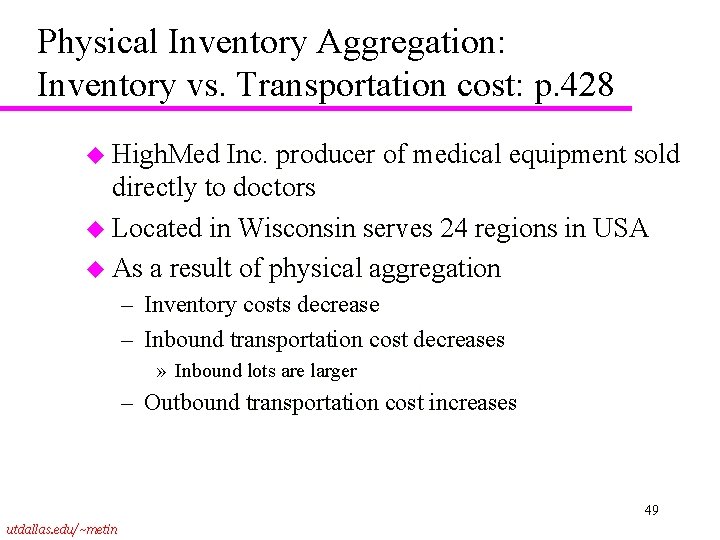
Physical Inventory Aggregation: Inventory vs. Transportation cost: p. 428 u High. Med Inc. producer of medical equipment sold directly to doctors u Located in Wisconsin serves 24 regions in USA u As a result of physical aggregation – Inventory costs decrease – Inbound transportation cost decreases » Inbound lots are larger – Outbound transportation cost increases 49 utdallas. edu/~metin
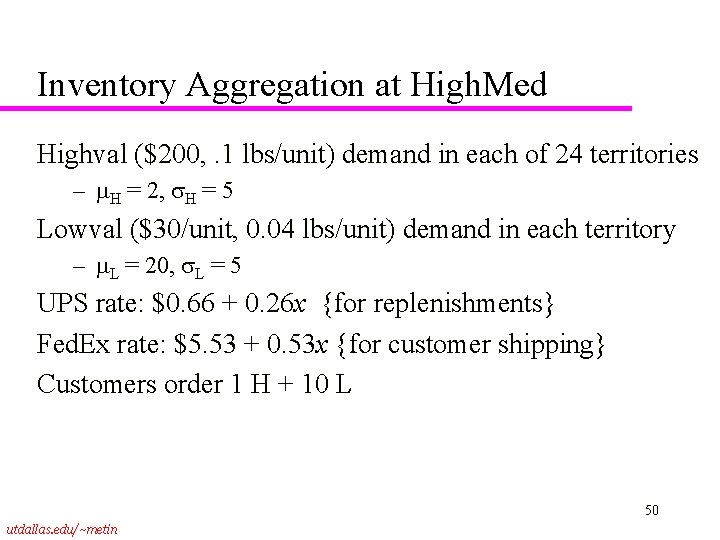
Inventory Aggregation at High. Med Highval ($200, . 1 lbs/unit) demand in each of 24 territories – H = 2, H = 5 Lowval ($30/unit, 0. 04 lbs/unit) demand in each territory – L = 20, L = 5 UPS rate: $0. 66 + 0. 26 x {for replenishments} Fed. Ex rate: $5. 53 + 0. 53 x {for customer shipping} Customers order 1 H + 10 L 50 utdallas. edu/~metin
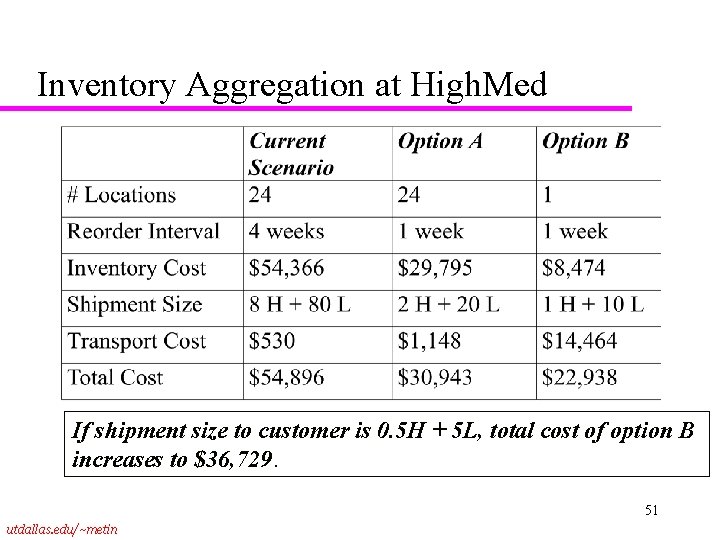
Inventory Aggregation at High. Med If shipment size to customer is 0. 5 H + 5 L, total cost of option B increases to $36, 729. 51 utdallas. edu/~metin
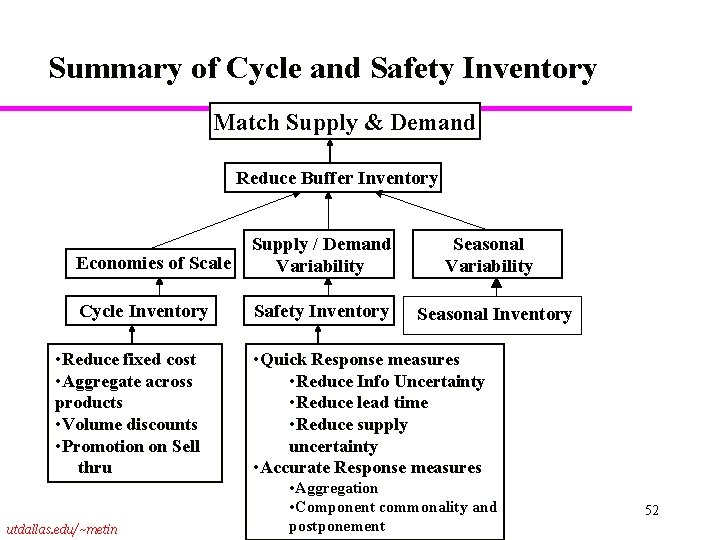
Summary of Cycle and Safety Inventory Match Supply & Demand Reduce Buffer Inventory Economies of Scale Supply / Demand Variability Cycle Inventory Safety Inventory • Reduce fixed cost • Aggregate across products • Volume discounts • Promotion on Sell thru utdallas. edu/~metin Seasonal Variability Seasonal Inventory • Quick Response measures • Reduce Info Uncertainty • Reduce lead time • Reduce supply uncertainty • Accurate Response measures • Aggregation • Component commonality and postponement 52
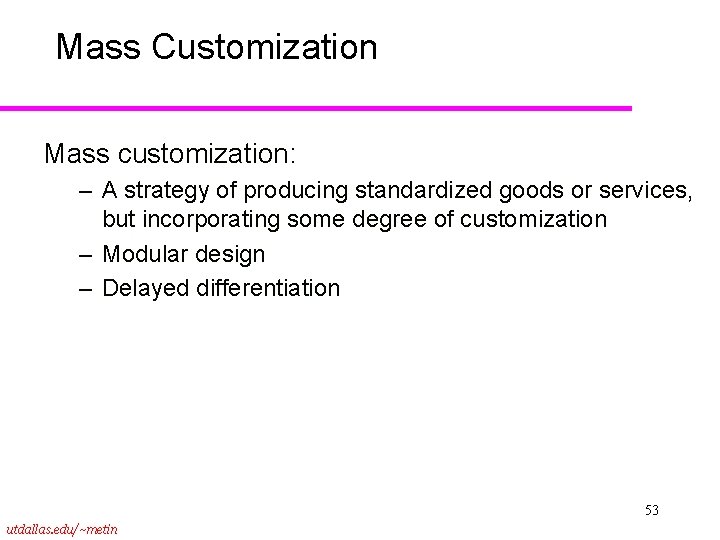
Mass Customization Mass customization: – A strategy of producing standardized goods or services, but incorporating some degree of customization – Modular design – Delayed differentiation 53 utdallas. edu/~metin
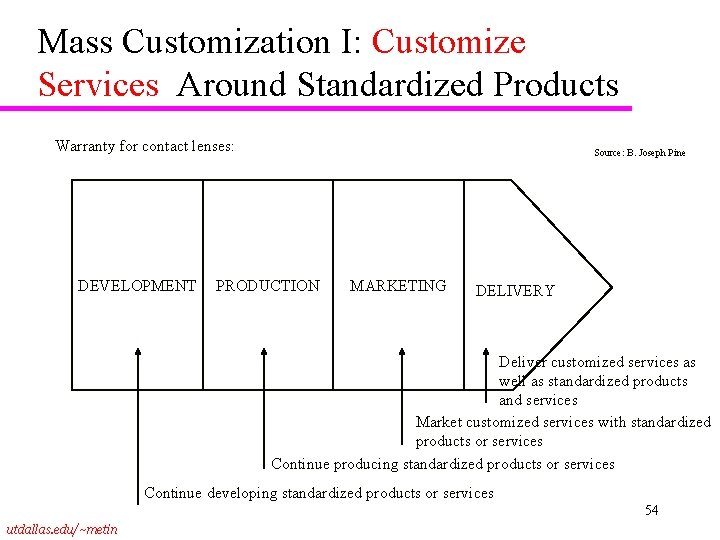
Mass Customization I: Customize Services Around Standardized Products Warranty for contact lenses: DEVELOPMENT Source: B. Joseph Pine PRODUCTION MARKETING DELIVERY Deliver customized services as well as standardized products and services Market customized services with standardized products or services Continue producing standardized products or services Continue developing standardized products or services 54 utdallas. edu/~metin
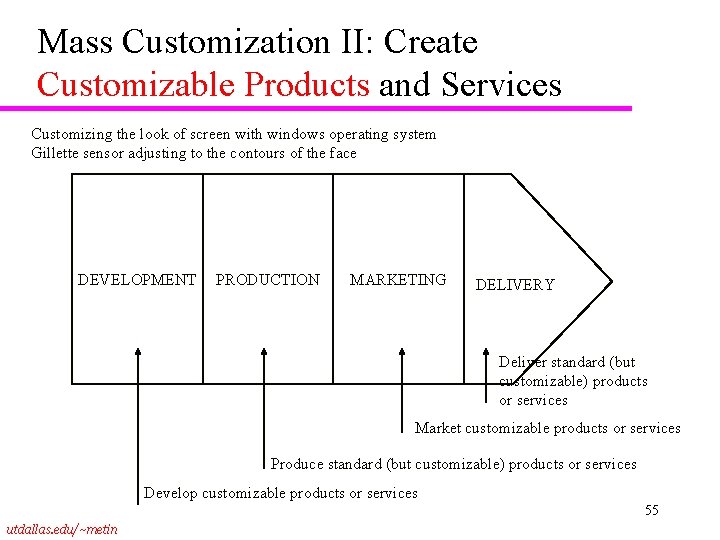
Mass Customization II: Create Customizable Products and Services Customizing the look of screen with windows operating system Gillette sensor adjusting to the contours of the face DEVELOPMENT PRODUCTION MARKETING DELIVERY Deliver standard (but customizable) products or services Market customizable products or services Produce standard (but customizable) products or services Develop customizable products or services 55 utdallas. edu/~metin
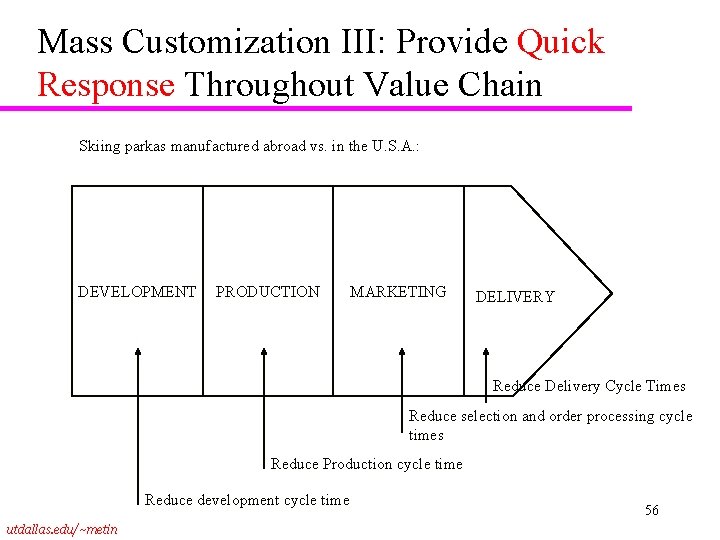
Mass Customization III: Provide Quick Response Throughout Value Chain Skiing parkas manufactured abroad vs. in the U. S. A. : DEVELOPMENT PRODUCTION MARKETING DELIVERY Reduce Delivery Cycle Times Reduce selection and order processing cycle times Reduce Production cycle time Reduce development cycle time utdallas. edu/~metin 56
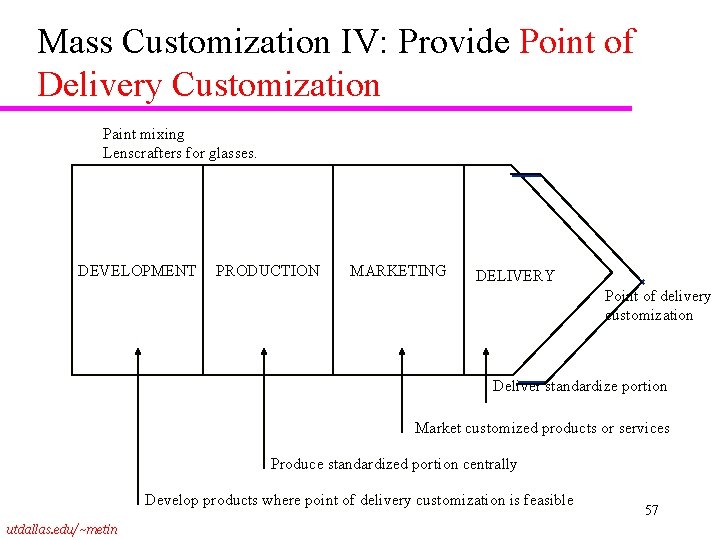
Mass Customization IV: Provide Point of Delivery Customization Paint mixing Lenscrafters for glasses. DEVELOPMENT PRODUCTION MARKETING DELIVERY Point of delivery customization Deliver standardize portion Market customized products or services Produce standardized portion centrally Develop products where point of delivery customization is feasible utdallas. edu/~metin 57
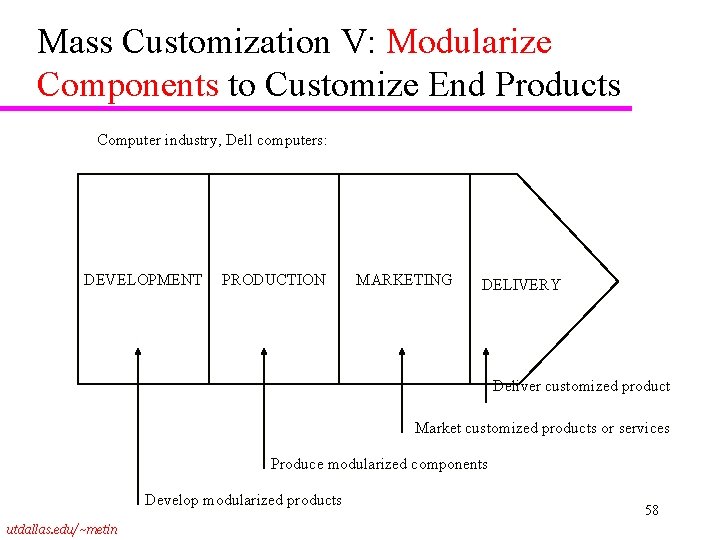
Mass Customization V: Modularize Components to Customize End Products Computer industry, Dell computers: DEVELOPMENT PRODUCTION MARKETING DELIVERY Deliver customized product Market customized products or services Produce modularized components Develop modularized products utdallas. edu/~metin 58
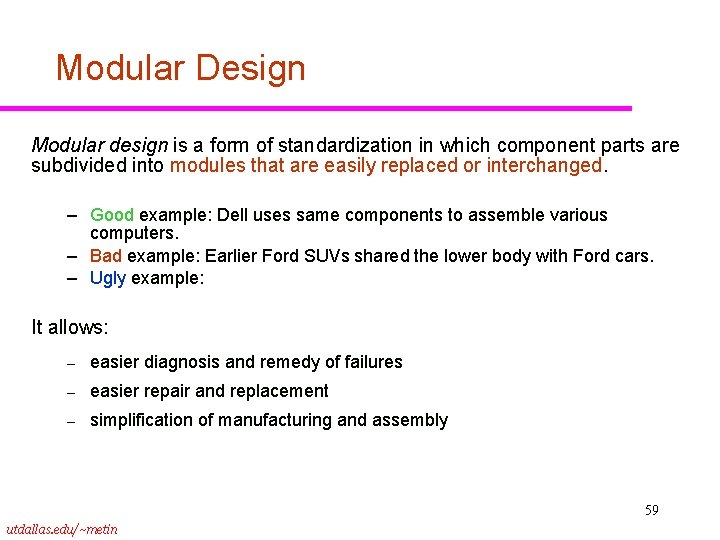
Modular Design Modular design is a form of standardization in which component parts are subdivided into modules that are easily replaced or interchanged. – Good example: Dell uses same components to assemble various computers. – Bad example: Earlier Ford SUVs shared the lower body with Ford cars. – Ugly example: It allows: – easier diagnosis and remedy of failures – easier repair and replacement – simplification of manufacturing and assembly 59 utdallas. edu/~metin
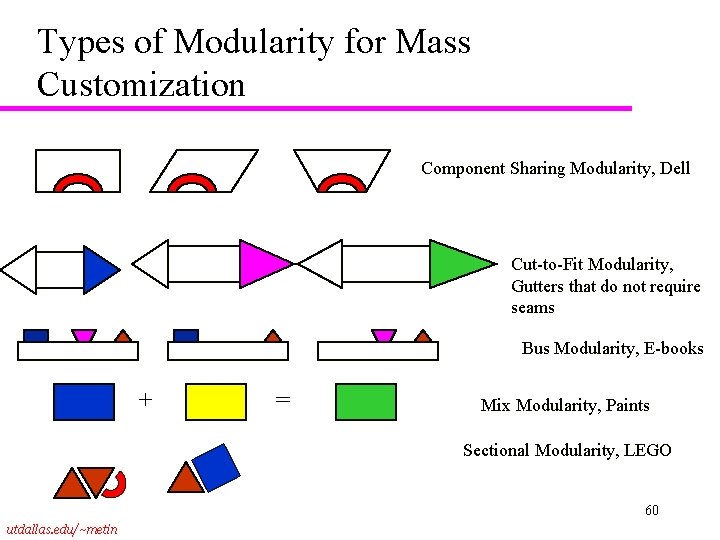
Types of Modularity for Mass Customization Component Sharing Modularity, Dell Cut-to-Fit Modularity, Gutters that do not require seams Bus Modularity, E-books + = Mix Modularity, Paints Sectional Modularity, LEGO 60 utdallas. edu/~metin
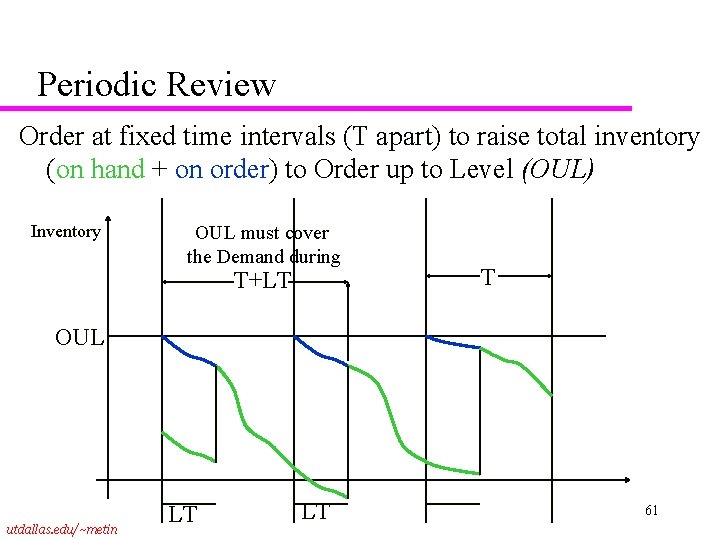
Periodic Review Order at fixed time intervals (T apart) to raise total inventory (on hand + on order) to Order up to Level (OUL) Inventory OUL must cover the Demand during T+LT T OUL utdallas. edu/~metin LT LT 61
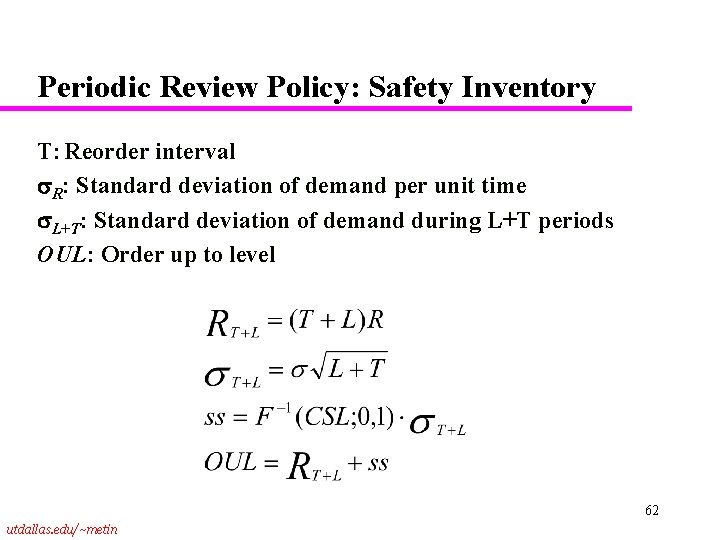
Periodic Review Policy: Safety Inventory T: Reorder interval R: Standard deviation of demand per unit time L+T: Standard deviation of demand during L+T periods OUL: Order up to level 62 utdallas. edu/~metin
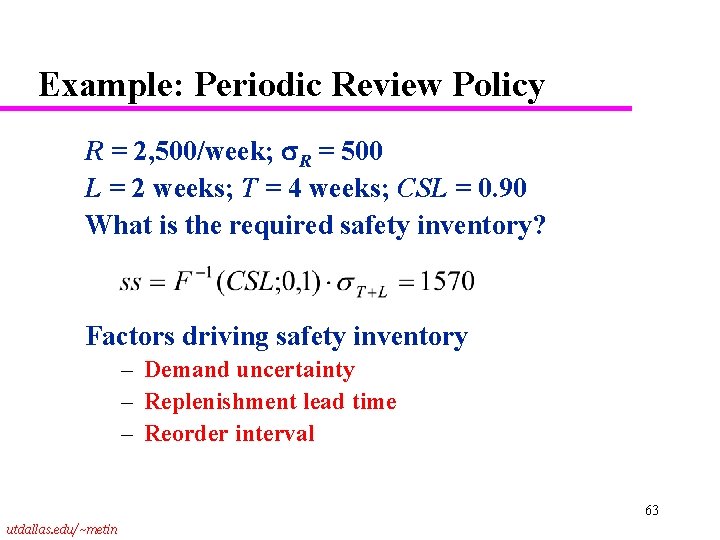
Example: Periodic Review Policy R = 2, 500/week; R = 500 L = 2 weeks; T = 4 weeks; CSL = 0. 90 What is the required safety inventory? Factors driving safety inventory – Demand uncertainty – Replenishment lead time – Reorder interval 63 utdallas. edu/~metin
Periodic vs Continuous Review u Periodic review ss covers the uncertainty over [0, T+L], T periods more than ss in continuous case. u Periodic review ss is larger. u Continuous review is harder to implement, use it for high-sales-value per time products 64 utdallas. edu/~metin