
S E C SERS ST Program Phase III
- Slides: 18
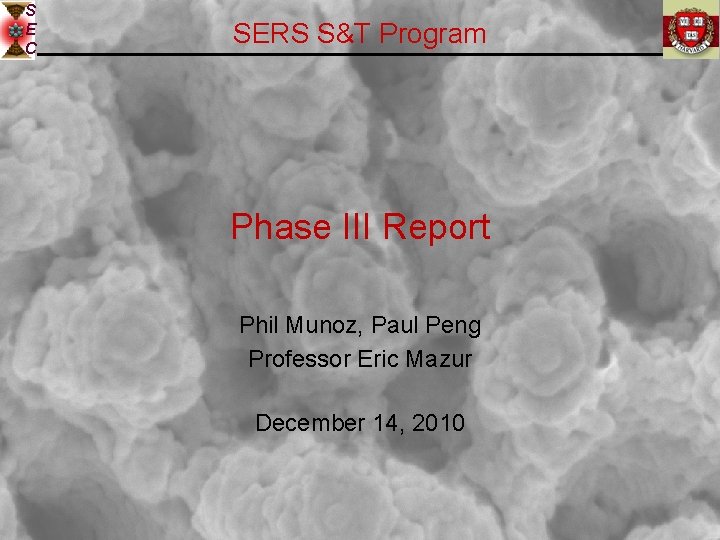
S E C SERS S&T Program Phase III Report Phil Munoz, Paul Peng Professor Eric Mazur December 14, 2010
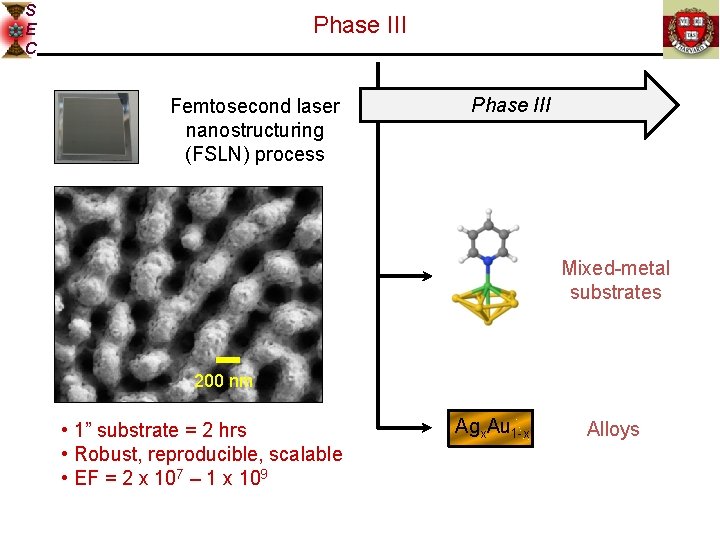
S E C Phase III Femtosecond laser nanostructuring (FSLN) process Phase III Mixed-metal substrates 200 nm • 1” substrate = 2 hrs • Robust, reproducible, scalable • EF = 2 x 10⁷ – 1 x 10⁹ Agx. Au 1 -x Alloys
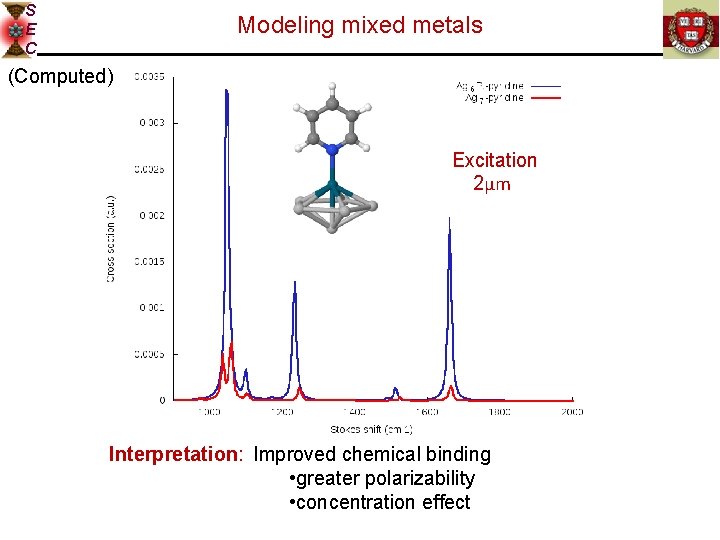
S E C Modeling mixed metals (Computed) Excitation 2μm Interpretation: Improved chemical binding • greater polarizability • concentration effect
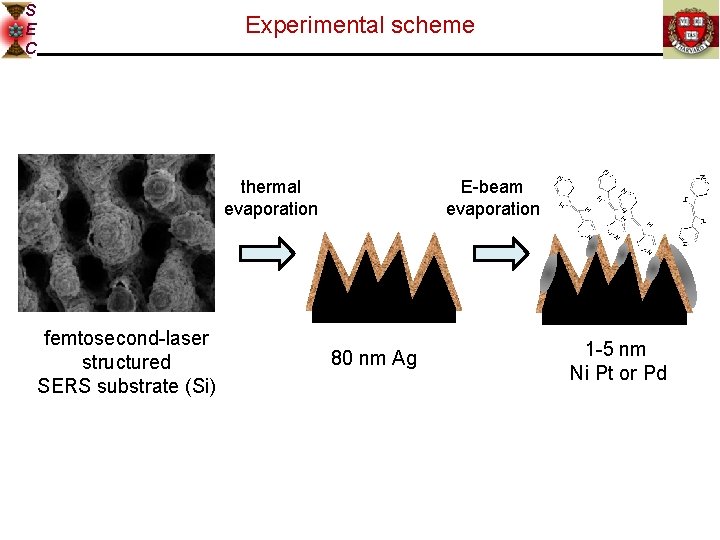
S E C Experimental scheme thermal evaporation femtosecond-laser structured SERS substrate (Si) E-beam evaporation 80 nm Ag 1 -5 nm Ni Pt or Pd
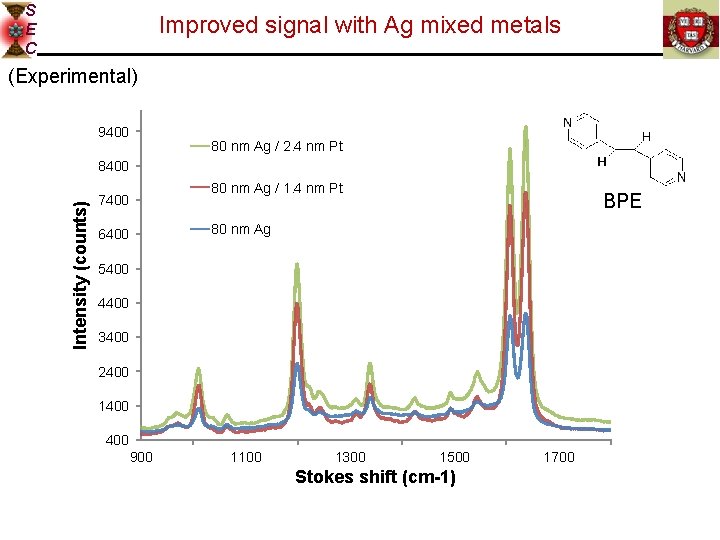
S E C Improved signal with Ag mixed metals (Experimental) 9400 80 nm Ag / 2. 4 nm Pt Intensity (counts) 8400 80 nm Ag / 1. 4 nm Pt 7400 BPE 80 nm Ag 6400 5400 4400 3400 2400 1400 900 1100 1300 1500 Stokes shift (cm-1) 1700
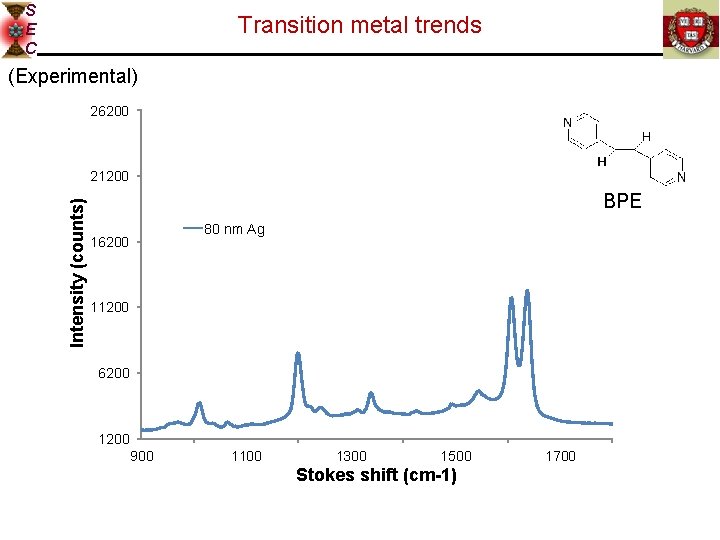
S E C Transition metal trends (Experimental) 26200 Intensity (counts) 21200 BPE 80 nm Ag 16200 11200 6200 1200 900 1100 1300 1500 Stokes shift (cm-1) 1700
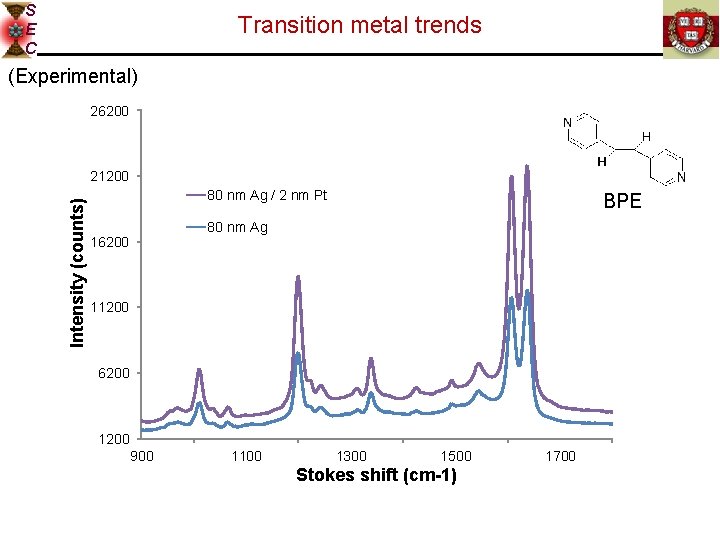
S E C Transition metal trends (Experimental) 26200 Intensity (counts) 21200 80 nm Ag / 2 nm Pt BPE 80 nm Ag 16200 11200 6200 1200 900 1100 1300 1500 Stokes shift (cm-1) 1700
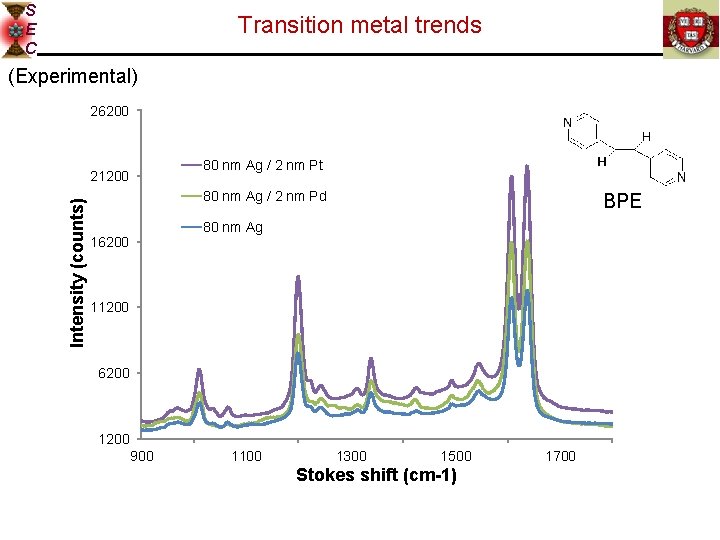
S E C Transition metal trends (Experimental) 26200 80 nm Ag / 2 nm Pt Intensity (counts) 21200 80 nm Ag / 2 nm Pd BPE 80 nm Ag 16200 11200 6200 1200 900 1100 1300 1500 Stokes shift (cm-1) 1700
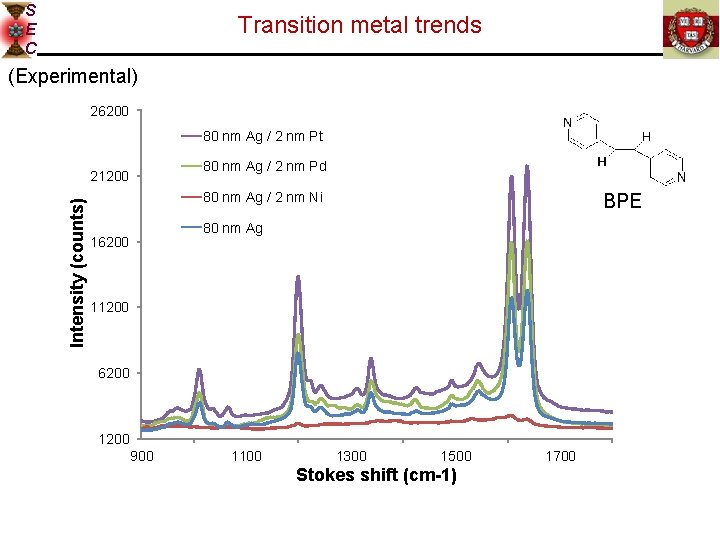
S E C Transition metal trends (Experimental) 26200 80 nm Ag / 2 nm Pt 80 nm Ag / 2 nm Pd Intensity (counts) 21200 80 nm Ag / 2 nm Ni BPE 80 nm Ag 16200 11200 6200 1200 900 1100 1300 1500 Stokes shift (cm-1) 1700
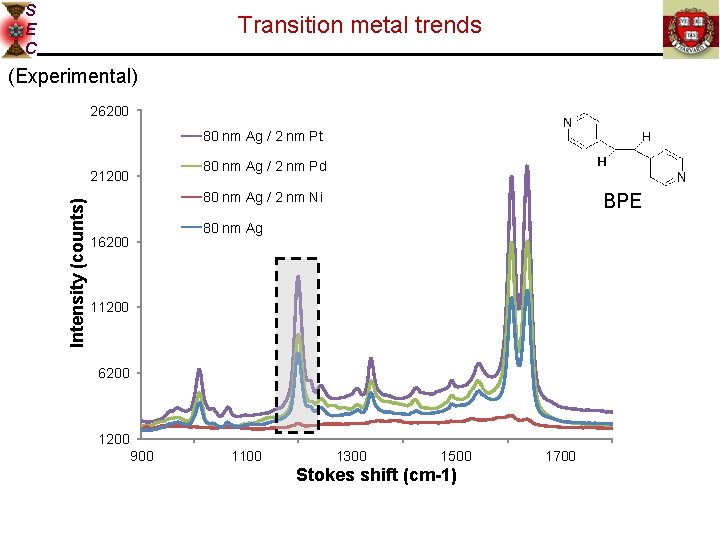
S E C Transition metal trends (Experimental) 26200 80 nm Ag / 2 nm Pt 80 nm Ag / 2 nm Pd Intensity (counts) 21200 80 nm Ag / 2 nm Ni BPE 80 nm Ag 16200 11200 6200 1200 900 1100 1300 1500 Stokes shift (cm-1) 1700
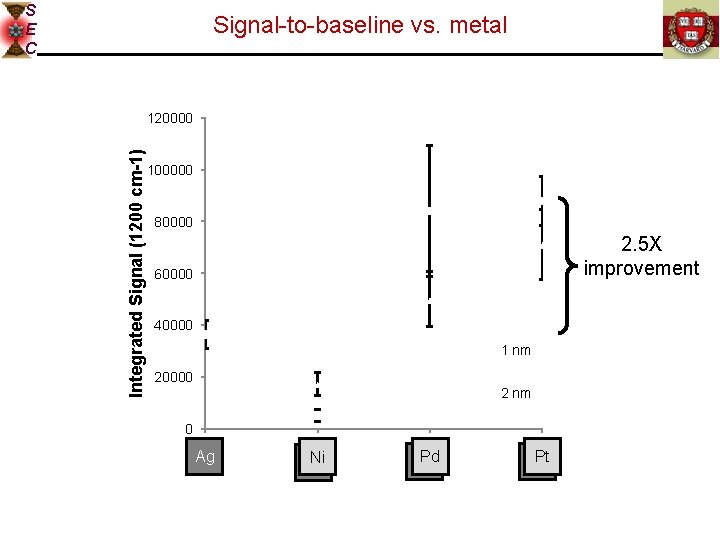
S E C Signal-to-baseline vs. metal Integrated Signal (1200 cm-1) 120000 100000 80000 2. 5 X improvement 60000 40000 1 nm 20000 2 nm 0 0 Ag 1 Ni Ag 2 Pd Ag 3 Pt Ag
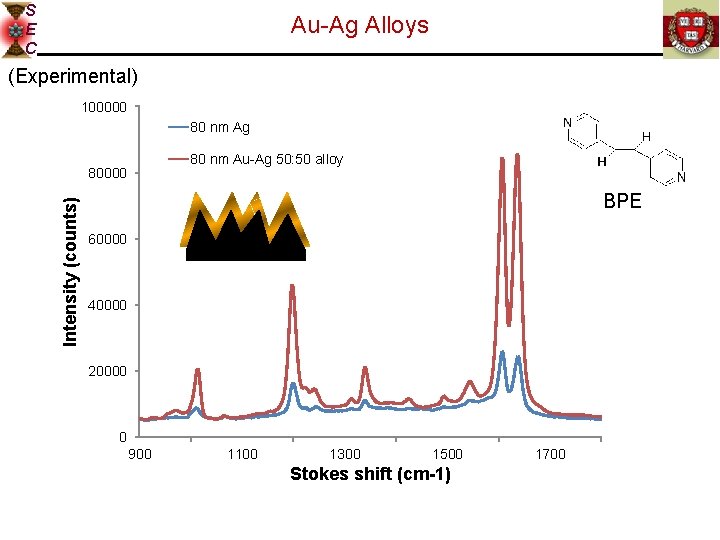
S E C Au-Ag Alloys (Experimental) 100000 80 nm Ag 80 nm Au-Ag 50: 50 alloy Intensity (counts) 80000 BPE 60000 40000 20000 0 900 1100 1300 1500 Stokes shift (cm-1) 1700
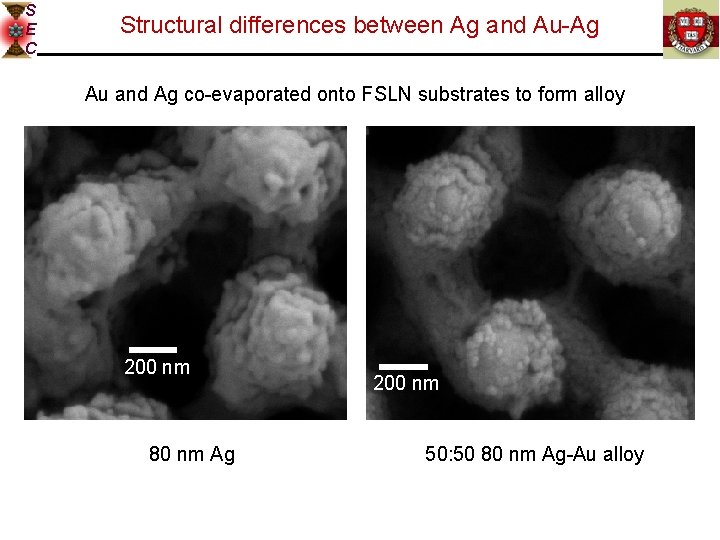
S E C Structural differences between Ag and Au-Ag Au and Ag co-evaporated onto FSLN substrates to form alloy 200 nm 80 nm Ag 200 nm 50: 50 80 nm Ag-Au alloy
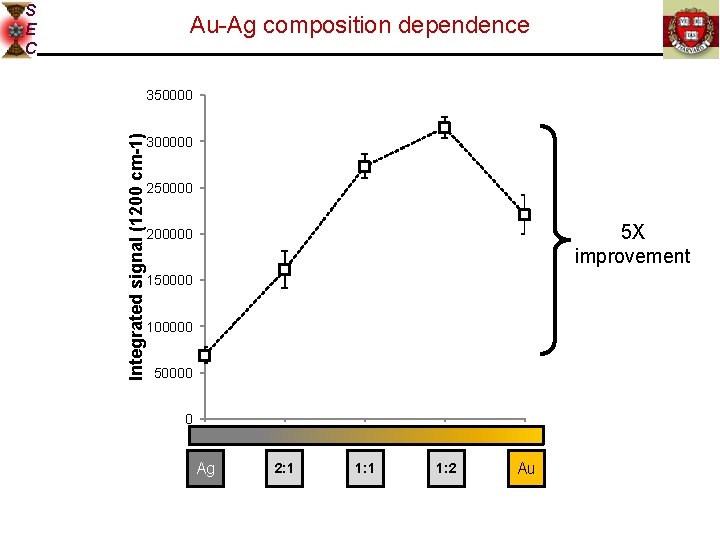
S E C Au-Ag composition dependence Integrated signal (1200 cm-1) 350000 300000 250000 5 X improvement 200000 150000 100000 50000 0 0 1 2 3 4 Ag 2: 1 1: 2 Au
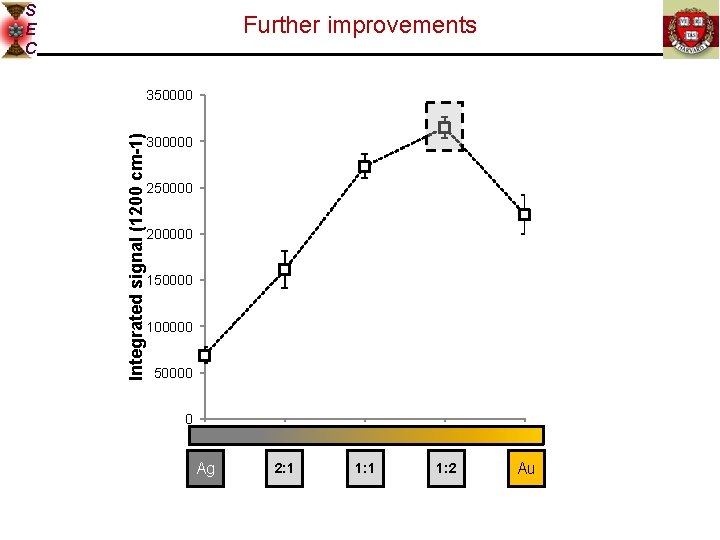
S E C Further improvements Integrated signal (1200 cm-1) 350000 300000 250000 200000 150000 100000 50000 0 0 1 2 3 4 Ag 2: 1 1: 2 Au
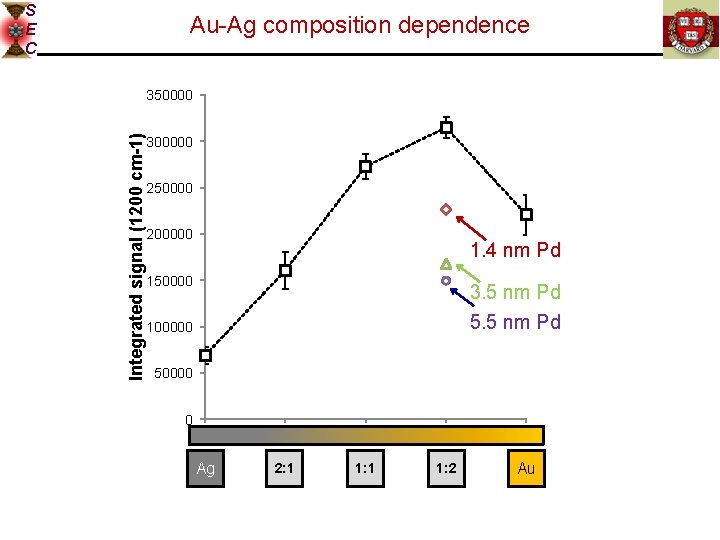
S E C Au-Ag composition dependence Integrated signal (1200 cm-1) 350000 300000 250000 200000 1. 4 nm Pd 150000 3. 5 nm Pd 5. 5 nm Pd 100000 50000 0 0 1 2 3 4 Ag 2: 1 1: 2 Au
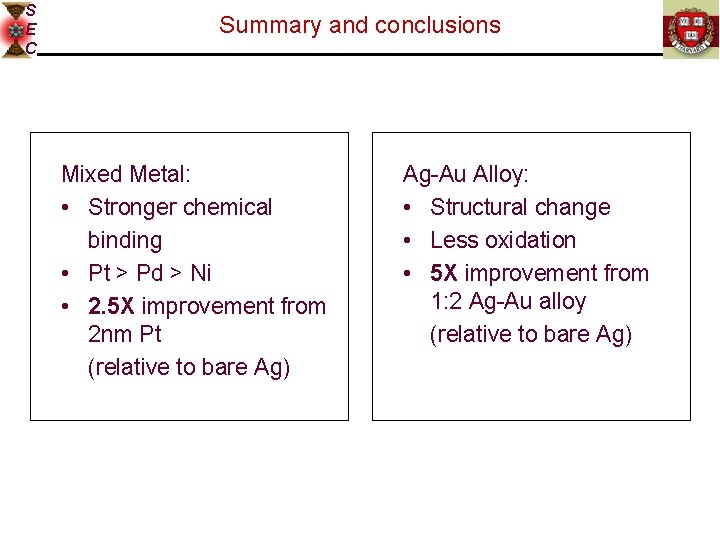
S E C Summary and conclusions Mixed Metal: • Stronger chemical binding • Pt > Pd > Ni • 2. 5 X improvement from 2 nm Pt (relative to bare Ag) Ag-Au Alloy: • Structural change • Less oxidation • 5 X improvement from 1: 2 Ag-Au alloy (relative to bare Ag)
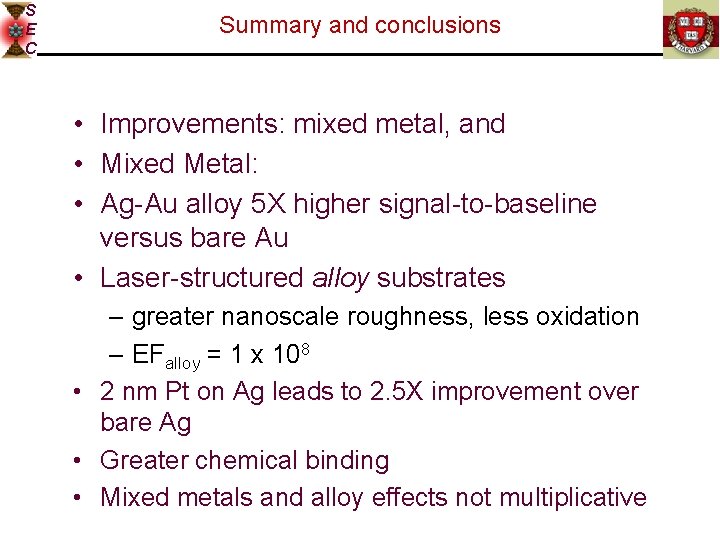
S E C Summary and conclusions • Improvements: mixed metal, and • Mixed Metal: • Ag-Au alloy 5 X higher signal-to-baseline versus bare Au • Laser-structured alloy substrates – greater nanoscale roughness, less oxidation – EFalloy = 1 x 10⁸ • 2 nm Pt on Ag leads to 2. 5 X improvement over bare Ag • Greater chemical binding • Mixed metals and alloy effects not multiplicative