Ryan White Part A Minority AIDS Initiative Service


")


 Funding")


 Utilization in FY 2017 -2018 v. FY 20162017 9 000")
 Utilization in FY 2017 -2018 v. FY 20162017 9 000")
 140 120")
 400 350")
 • Accounted for 22. 0% of Part A/MAI services utilized")
 • Accounted for 20. 7% of Part A/MAI")


 • Accounted for 0. 03% of Part A/MAI services utilized")


 v. FY 2016 -2017 Part A/MAI Clients (N)")
 v. FY 2016 -2017 Unitss of Service (N)")

 • Accounted for 4. 6% of Part A/MAI services utilized")


 • Accounted for 0. 04% of Part A/MAI services utilized and")
 • Accounted for 0. 21% of Part A/MAI")
 • Accounted for 1. 9% of Part A/MAI services")


 Female 22. 6% (N=653)")


 HIV 50. 6%")


. Marion County")
- Slides: 67
Ryan White Part A & Minority AIDS Initiative Service Utilization in the Indianapolis Transitional Grant Area: FY 2017 -2018 June 7, 2018 Sam Parmar, MPH SParmar@Marion. Health. org
Objective • To provide the Ryan White Planning Council with information necessary for FY 2019 -2020 priority setting and allocation
The Indianapolis Transitional Grant Area (TGA)
Indianapolis TGA Population • Ten Central Indiana counties with an estimated population of 1. 89 million 1 (6% increase since 2010)2 3
TGA Population Center 88% of the TGA’s population in orange 4 46% reside inside Indianapolis city limits 1
Overview of Part A and Minority AIDS Initiative (MAI) Funding
Overview of Part A and MAI Funding • Part A Funding = Formula + Supplemental 5 • Formula funds are based on the number of people living with HIV/AIDS (PLWH/A) in the TGA • Supplemental funds are awarded competitively based on demonstrated need and other selective criteria • Includes core medical and support services designed to provide a continuum of care for PLWH/A • Core Medical • Must account for at least 75% of Part A funds allocated for services (without a waiver) • Support Services • Must be linked to the continuum of care and cannot exceed 25% of Part A funds allocated for services unless a waiver is obtained
Overview of Part A and MAI Funding • MAI Funding 5 • Funding based on distribution of PLWH/A among racial/ethnic minorities residing in the TGA • Supports services for minority populations • Data Sources • Utilization data collected using the Ryan White Information Services Enterprise (RISE) database 6 • Clinical and outcomes data collected using RISE, CAREWare, and the Enhanced HIV/AIDS Reporting System (e. HARS) database 7
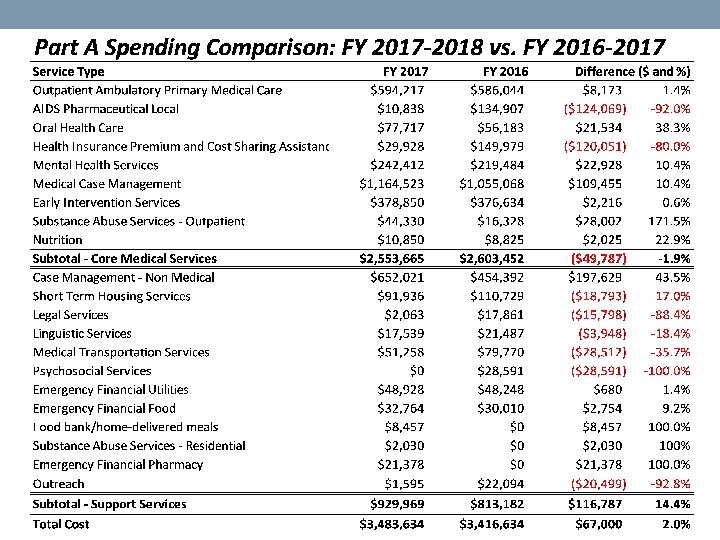
All Parts Spending in the Indianapolis TGA
Part A and MAI Service Utilization
Part A/MAI Utilization: FY 2017 -2018 • During FY 2017 -2018: • 2, 799 unique clients utilized 28, 303 units of service excluding 8, 492 EIS tests administered • Core Medical accounted for 63. 1% of Part A/MAI service units and 72. 6% of dollars spent at an average cost of $111 per unit • Support Services accounted for 37. 0% of Part A/MAI service units and 27. 4% of dollars spent at an average cost of $72 per unit
Part A/MAI Utilization: FY 2017 -2018 vs. FY 2016 -2017 • The number of clients and services utilized increased considerably during FY 2017 -2018 • Number of clients increased 4. 0% (2, 799 v. 2, 690) • Number of EIS tests increased 10. 8% (8, 492 v. 7, 664) • Units of non-EIS service increased 1. 2% (28, 303 v. 27, 952) • Cost per client decreased 1. 2% ($1, 338 v. $1, 354)
Utilization of Core Medical Services
Part A/MAI Clients (N) Utilization in FY 2017 -2018 v. FY 20162017 9 000 8 000 7 000 6 000 5 000 4 000 3 000 2 000 1 000 0 EIS Medical Case Amb/Pri Mental Health Mgt Medical Care FY 2017 -2018 FY 2016 -2017
Unitss of Service (N) Utilization in FY 2017 -2018 v. FY 20162017 9 000 8 000 7 000 6 000 5 000 4 000 3 000 2 000 1 000 0 EIS Medical Case Amb/Pri Mental Health Mgt Medical Care FY 2017 -2018 FY 2016 -2017
Utilization in FY 2017 -2018 v. FY 20162017 Part A/MAI Clients (N) 140 120 100 80 60 40 20 0 Oral Health Local AIDS Health Substance Care Rx Assist. Insurance Abuse Outpatient FY 2017 -2018 FY 2016 -2017 Nutrition
Utilization in FY 2017 -2018 v. FY 20162017 Unitss of Service (N) 400 350 300 250 200 150 100 50 0 Oral Health Local AIDS Health Substance Care Rx Assist. Insurance Abuse Outpatient FY 2017 -2018 Nutrition FY 2016 -2017
Early Intervention Services (EIS) • Accounted for 22. 0% of Part A/MAI services utilized and 10. 2% of dollars spent • Utilized by 8, 090 clients, a increase of 6. 9% from FY 16 (N=7, 568) • 1. 0 service unit per client • Averaged $47 per client, a decrease of 6% from FY 16 ($50)
Medical Case Management (Including Treatment Adherence) • Accounted for 20. 7% of Part A/MAI services utilized and 31. 3% of dollars spent • Utilized by 2, 703 clients, an increase of 21. 5% from FY 16 (N=2, 225) • Averaged 3. 0 service units per client, a decrease of 18. 9% from FY 16 (N=3. 7) • Averaged $430. 83 per client, a decrease of 13. 3% from FY 16 ($496. 74)
Outpatient Ambulatory/Primary Medical Care • Accounted for 10% of Part A/MAI services utilized and 18% of dollars spent • Utilized by 635 clients, an increase of 19. 6% from FY 16 (N=531) • Averaged 6. 1 service units per client, a decrease of 15. 3% from FY 16 (N=7. 2) • Averaged $1, 055. 23 per client, a decrease of 14. 5% from FY 16 ($1, 234. 81)
Mental Health Services • Accounted for 5. 2% of Part A/MAI services utilized and 8. 4% of dollars spent • Utilized by 407 clients, a increase of 49. 1% from FY 16 (N=273) • Averaged 7. 4 service units per client, an increase of 8. 8% from FY 16 (N= 6. 8) • Averaged $763. 77 per client, an decrease of 13. 3% from FY 16 ($880. 53)
Oral Health Care • Accounted for 0. 9% of Part A/MAI services utilized and 2. 1% of dollars spent • Utilized by 110 clients, a increase of 7. 8% from FY 16 (N=102) • Averaged 3. 0 service units per client, no change from FY 16 • Averaged $706. 52 per client, an increase of 28. 3% from FY 16 ($550. 81)
AIDS Pharmacy Assistance (Local) • Accounted for 0. 03% of Part A/MAI services utilized and 0. 3% of dollars spent • Utilized by 6 clients, a decrease of 93. 8% from FY 16 (N=97) • Averaged 2. 2 service units per client, a decrease of 4. 3% from FY 16 (2. 3) • Averaged $1, 806. 33 per client, a increase of 29. 9% from FY 16 ($1, 390. 79)
Health Insurance Premium & Cost Sharing Assistance • Accounted for 0. 03% of Part A/MAI services utilized and 0. 8% of dollars spent • Utilized by 9 clients, an decrease of 78. 6% from FY 16 (N=42) • Averaged 1. 2 service units per client, a decrease of 84% from FY 16 (N=7. 5) • Averaged $3, 325. 33 per client, a decrease of 6. 9% from FY 16 ($3, 570. 93)
Substance Abuse Services - Outpatient • Accounted for 0. 9% of Part A/MAI services utilized and 1. 2% of dollars spent • Utilized by 33 clients, no change from FY 16 (N=33) • Averaged 10. 9 service units per client, an increase of 230% from FY 16 (N=3. 3) • Averaged $1, 342. 42 per client, a increase of 171. 3% from FY 16 ($494. 79)
Nutrition Services • Accounted for 0. 6% of Part A/MAI services utilized and 0. 3% of dollars spent • Utilized by 115 clients, an increase of 43. 8% from FY 16 (N=80) • Averaged 2. 1 service units per client, an increase of 23. 5% from FY 16 (N=1. 7) • Averaged $94. 35 per client, an decrease of 14. 5% from FY 16 ($110. 31)
Utilization of Support Services
Utilization in FY 2017 -2018 v. FY 20162017 2 500 2 000 1 500 1 000 500 ut r O ic al ed M ea ch . . Tr a $ nc y ge er ns p. Fo. . . R R E/ FY 2017 -2018 Em -M ed on N H as e . . . 0 C Part A/MAI Clients (N) 3 000 FY 2016 -2017
M ed i ea ch ca l. T ut r ra $ cy ge n Em er FY 2017 -2018 O ns p . . . Fo R R E/ H e as C ed N on -M . . . 9 000 8 000 7 000 6 000 5 000 4 000 3 000 2 000 1 000 0. . . Units of Service (N) Utilization in FY 2017 -2018 v. FY 20162017 FY 2016 -2017
oc ia l tic Ps yc ho -s is ga l FY 2017 -2018 Li ng u $ Em er ge nc y Te rm or t Sh Le U ou ti. . . 180 160 140 120 100 80 60 40 20 0 H Part A/MAI Clients (N) Utilization in FY 2017 -2018 v. FY 20162017 FY 2016 -2017
Utilization in FY 2017 -2018 v. FY 20162017 250 200 150 100 50 oc ia l tic ho -s is Ps yc er Em FY 2017 -2018 Li ng u $ ge nc y Le ti. U ou. H m t. T er or Sh ga l . . 0. . Units of Service (N) 300 FY 2016 -2017
Utilization in FY 2017 -2018 (new) v. FY 2016 -2017 Part A/MAI Clients (N) 35 30 25 20 15 10 5 0 Emergency Substance Abuse Food bank/home. Pharmacy - Residential delivered meals FY 2017 -2018 FY 2016 -2017
Utilization in FY 2017 -2018 (new) v. FY 2016 -2017 Unitss of Service (N) 800 700 600 500 400 300 200 100 0 Emergency Pharmacy Substance Abuse Food bank/home- Residential delivered meals FY 2017 -2018 FY 2016 -2017
Non-Medical Case Management • Accounted for 21. 5% of Part A/MAI services utilized and 17. 5% of dollars spent • Utilized by 2, 462 clients, an increase of 10. 6% from FY 16 (N=2, 225) • Averaged 3. 4 service units per client, an increase of 25. 9% from FY 16 (N=2. 7) • Averaged $264. 85 per client, an increase of 29. 7% from FY 16 ($204. 22)
Health Education/Risk Reduction (HE/RR) • Accounted for 4. 6% of Part A/MAI services utilized and 2. 4% of dollars spent • Utilized by 585 clients, a increase of 15. 4% from FY 16 (N=507) • Averaged 3. 0 service units per client – no change from FY 16 • Averaged $153. 78 per client, a decrease of 7. 2% from FY 16 ($165. 81)
Outreach Services • Accounted for 1. 5% of Part A/MAI services utilized and 0. 04% of dollars spent • Utilized by 36 clients, a decrease of 85. 6% from FY 16 (N=250) • Averaged 16. 3 service units per client, an increase of 608. 7% from FY 16 (N=2. 3) • Averaged $40. 28 per client, a decrease of 54. 4% from FY 16 ($88. 38)
Emergency Financial: Food • Accounted for 2. 6% of Part A/MAI services utilized and 0. 9% of dollars spent • Utilized by 432 clients, a increase of 6. 4% from FY 16 (N=406) • Averaged 2. 3 service units per client, a increase of 4. 5% from FY 16 (2. 2) • Averaged $75. 84 per client, a increase of 2. 6% from FY 16 ($73. 92)
Medical Transportation Services • Accounted for 3. 0% of Part A/MAI services utilized and 1. 4% of dollars spent • Utilized by 280 clients, an decrease of 20. 2% from FY 16 (N=351) • Averaged 4. 1 service units per client, a decrease of 51. 2% from FY 16 (N=8. 4) • Averaged $183. 06 per client, an decrease of 19. 4% from FY 16 ($227. 26)
Short Term Housing • Accounted for 0. 5% of Part A/MAI services utilized and 2. 5% of dollars spent • Utilized by 143 clients, a decrease of 10. 6% from FY 16 (N=160) • Averaged 1. 3 service units per client, no change from FY 16 • Averaged $642. 91 per client, an decrease of 7. 1% from FY 16 ($692. 06)
Emergency Financial: Utilities • Accounted for 0. 4% of Part A/MAI services utilized and 1. 3% of dollars spent • Utilized by 122 clients, an decrease of 20. 3% from FY 16 (N=153) • Averaged 1. 4 service units per client, an decrease of 6. 7% from FY 16 (N=1. 5) • Averaged $401. 05 per client, an increase of 27. 2% from FY 16 ($315. 35)
Legal Services • Accounted for 0. 04% of Part A/MAI services utilized and 0. 1% of dollars spent • Utilized by 10 clients, an decrease of 86. 1% from FY 16 (N=72) • Averaged 1. 5 service units per client, a decrease of 34. 8% from FY 16 (N=2. 3) • Averaged $206. 30 per client, a decrease of 16. 8% from FY 16 ($248. 07)
Linguistic Services • Accounted for 0. 7% of Part A/MAI services utilized and 0. 5% of dollars spent • Utilized by 48 clients, an increase of 9. 1% from FY 16 (N=44) • Averaged 5. 6 service units per client, a decrease of 13. 8% from FY 16 (N=6. 5) • Averaged $365. 40 per client, an decrease of 25. 2% from FY 16 ($488. 34)
Emergency Pharmacy (new) • Accounted for 0. 04% of Part A/MAI services utilized and 0. 6% of dollars spent • Utilized by 13 clients • Averaged 1. 2 service units per client • Averaged $1644. 46 per client
Substance Abuse Services – Residential (new) • Accounted for 0. 21% of Part A/MAI services utilized and 0. 1% of dollars spent • Utilized by 5 clients • Averaged 16 service units per client • Averaged $406. 00 per client
Food Bank/Home delivered Meals (new) • Accounted for 1. 9% of Part A/MAI services utilized and 0. 2% of dollars spent • Utilized by 31 clients • Averaged 23. 7 service units per client • Averaged $272. 81 per client
Part A/MAI Client Profile
Client Status and Time Enrolled • During FY 2017 -2018, a total of 2, 799 unique clients utilized Part A and/or MAI services, an increase of 4. 0% over FY 2016 -2017 (N=2, 690) • Of clients served, 71. 9% (N=2, 013) have an active client status, a increase of 5. 1% over FY 2016 -2017 (66. 8%) • Of unique clients served, 7. 7% (N=216) applied for and accessed Ryan White services for the first time, a decrease 3. 2% over FY 2016 -2017 (10. 9%)
Percent of Part A/MAI Clients by Enrollment Status 80% N=2, 013 70% 60% 50% 40% N=748 30% 20% 10% 0% Active Inactive N=22 Died Moved Enrollment Status
Part A/MAI Clients by Gender Transgende r 1. 9% (N=52) Female 22. 6% (N=653) Male 75. 6% (N=2, 097)
Percent of Part A/MAI Clients by Current Age 30% 25% N=731 N=658 20% N=628 N=517 15% 10% 5% 0% N=115 <18 18 -24 years N=144 25 -34 years 35 -44 years 45 -54 years Current Age (Yrs. ) 55 -64 years 65+ years
Percent of Part A/MAI Clients by Race/Ethnicity 60% 50% N=1, 363 40% N=930 30% 20% 10% 0% N=251 Black White N=99 Hispanic/Latino Asian/Pacific Islander Race/Ethnicity N=46 Other
Part A/MAI Clients by HIV Status AIDS 49. 4% (N=1, 387) HIV 50. 6% (N=1, 419)
Percent of Part A/MAI Clients by Exposure Category 60% 50% N= 1, 449 40% 30% 20% N=634 10% 0% N=233 MSM Hetero. Contact N=158 Not MSM and identified IDU N=125 N=19 <5 IDU Perinatal exposure Other HIV Exposure Category
Part A/MAI Clients by Poverty Level Percent of Part A/MAI Clients 60% 50% N=1, 065 40% 30% 20% 10% 0% N=270 N=244 N=194 N=112 0 - 100% 101 - 150% 151 - 200% 201 - 250% 251 - 300% Percent of Federal Poverty Level N=0 >300%
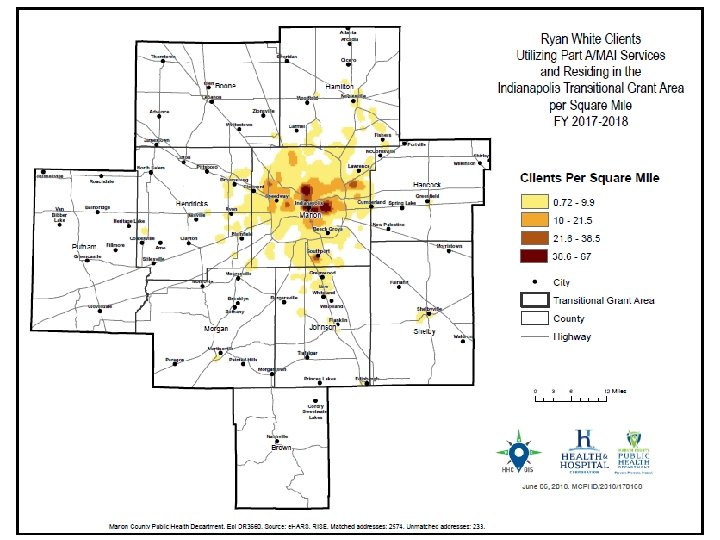
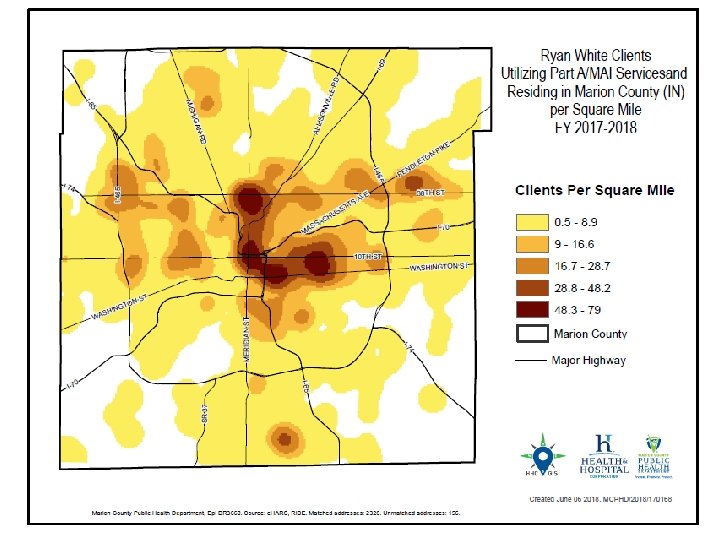
Part A/MAI Clients by County of Residence • During FY 2017, 46. 0% of PLWH/A in the TGA utilized Part A/MAI services (2, 806 of 6, 092) – up from 45. 5% • 50. 6% of Marion County PLWH/A accessed services – up from 49. 3% • 21. 9% of PLWH/A in the outlying counties accessed services – down from 23. 8% N missing = 7
HIV Continuum of Care in the TGA
HIV Care Continuum Definitions • Linked to Care: People newly diagnosed with HIV during FY 2017 who received a CD 4/viral load test within 90 days • Retained in Care: Residents living with HIV/AIDS with 2+ CD 4/viral load tests performed at least 3 months apart in FY 2017 • Antiretroviral Therapy: Residents living with HIV/AIDS who received a prescription for antiretroviral therapy in FY 2017 • Viral Load Suppression: Residents living with HIV/AIDS with a FY 2017 viral load result <200 RNA copies/m. L
Ryan White Clients v. Non-Client PLWH/A 90, 6% Linked to Care * Retained in Care ART Rx Virally Suppressed 73, 1% 61, 3% 37, 2% Min. 52. 8% (Est. 54. 2%) 68, 2% 48, 6% RWSP Clients Non-Clients * The National HIV/AIDS Strategy goal is 30 days until linkage to care. When using that benchmark, only 55. 1% of RWSP clients and 57. 9% of non-RWSP clients were linked to care.
Michael Butler Director Sam Parmar, MPH Epidemiologist Ryan White HIV Services Program Health & Hospital Corporation Marion County Public Health Department http: //Ryan. White. Indy. org
References U. S. Census Bureau and Marion County Public Health Department. (2017). Marion County Public Health Department estimates based on ARIMA projections calculated using U. S. Census Bureau data 1 U. S. Census Bureau. (2002). Time series of Indiana intercensal population estimates by county: April 1, 1990 to April 1, 2000. Table CO-EST 2001 -12 -18. Release date April 17, 2002. 2 U. S. Census Bureau. (2011). Intercensal estimates of the resident population for counties of Indiana: April 1, 2000 to July 1, 2010. Table CO-EST 00 INT-01 -18. 3 Glenn, R. (2011). Demographics & trends: Indianapolis, Marion County & the Indianapolis region. Department of Metropolitan Development: City of Indianapolis. 4 Health Resources and Services Administration. (2014). About the Ryan White HIV/AIDS program – About Part A: Grants to emerging metropolitan & transitional grant areas. Washington D. C. : U. S. Department of Health and Human Services. Available at http: //hab. hrsa. gov/abouthab/parta. html 5 Ryan White HIV Services Program. (2014). Ryan White Information Services Enterprise (RISE). Indianapolis: Marion County Public Health Department. 6 Centers for Disease Control and Prevention. (2014). Enhanced HIV/AIDS Reporting System (e. HARS). Indianapolis: Indiana State Department of Health. 7 U. S. Department of Health & Human Services. (2015). 2015 poverty guidelines. Retrieved from https: //aspe. hhs. gov/2015 -poverty-guidelines. 8