
Rwanda Debt Status Policies Ministry of Finance and
Rwanda Debt Status & Policies Ministry of Finance and Economic Planning EPRN POLICY DIALOGUE By Amina Rwakunda, Chief Economist MINECOFIN and EPRN Deputy President of the Board
Presentation Outline 1. Debt Global Context 2. Rwanda Debt Status 1
1) Debt Global Context
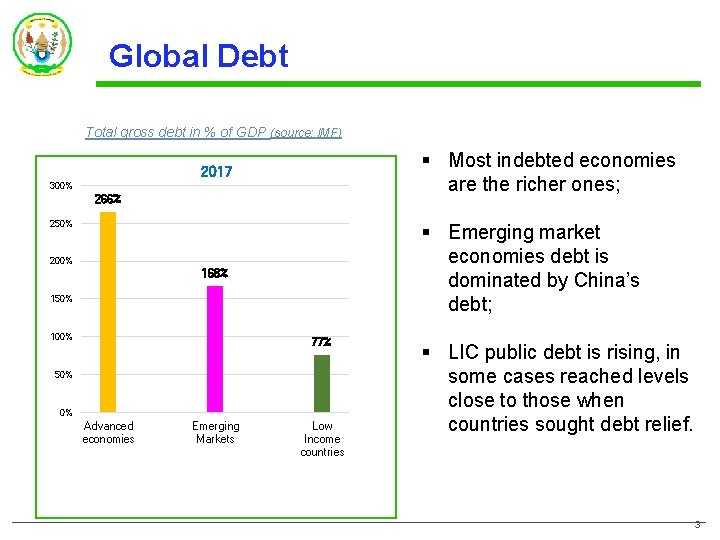
Global Debt Total gross debt in % of GDP (source: IMF) 2017 § Most indebted economies are the richer ones; 168% § Emerging market economies debt is dominated by China’s debt; 300% 266% 250% 200% 150% 100% 77% 50% 0% Advanced economies Emerging Markets Low Income countries § LIC public debt is rising, in some cases reached levels close to those when countries sought debt relief. 3
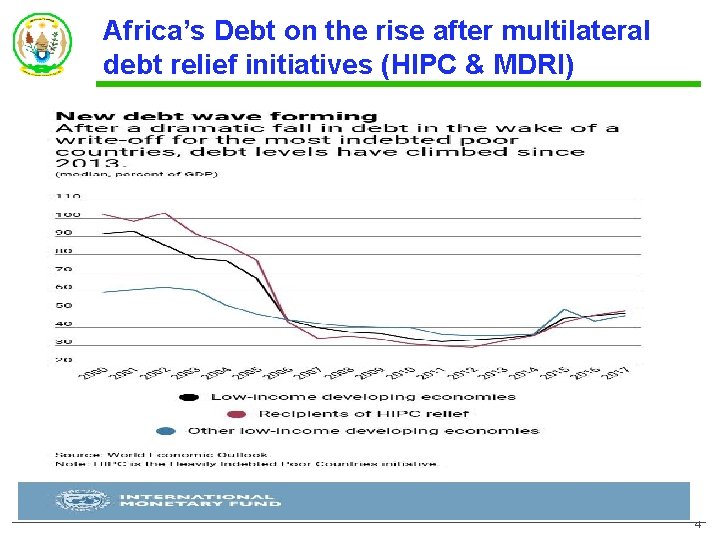
Africa’s Debt on the rise after multilateral debt relief initiatives (HIPC & MDRI) 4
Debt vulnerabilities are increasing - Causes 1. Scarce concessional financing(decline in aid, limited access to concessional money) while infrastructure needs and SDGs financing required are huge; 2. Low quality of public investments; 3. Weak macroeconomic conditions: recent volatility of commodity prices, as well as exchange rate, interest rates, fiscal slippages, subdued economic growth, low growth in tax revenues etc. ; 4. Changing lenders landscape (share of bilateral and multilateral resources declined, some projects are not eligible for concessional financing, easy access to international market…) and growing interest bills; 5. Many countries have weaknesses in Public finances in general and limited improvement in debt management. 5
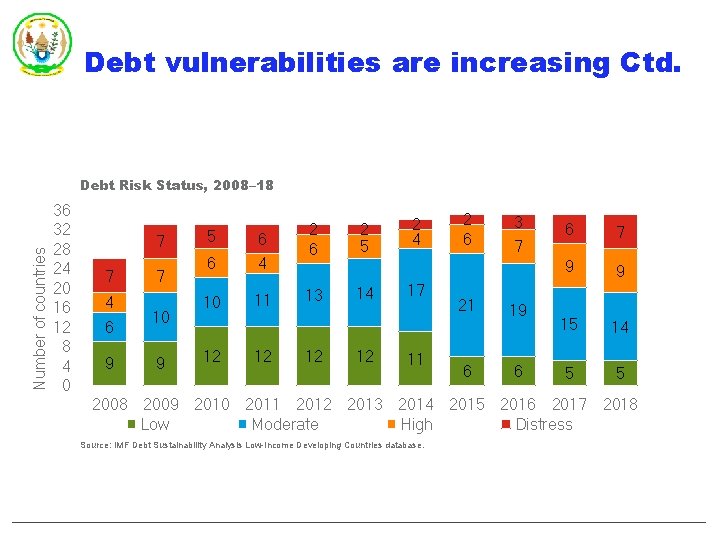
Debt vulnerabilities are increasing Ctd. Number of countries Debt Risk Status, 2008– 18 36 32 28 24 20 16 12 8 4 0 7 7 4 6 9 7 10 9 5 6 6 4 10 11 12 12 2 6 13 12 2 5 14 12 2 4 17 11 2 6 21 6 3 7 19 6 6 7 9 9 15 14 5 5 2008 2009 2010 2011 2012 2013 2014 2015 2016 2017 2018 Low Moderate High Distress Source: IMF Debt Sustainability Analysis Low-Income Developing Countries database. Recent Developments and Outlook Challenges Macro Policies Managing th Impact of Conflict Boosting Intra-Regional Trade
Debt vulnerabilities are notably elevated Responses 1. Further fiscal adjustment; 2. Domestic resources mobilization strategy; 3. Recovery in output growth; 4. Public finance reforms; 5. Build capacity in debt management; Strong economic growth and sound macroeconomic management are key to debt sustainability. 7

2) Rwanda Debt Status and Policies
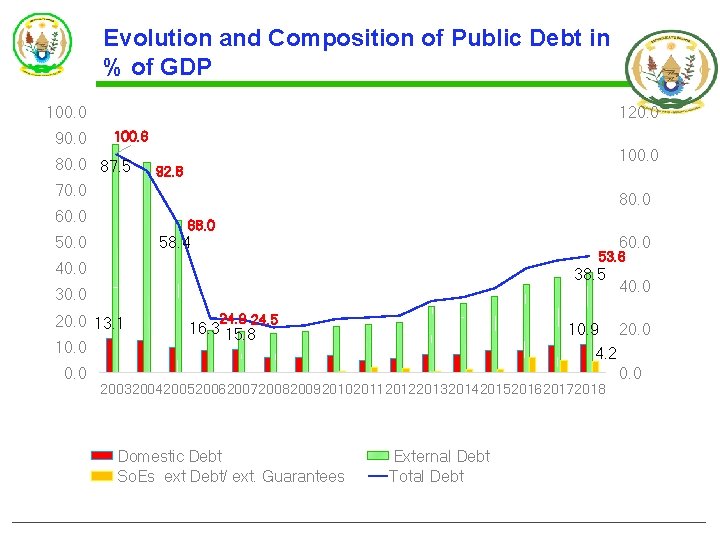
Evolution and Composition of Public Debt in % of GDP 100. 0 90. 0 120. 0 100. 6 80. 0 87. 5 70. 0 60. 0 100. 0 92. 8 80. 0 68. 0 50. 0 60. 0 58. 4 53. 6 40. 0 38. 5 30. 0 20. 0 13. 1 10. 0 24. 9 24. 5 16. 3 15. 8 10. 9 20. 0 4. 2 0. 0 2003200420052006200720082009201020112012201320142015201620172018 Domestic Debt So. Es ext Debt/ ext. Guarantees 40. 0 External Debt Total Debt
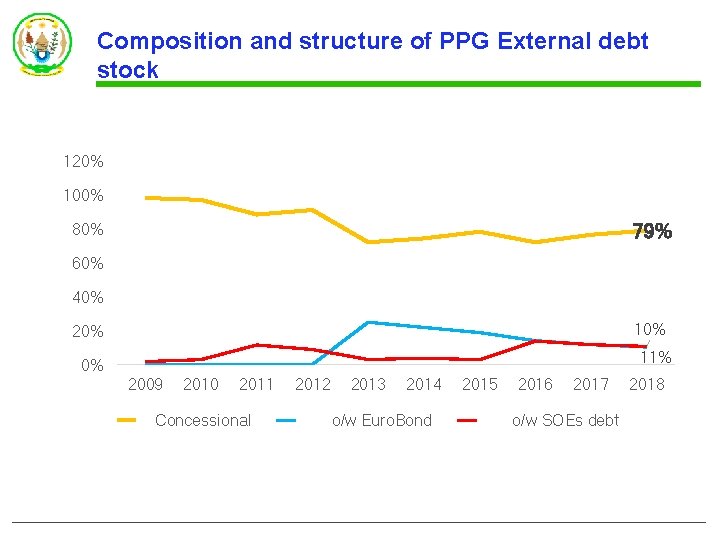
Composition and structure of PPG External debt stock 120% 100% 79% 80% 60% 40% 10% 20% 11% 0% 2009 2010 2011 Concessional 2012 2013 2014 o/w Euro. Bond 2015 2016 2017 o/w SOEs debt 2018
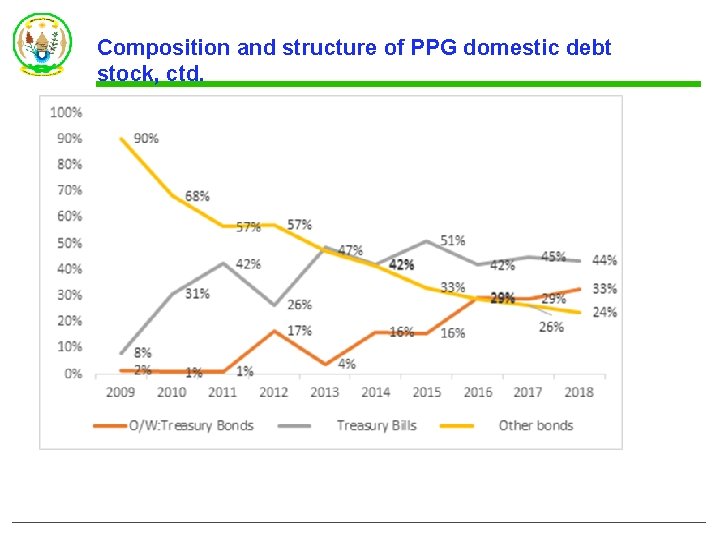
Composition and structure of PPG domestic debt stock, ctd.
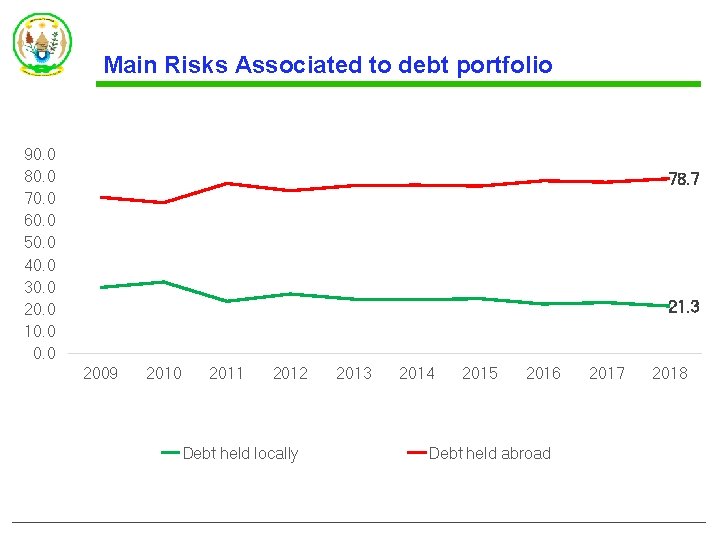
Main Risks Associated to debt portfolio 90. 0 80. 0 70. 0 60. 0 50. 0 40. 0 30. 0 20. 0 10. 0 78. 7 21. 3 2009 2010 2011 2012 Debt held locally 2013 2014 2015 2016 Debt held abroad 2017 2018
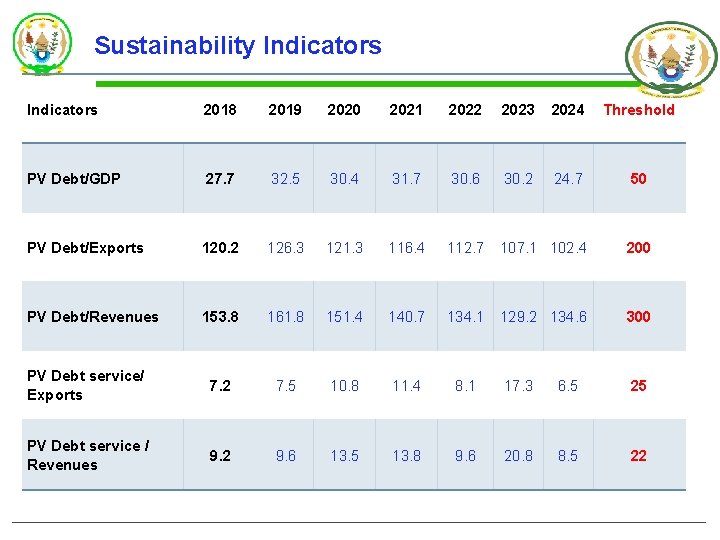
Sustainability Indicators 2018 2019 2020 2021 2022 2023 2024 Threshold PV Debt/GDP 27. 7 32. 5 30. 4 31. 7 30. 6 30. 2 24. 7 50 PV Debt/Exports 120. 2 126. 3 121. 3 116. 4 112. 7 107. 1 102. 4 200 PV Debt/Revenues 153. 8 161. 8 151. 4 140. 7 134. 1 129. 2 134. 6 300 PV Debt service/ Exports 7. 2 7. 5 10. 8 11. 4 8. 1 17. 3 6. 5 25 PV Debt service / Revenues 9. 2 9. 6 13. 5 13. 8 9. 6 20. 8 8. 5 22
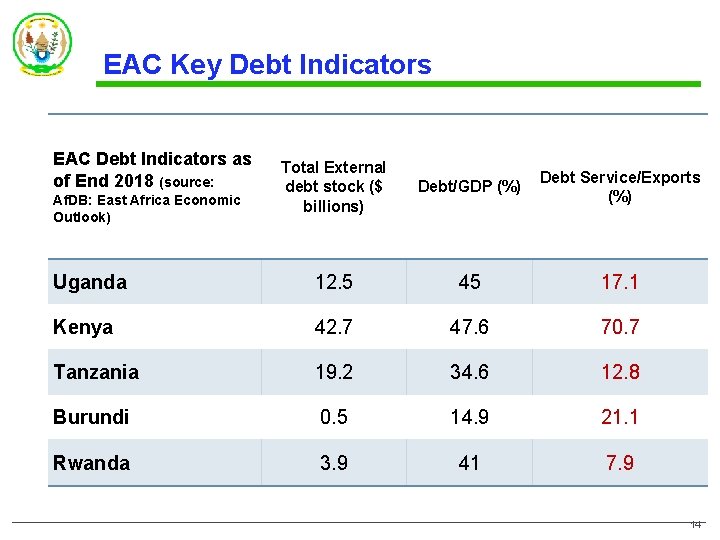
EAC Key Debt Indicators EAC Debt Indicators as of End 2018 (source: Total External debt stock ($ billions) Debt/GDP (%) Debt Service/Exports (%) Uganda 12. 5 45 17. 1 Kenya 42. 7 47. 6 70. 7 Tanzania 19. 2 34. 6 12. 8 Burundi 0. 5 14. 9 21. 1 Rwanda 3. 9 41 7. 9 Af. DB: East Africa Economic Outlook) 14
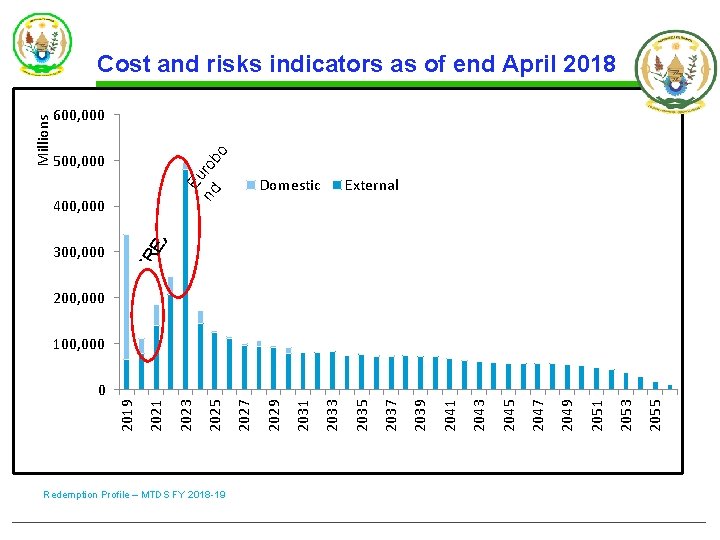
600, 000 Eu nd rob o Millions Cost and risks indicators as of end April 2018 500, 000 RE AF 300, 000 External XI 400, 000 Domestic 200, 000 100, 000 Redemption Profile – MTDS FY 2018 -19 2055 2053 2051 2049 2047 2045 2043 2041 2039 2037 2035 2033 2031 2029 2027 2025 2023 2021 2019 0
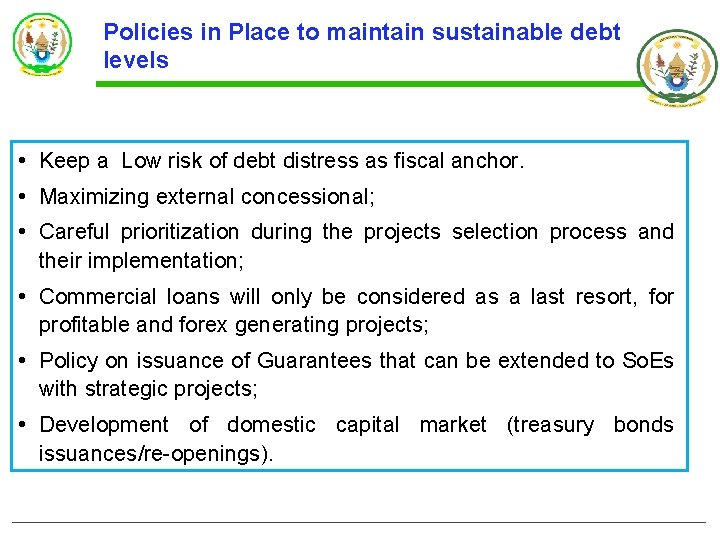
Policies in Place to maintain sustainable debt levels • Keep a Low risk of debt distress as fiscal anchor. • Maximizing external concessional; • Careful prioritization during the projects selection process and their implementation; • Commercial loans will only be considered as a last resort, for profitable and forex generating projects; • Policy on issuance of Guarantees that can be extended to So. Es with strategic projects; • Development of domestic capital market (treasury bonds issuances/re-openings).
THANK YOU
- Slides: 18