Runtime Storage Organization Jeremy Singer updated version after

![ldr r 2, [fp, #-8] ldr r 3, [fp, #-12] add r 3, ldr r 2, [fp, #-8] ldr r 3, [fp, #-12] add r 3,](https://slidetodoc.com/presentation_image_h/3285fb3a71ce7ed3223301c999a48d5d/image-21.jpg)



- Slides: 37

Runtime Storage Organization Jeremy Singer (updated version after lecture on ) University of Glasgow

The specific details of this presentation are based on C programs running on a Unix platform (ideally Linux!) but general principles should apply to all programming languages and operating systems.

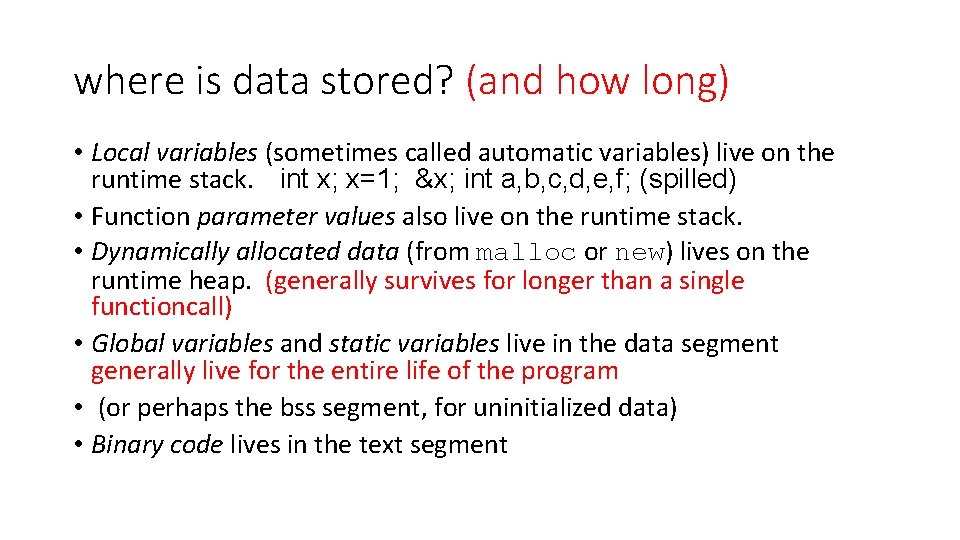
where is data stored? (and how long) • Local variables (sometimes called automatic variables) live on the runtime stack. int x; x=1; &x; int a, b, c, d, e, f; (spilled) • Function parameter values also live on the runtime stack. • Dynamically allocated data (from malloc or new) lives on the runtime heap. (generally survives for longer than a single functioncall) • Global variables and static variables live in the data segment generally live for the entire life of the program • (or perhaps the bss segment, for uninitialized data) • Binary code lives in the text segment

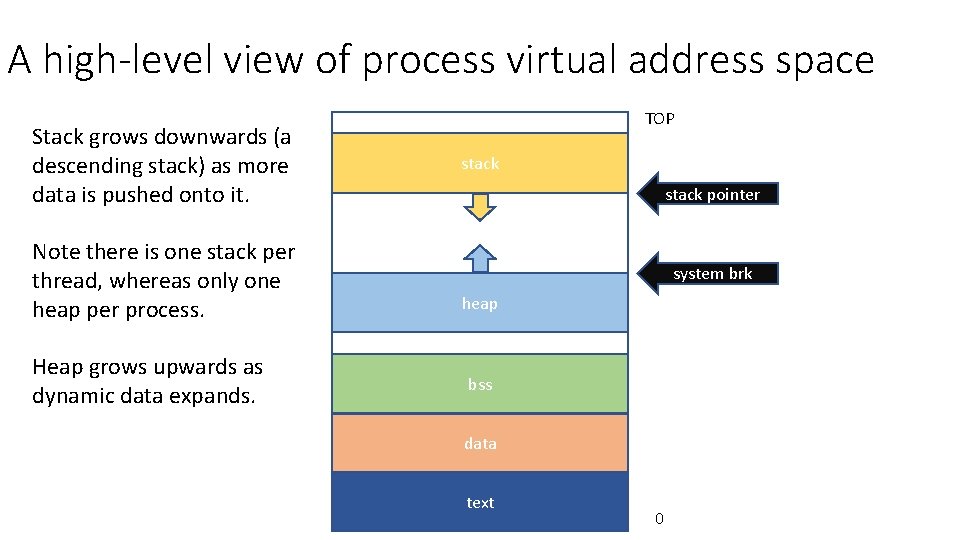
A high-level view of process virtual address space Stack grows downwards (a descending stack) as more data is pushed onto it. Note there is one stack per thread, whereas only one heap per process. Heap grows upwards as dynamic data expands. TOP stack pointer system brk heap bss data text 0

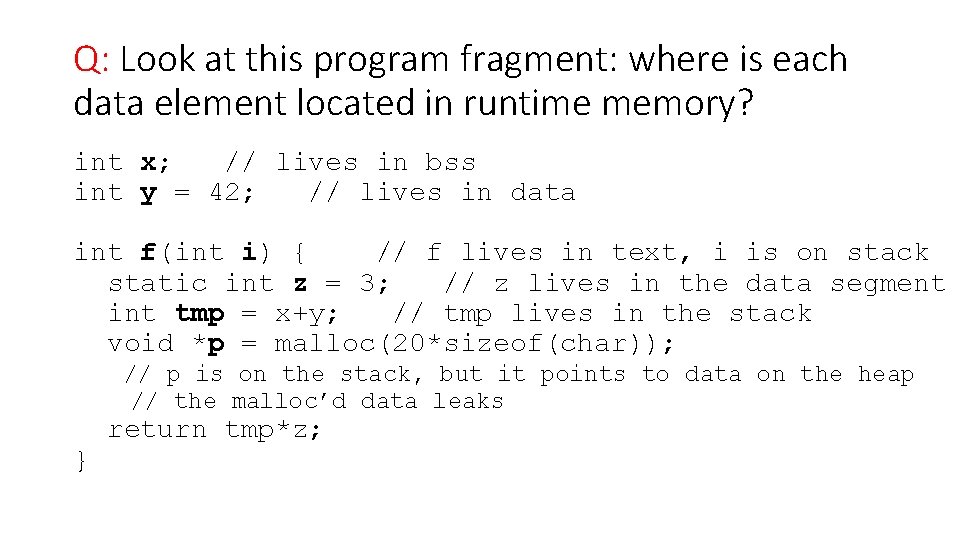
Q: Look at this program fragment: where is each data element located in runtime memory? int x; // lives in bss int y = 42; // lives in data int f(int i) { // f lives in text, i is on stack static int z = 3; // z lives in the data segment int tmp = x+y; // tmp lives in the stack void *p = malloc(20*sizeof(char)); // p is on the stack, but it points to data on the heap // the malloc’d data leaks return tmp*z; }

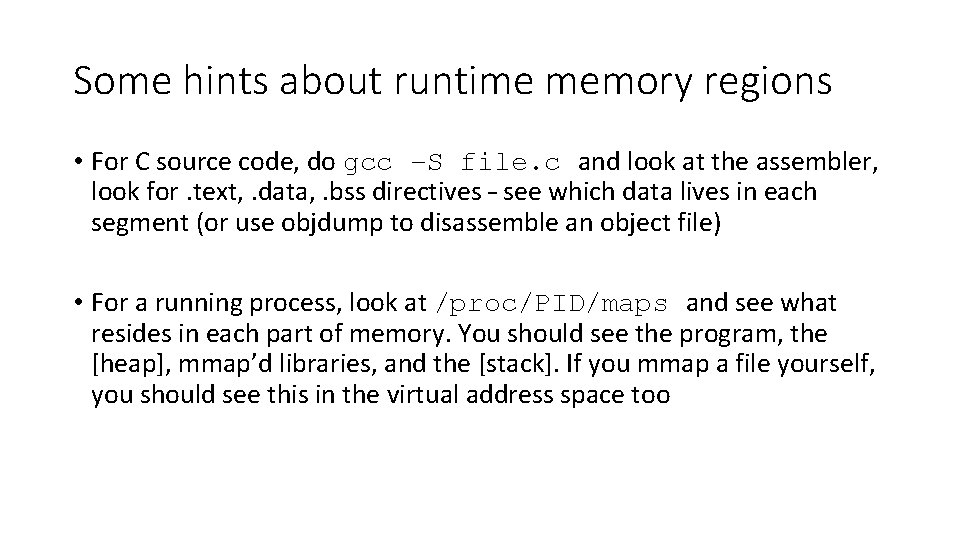
Some hints about runtime memory regions • For C source code, do gcc –S file. c and look at the assembler, look for. text, . data, . bss directives – see which data lives in each segment (or use objdump to disassemble an object file) • For a running process, look at /proc/PID/maps and see what resides in each part of memory. You should see the program, the [heap], mmap’d libraries, and the [stack]. If you mmap a file yourself, you should see this in the virtual address space too

For the rest of this lecture … • we will focus on the stack and the heap – these are the most dynamic memory areas at runtime

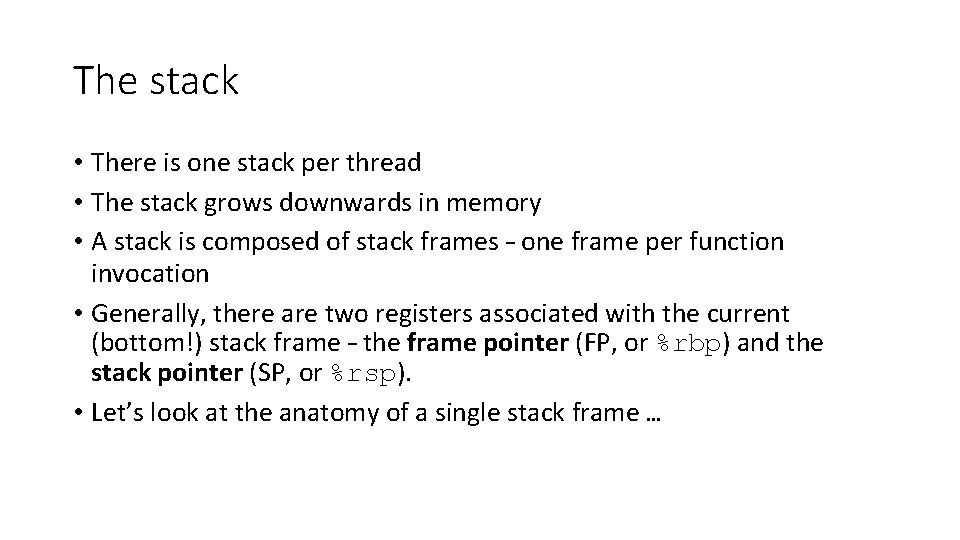
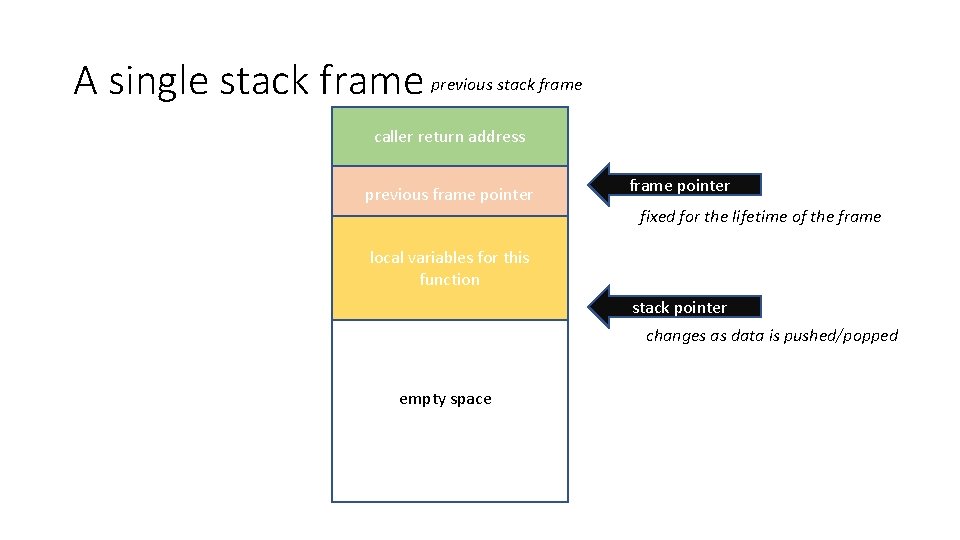
The stack • There is one stack per thread • The stack grows downwards in memory • A stack is composed of stack frames – one frame per function invocation • Generally, there are two registers associated with the current (bottom!) stack frame – the frame pointer (FP, or %rbp) and the stack pointer (SP, or %rsp). • Let’s look at the anatomy of a single stack frame …

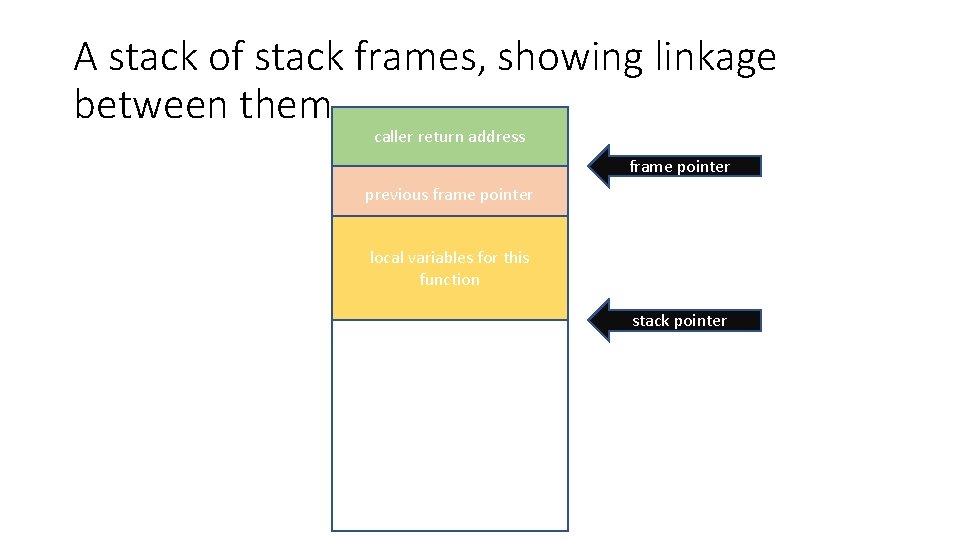
A single stack frame previous stack frame caller return address previous frame pointer fixed for the lifetime of the frame local variables for this function stack pointer changes as data is pushed/popped empty space

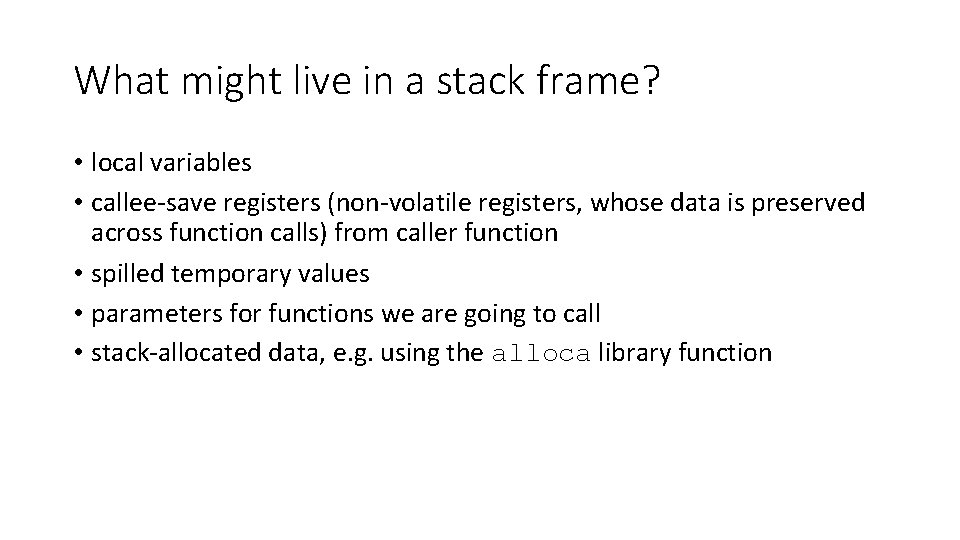
What might live in a stack frame? • local variables • callee-save registers (non-volatile registers, whose data is preserved across function calls) from caller function • spilled temporary values • parameters for functions we are going to call • stack-allocated data, e. g. using the alloca library function

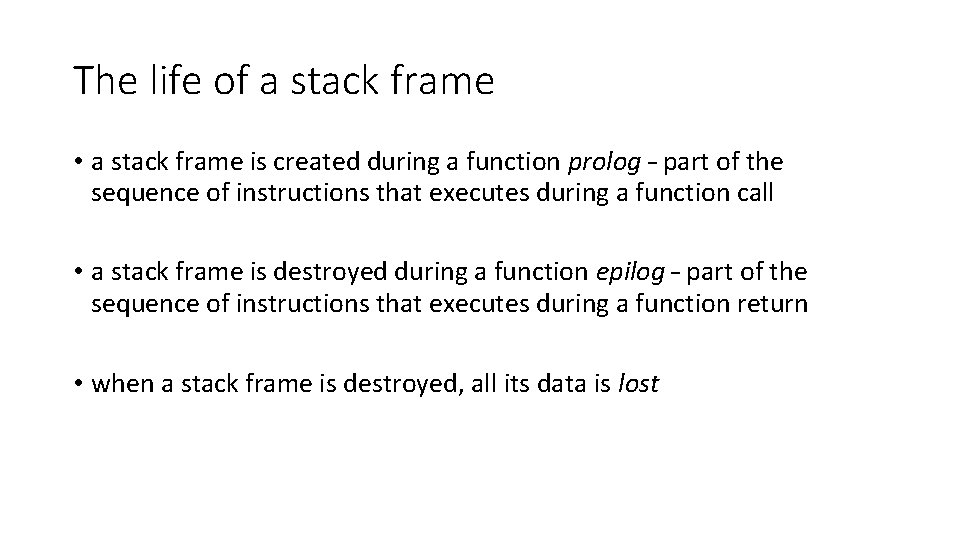
The life of a stack frame • a stack frame is created during a function prolog – part of the sequence of instructions that executes during a function call • a stack frame is destroyed during a function epilog – part of the sequence of instructions that executes during a function return • when a stack frame is destroyed, all its data is lost

A stack of stack frames, showing linkage between them caller return address frame pointer previous frame pointer local variables for this function stack pointer

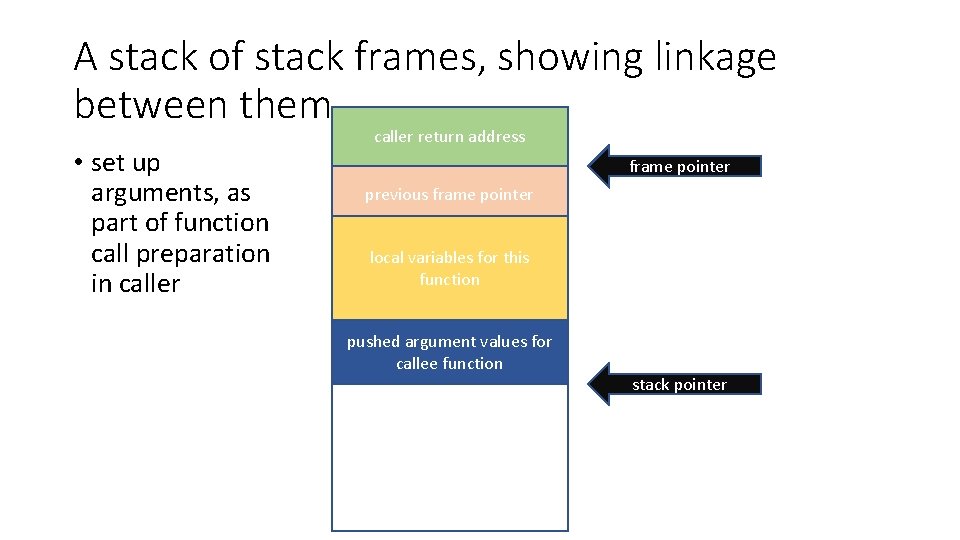
A stack of stack frames, showing linkage between them • set up arguments, as part of function call preparation in caller return address frame pointer previous frame pointer local variables for this function pushed argument values for callee function stack pointer

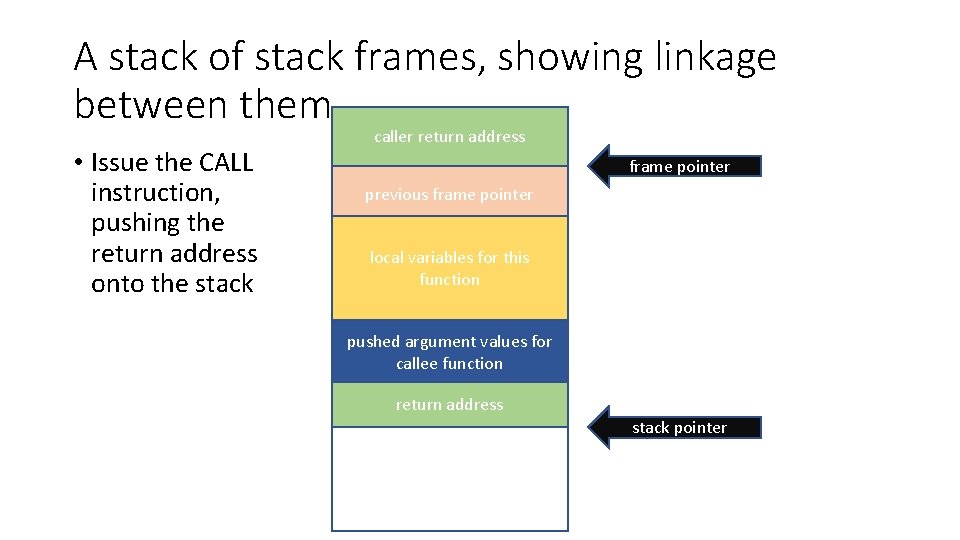
A stack of stack frames, showing linkage between them • Issue the CALL instruction, pushing the return address onto the stack caller return address frame pointer previous frame pointer local variables for this function pushed argument values for callee function return address stack pointer

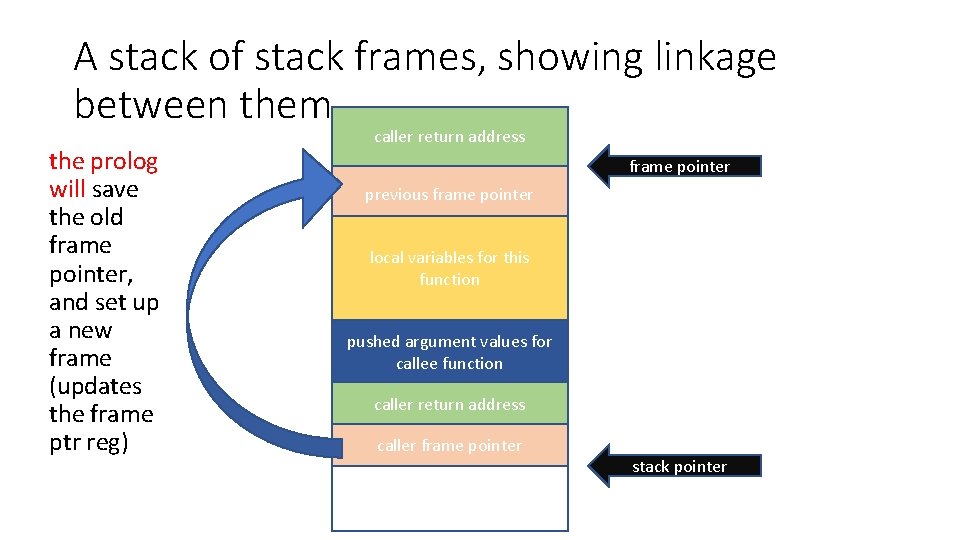
A stack of stack frames, showing linkage between them the prolog will save the old frame pointer, and set up a new frame (updates the frame ptr reg) caller return address frame pointer previous frame pointer local variables for this function pushed argument values for callee function caller return address caller frame pointer stack pointer

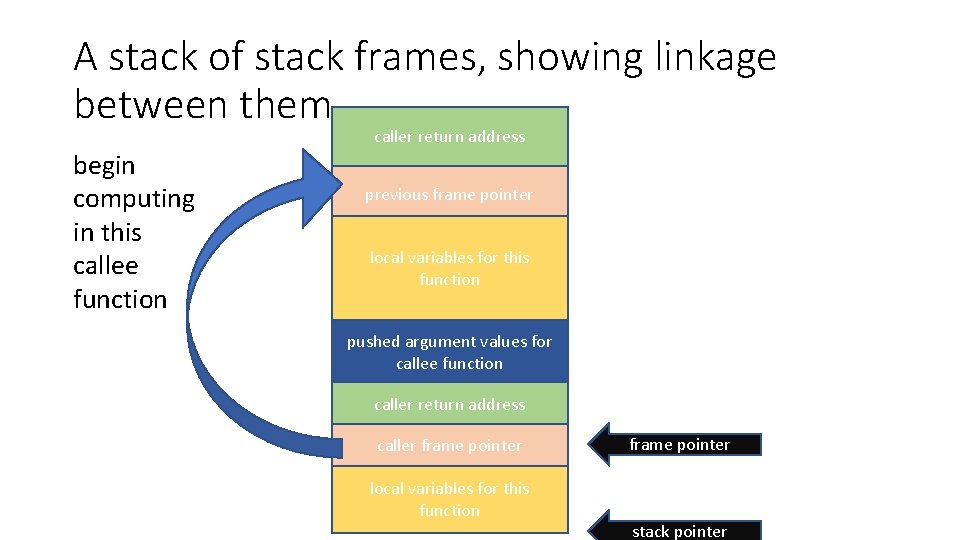
A stack of stack frames, showing linkage between them begin computing in this callee function caller return address previous frame pointer local variables for this function pushed argument values for callee function caller return address caller frame pointer local variables for this function frame pointer stack pointer

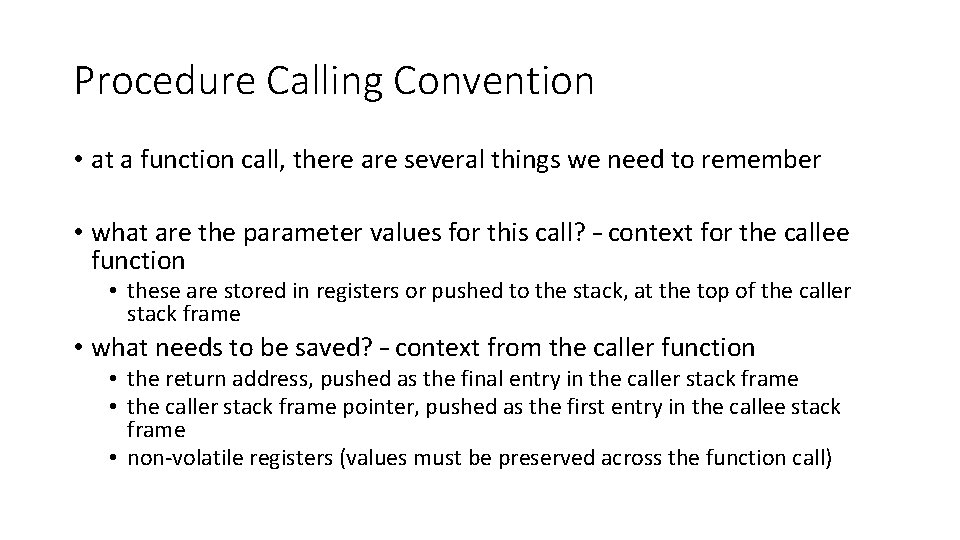
Procedure Calling Convention • at a function call, there are several things we need to remember • what are the parameter values for this call? – context for the callee function • these are stored in registers or pushed to the stack, at the top of the caller stack frame • what needs to be saved? – context from the caller function • the return address, pushed as the final entry in the caller stack frame • the caller stack frame pointer, pushed as the first entry in the callee stack frame • non-volatile registers (values must be preserved across the function call)

Case study: example ARM 32 -bit Procedure Call Standard on Linux • See https: //en. wikipedia. org/wiki/Calling_convention#ARM_. 28 A 32. 29 for details

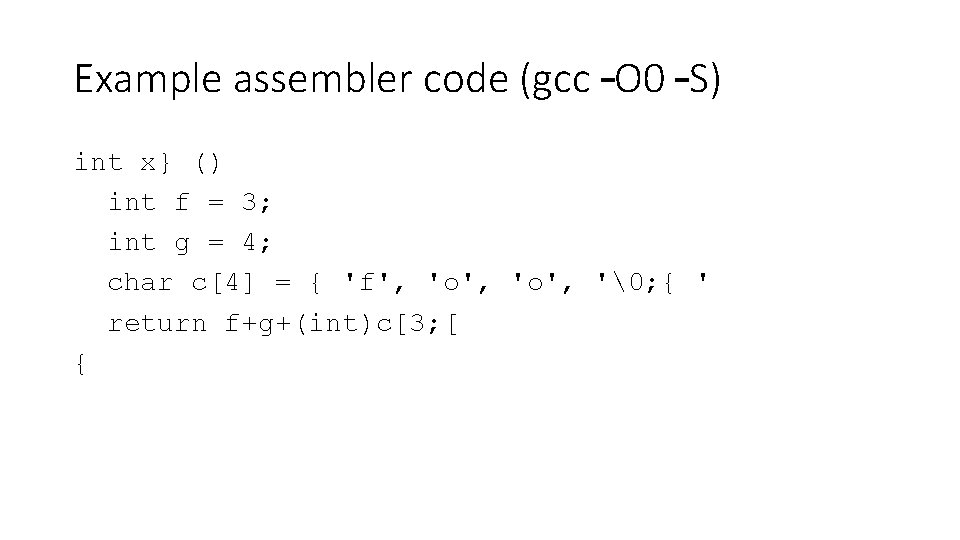
Example assembler code (gcc –O 0 –S) int x} () int f = 3; int g = 4; char c[4] = { 'f', 'o', '�; { ' return f+g+(int)c[3; [ {

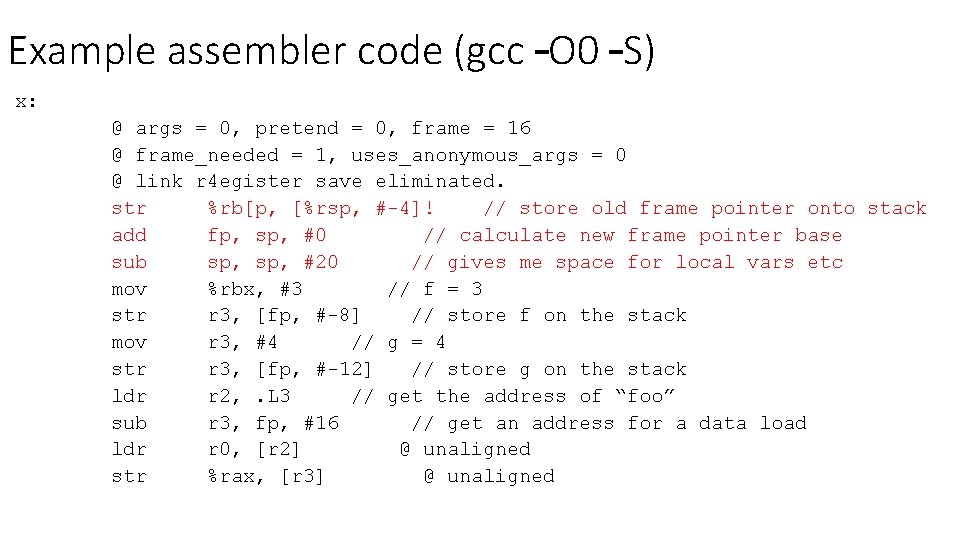
Example assembler code (gcc –O 0 –S) x: @ args = 0, pretend = 0, frame = 16 @ frame_needed = 1, uses_anonymous_args = 0 @ link r 4 egister save eliminated. str %rb[p, [%rsp, #-4]! // store old frame pointer onto stack add fp, sp, #0 // calculate new frame pointer base sub sp, #20 // gives me space for local vars etc mov %rbx, #3 // f = 3 str r 3, [fp, #-8] // store f on the stack mov r 3, #4 // g = 4 str r 3, [fp, #-12] // store g on the stack ldr r 2, . L 3 // get the address of “foo” sub r 3, fp, #16 // get an address for a data load ldr r 0, [r 2] @ unaligned str %rax, [r 3] @ unaligned
![ldr r 2 fp 8 ldr r 3 fp 12 add r 3 ldr r 2, [fp, #-8] ldr r 3, [fp, #-12] add r 3,](https://slidetodoc.com/presentation_image_h/3285fb3a71ce7ed3223301c999a48d5d/image-21.jpg)
ldr r 2, [fp, #-8] ldr r 3, [fp, #-12] add r 3, r 2, r 3 ldrb r 2, [fp, #-13] @ zero_extendqisi 2 add r 3, r 2 mov r 0, r 3 // the return value (additi sub sp, fp, #0 // sp : = fp @ sp needed ldr fp, [sp], #4 // fp : = old_fp bx lr // return to caller

Questions to think about • Tail calls enable stack frame reuse. What are the advantages of this approach? (optimization very common for functional programming) • see https: //en. wikipedia. org/wiki/Tail_call for ideas • Some languages (e. g. ) allocate stack frames on the heap. Why might this be good? Why bad? (stack frame data has to outlive the function call) • see https: //www. cs. princeton. edu/~appel/papers/stack 2. pdf for some ideas


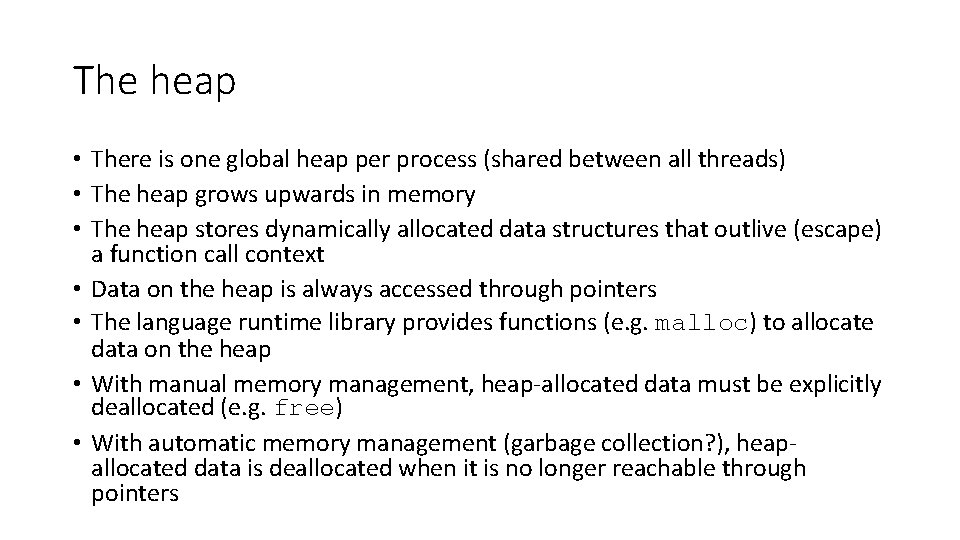
The heap • There is one global heap per process (shared between all threads) • The heap grows upwards in memory • The heap stores dynamically allocated data structures that outlive (escape) a function call context • Data on the heap is always accessed through pointers • The language runtime library provides functions (e. g. malloc) to allocate data on the heap • With manual memory management, heap-allocated data must be explicitly deallocated (e. g. free) • With automatic memory management (garbage collection? ), heapallocated data is deallocated when it is no longer reachable through pointers

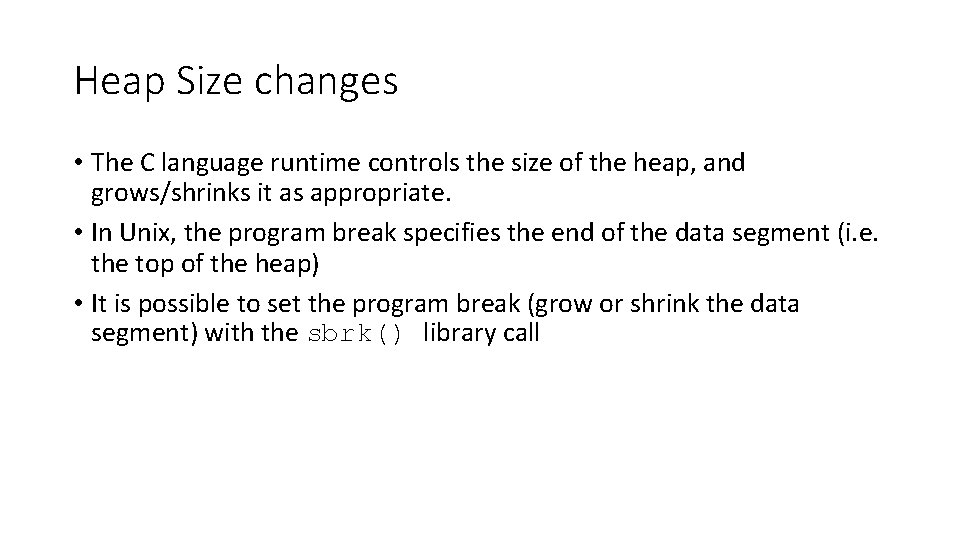
Heap Size changes • The C language runtime controls the size of the heap, and grows/shrinks it as appropriate. • In Unix, the program break specifies the end of the data segment (i. e. the top of the heap) • It is possible to set the program break (grow or shrink the data segment) with the sbrk() library call

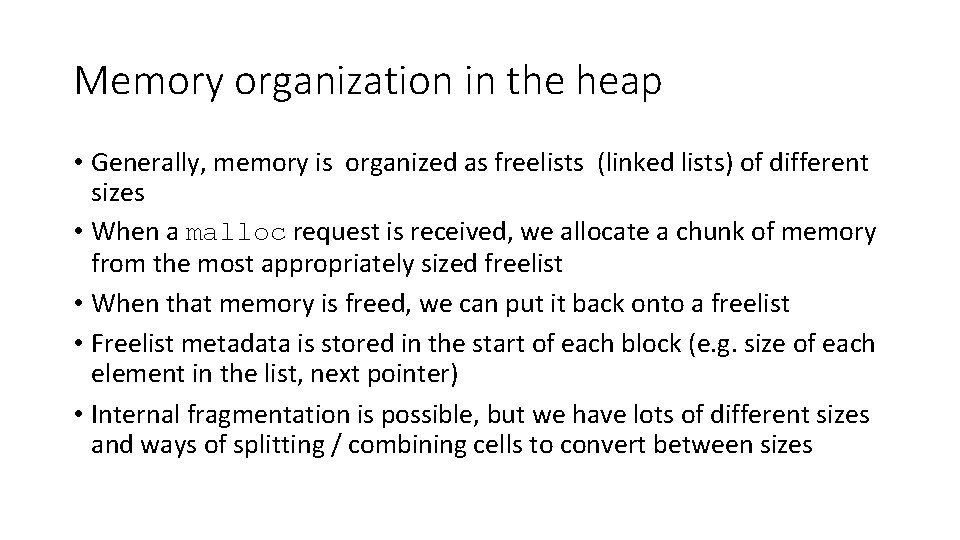
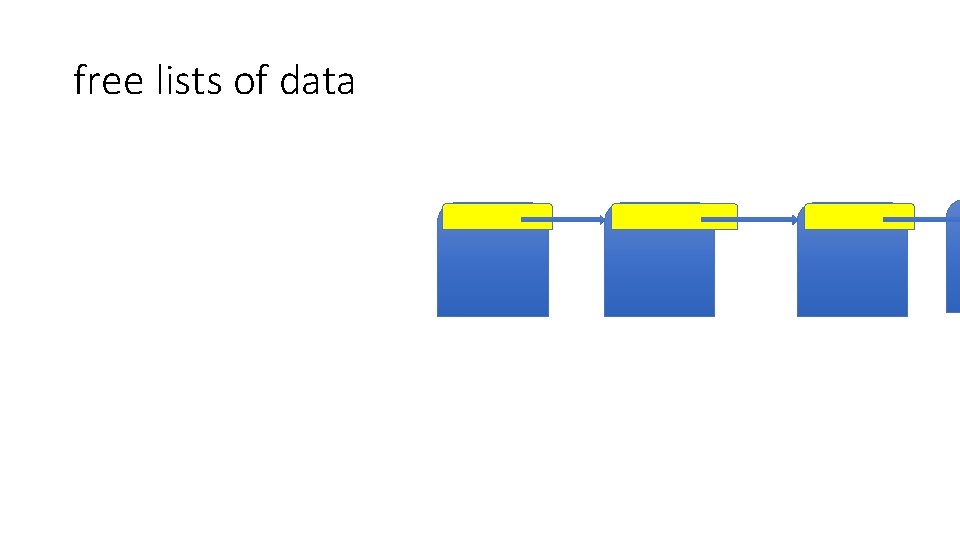
Memory organization in the heap • Generally, memory is organized as freelists (linked lists) of different sizes • When a malloc request is received, we allocate a chunk of memory from the most appropriately sized freelist • When that memory is freed, we can put it back onto a freelist • Freelist metadata is stored in the start of each block (e. g. size of each element in the list, next pointer) • Internal fragmentation is possible, but we have lots of different sizes and ways of splitting / combining cells to convert between sizes

free lists of data

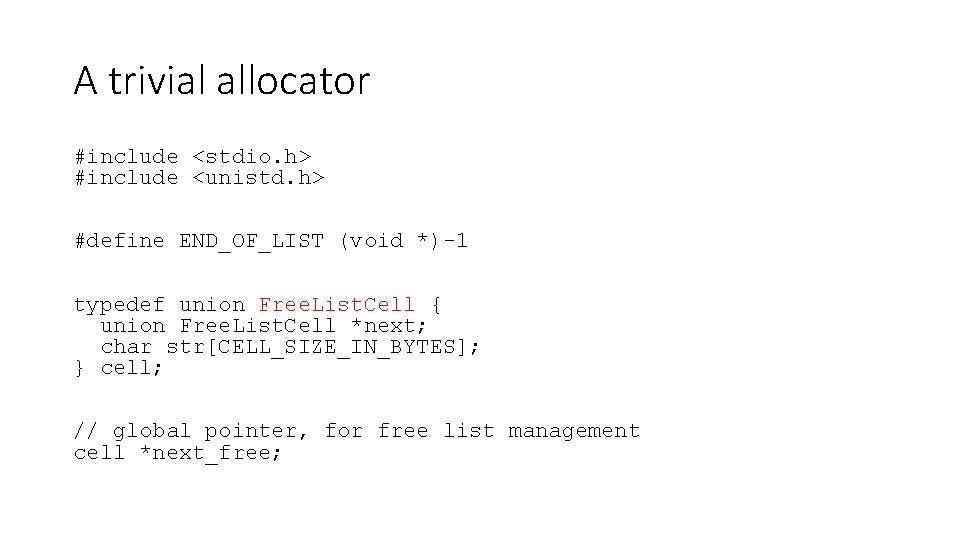
A trivial allocator #include <stdio. h> #include <unistd. h> #define END_OF_LIST (void *)-1 typedef union Free. List. Cell { union Free. List. Cell *next; char str[CELL_SIZE_IN_BYTES]; } cell; // global pointer, for free list management cell *next_free;

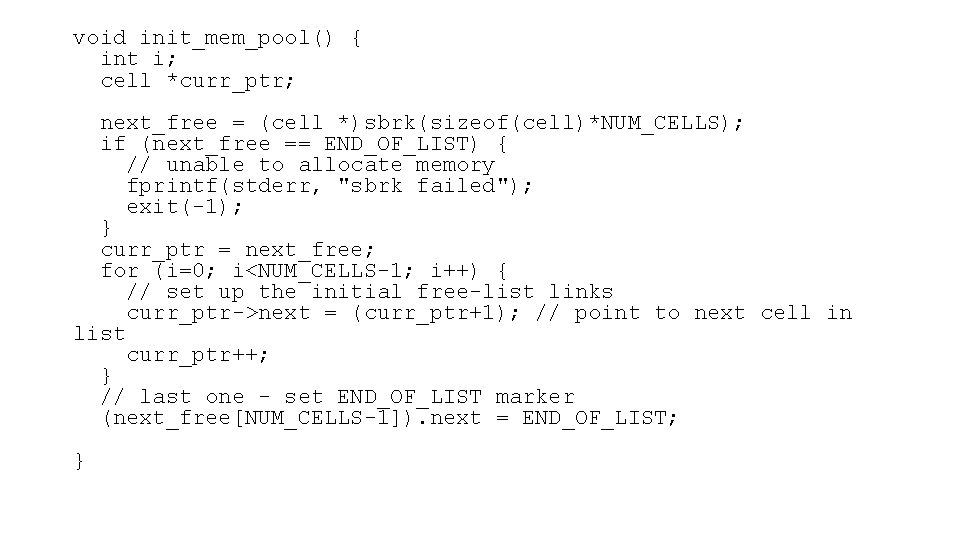
void init_mem_pool() { int i; cell *curr_ptr; next_free = (cell *)sbrk(sizeof(cell)*NUM_CELLS); if (next_free == END_OF_LIST) { // unable to allocate memory fprintf(stderr, "sbrk failed"); exit(-1); } curr_ptr = next_free; for (i=0; i<NUM_CELLS-1; i++) { // set up the initial free-list links curr_ptr->next = (curr_ptr+1); // point to next cell in list curr_ptr++; } // last one - set END_OF_LIST marker (next_free[NUM_CELLS-1]). next = END_OF_LIST; }

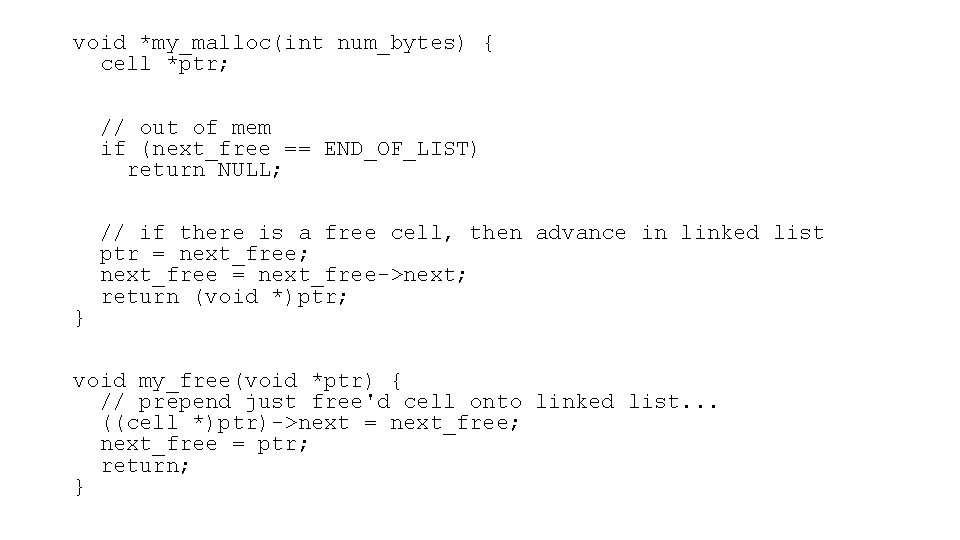
void *my_malloc(int num_bytes) { cell *ptr; // out of mem if (next_free == END_OF_LIST) return NULL; // if there is a free cell, then advance in linked list ptr = next_free; next_free = next_free->next; return (void *)ptr; } void my_free(void *ptr) { // prepend just free'd cell onto linked list. . . ((cell *)ptr)->next = next_free; next_free = ptr; return; }

Questions • This special-purpose single-cell-size memory allocator can outperform a highly optimized general-purpose malloc routine – why? • How might you modify the code to handle multiple freelists of different sizes? • For more reading, check out Doug Lea’s malloc http: //g. oswego. edu/dl/html/malloc. html

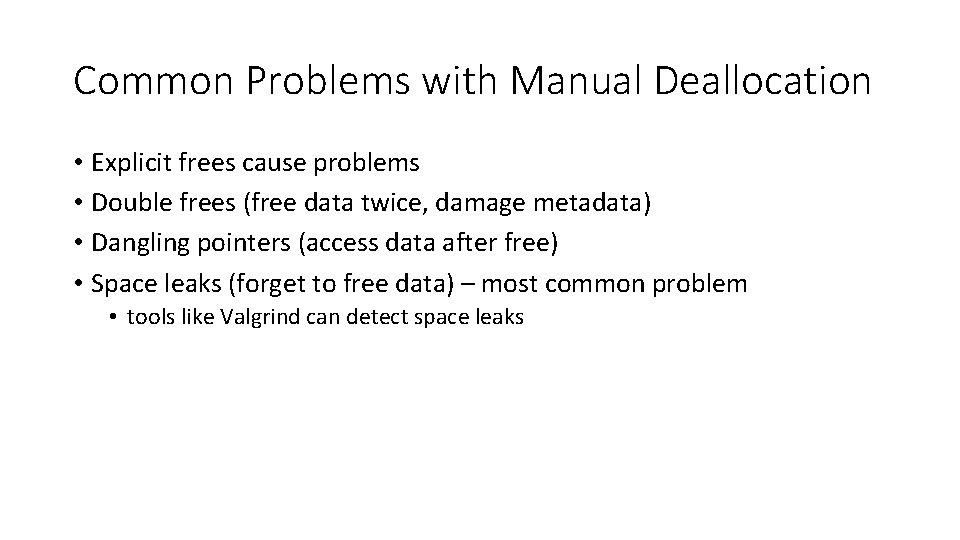
Common Problems with Manual Deallocation • Explicit frees cause problems • Double frees (free data twice, damage metadata) • Dangling pointers (access data after free) • Space leaks (forget to free data) – most common problem • tools like Valgrind can detect space leaks

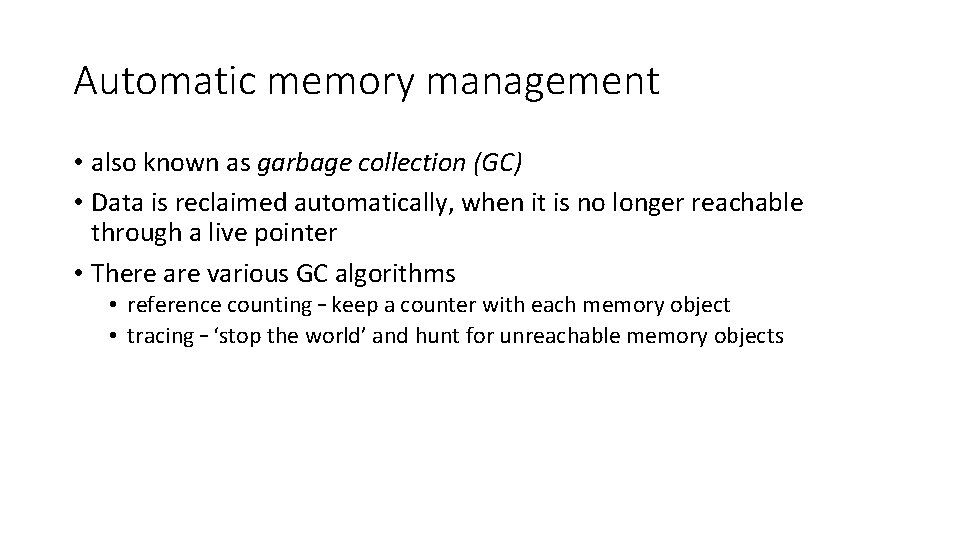
Automatic memory management • also known as garbage collection (GC) • Data is reclaimed automatically, when it is no longer reachable through a live pointer • There are various GC algorithms • reference counting – keep a counter with each memory object • tracing – ‘stop the world’ and hunt for unreachable memory objects

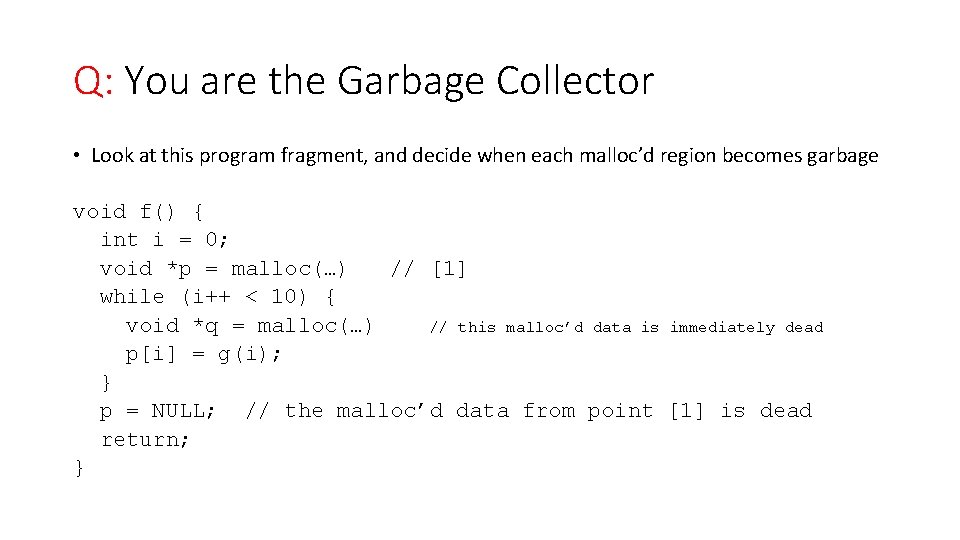
Q: You are the Garbage Collector • Look at this program fragment, and decide when each malloc’d region becomes garbage void f() { int i = 0; void *p = malloc(…) // [1] while (i++ < 10) { void *q = malloc(…) // this malloc’d data is immediately dead p[i] = g(i); } p = NULL; // the malloc’d data from point [1] is dead return; }

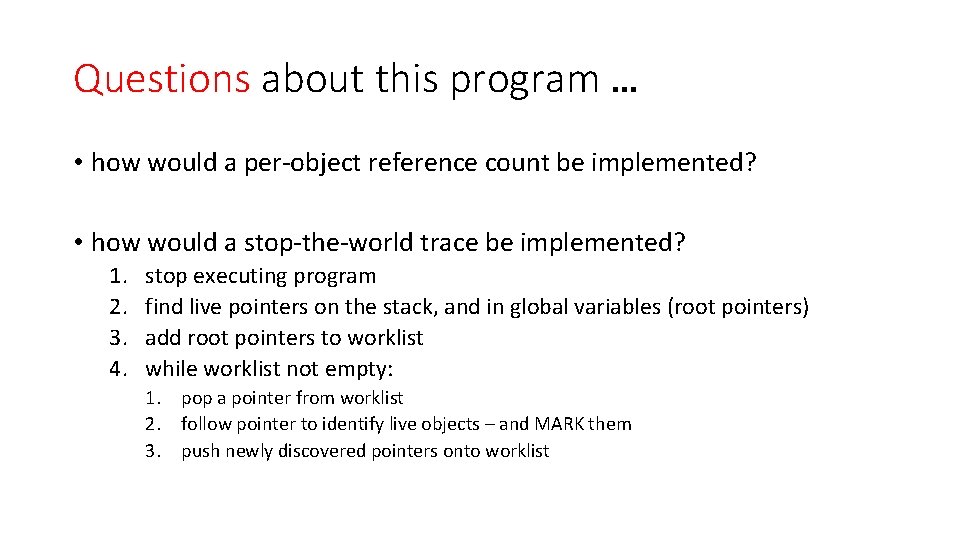
Questions about this program … • how would a per-object reference count be implemented? • how would a stop-the-world trace be implemented? 1. 2. 3. 4. stop executing program find live pointers on the stack, and in global variables (root pointers) add root pointers to worklist while worklist not empty: 1. pop a pointer from worklist 2. follow pointer to identify live objects – and MARK them 3. push newly discovered pointers onto worklist

Conclusion • Stack and Heap are dynamic memory regions • Both require careful management by the compiler and the language runtime • Stack memory is divided into frames • A frame is associated with a function call, and lives for as long as the function call • Heap memory is organized by a memory allocator • Heap memory lives until it is deallocated, either explicitly or implicitly • There is a range of algorithms for heap organization

What happens when we access an array with an out-of-range index? In some programming languages, this is trapped by the runtime checks (C# or Java – managed languages) Bounds checks are automatically included by the compiler (sometimes C++ programs can be compiled with bounds checks too) In other languages, notably C, the compiler does not do bounds checking so the lookup is executed – i. e. we try to access the memory address (base + offset) - this may succeed, if you have permissions to access this memory - it may fail, if the memory address is not accessible (seg fault)