
RSquared Explained The Coefficient Of Determination What is


- Slides: 16
R-Squared Explained The Coefficient Of Determination
What is r 2? • The coefficient of determination (r-sq, r 2) • Mathematically it is the r-value squared (r 2 = r * r)
The LSRL (least-squares regression line or y-hat) is just one way to model data. Remember…since our goal is to predict the y-values with the least amount of error, the LSRL minimizes the vertical (y) distance from each point to the line.
What if we didn’t have the LSRL?
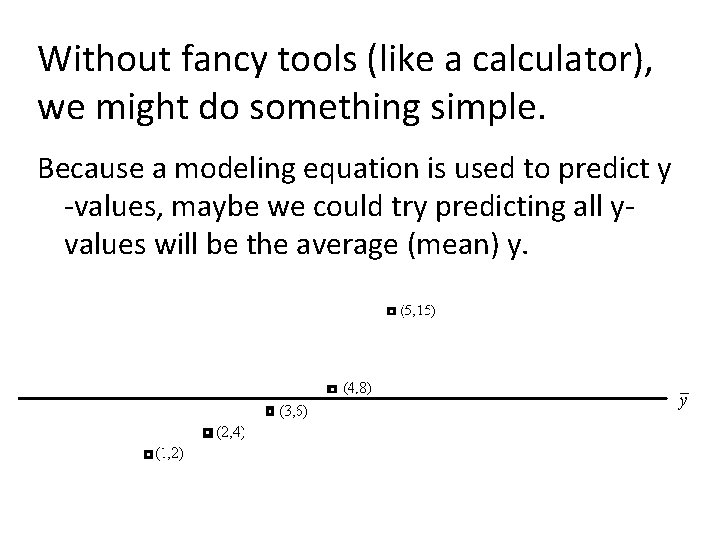
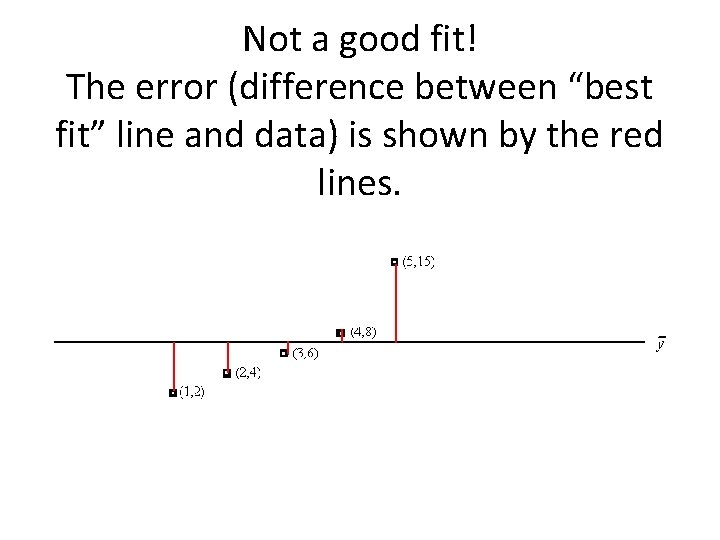
Without fancy tools (like a calculator), we might do something simple. Because a modeling equation is used to predict y -values, maybe we could try predicting all yvalues will be the average (mean) y.
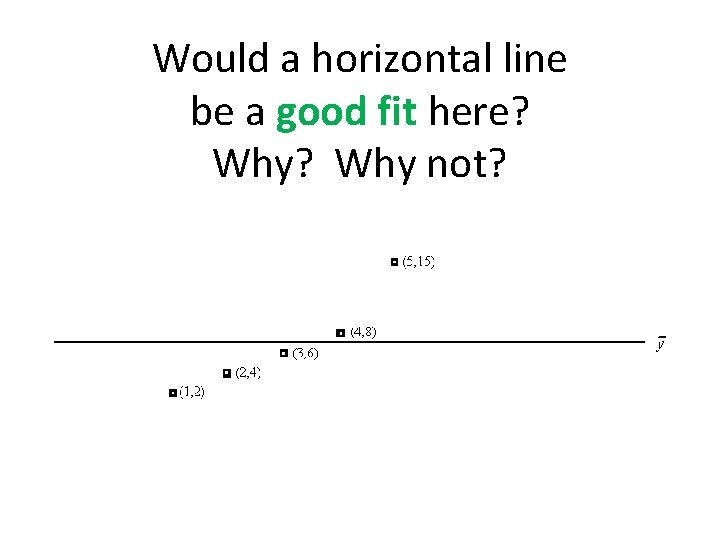
Would a horizontal line be a good fit here? Why not?
Not a good fit! The error (difference between “best fit” line and data) is shown by the red lines.
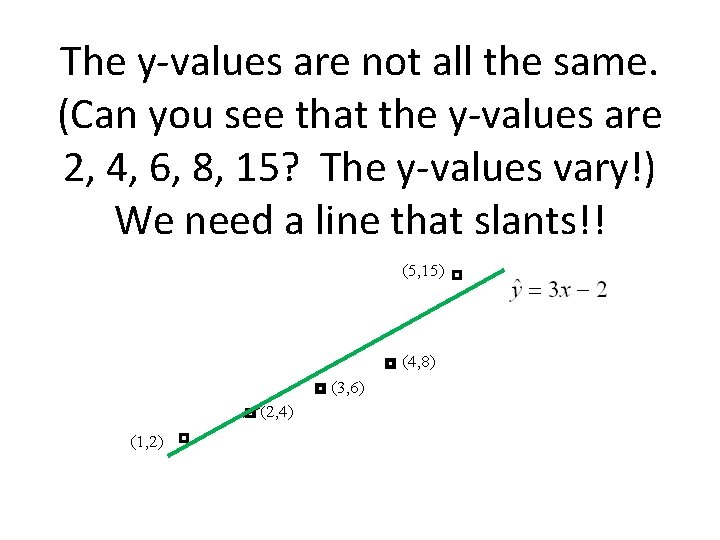
The y-values are not all the same. (Can you see that the y-values are 2, 4, 6, 8, 15? The y-values vary!) We need a line that slants!!
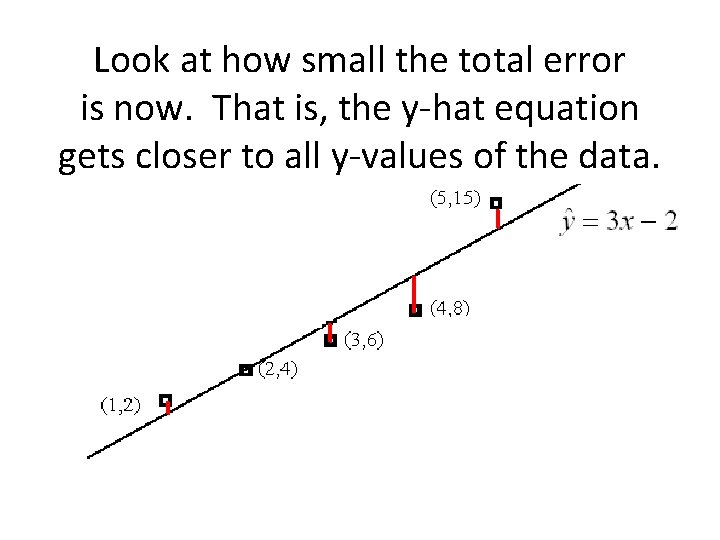
Look at how small the total error is now. That is, the y-hat equation gets closer to all y-values of the data.
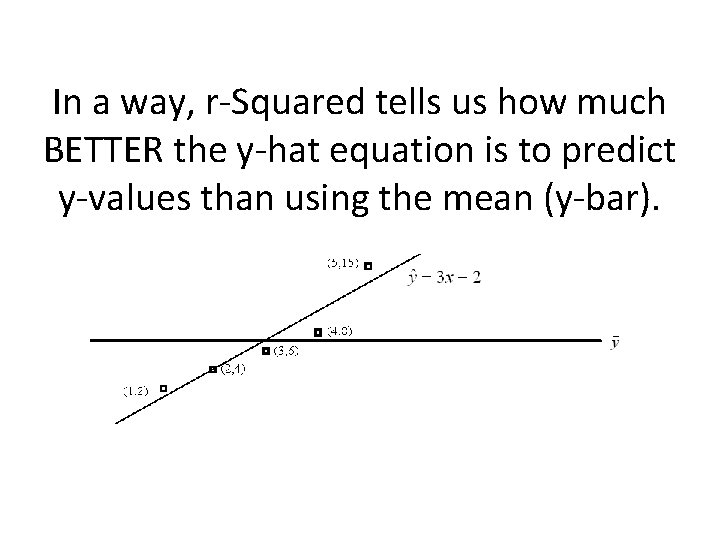
In a way, r-Squared tells us how much BETTER the y-hat equation is to predict y-values than using the mean (y-bar).
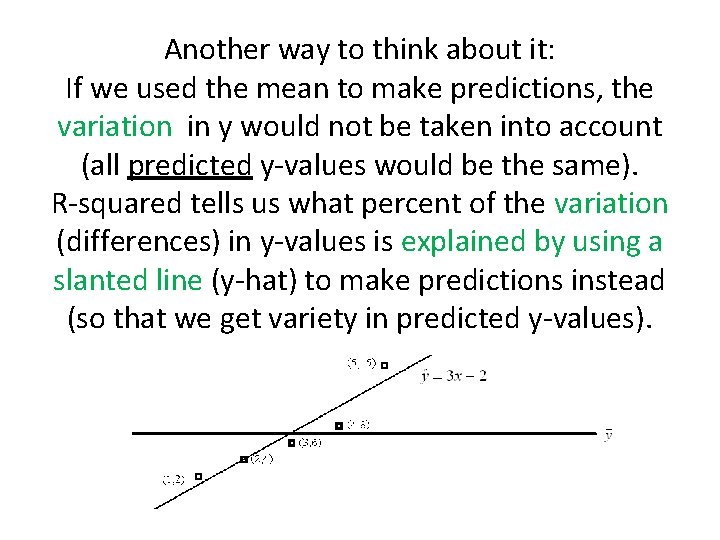
Another way to think about it: If we used the mean to make predictions, the variation in y would not be taken into account (all predicted y-values would be the same). R-squared tells us what percent of the variation (differences) in y-values is explained by using a slanted line (y-hat) to make predictions instead (so that we get variety in predicted y-values).
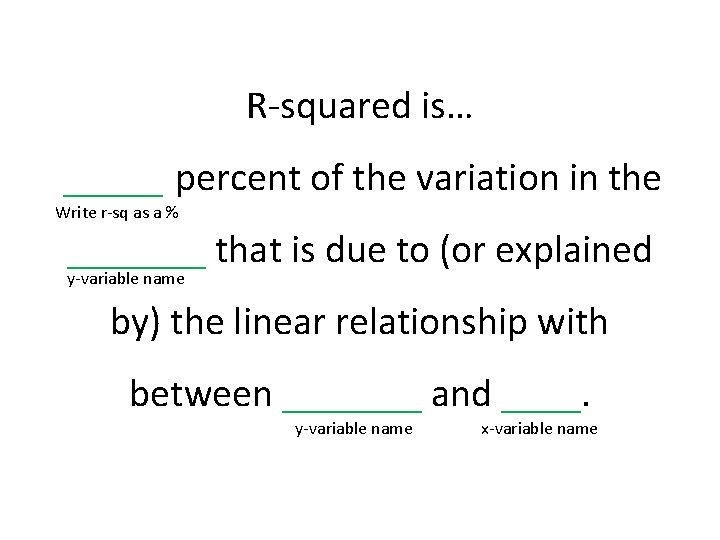
R-squared is… _____ percent of the variation in the Write r-sq as a % _______ that is due to (or explained y-variable name by) the linear relationship with between _______ and ____. y-variable name x-variable name
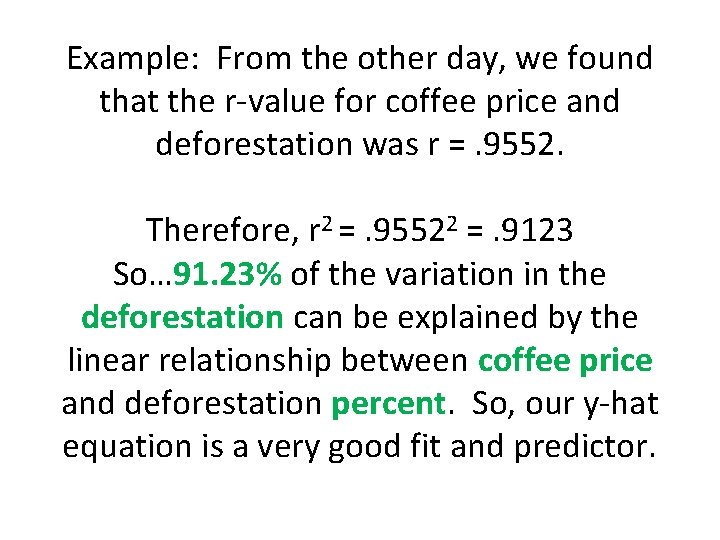
Example: From the other day, we found that the r-value for coffee price and deforestation was r =. 9552. Therefore, r 2 =. 95522 =. 9123 So… 91. 23% of the variation in the deforestation can be explained by the linear relationship between coffee price and deforestation percent. So, our y-hat equation is a very good fit and predictor.
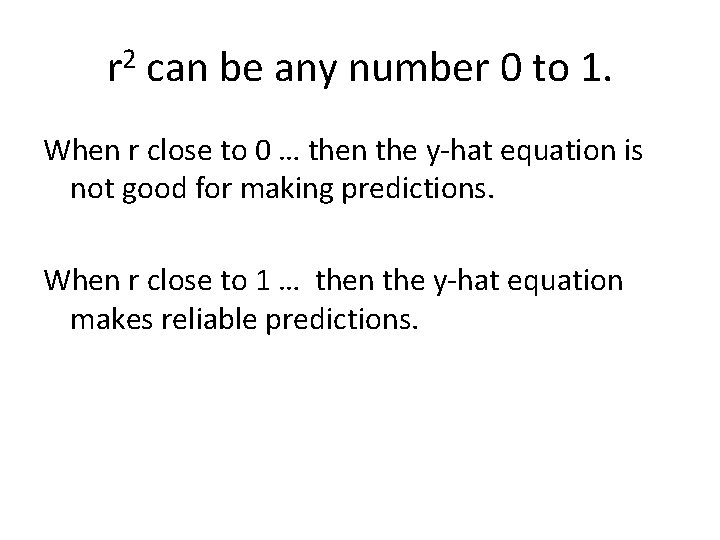
r 2 can be any number 0 to 1. When r close to 0 … then the y-hat equation is not good for making predictions. When r close to 1 … then the y-hat equation makes reliable predictions.
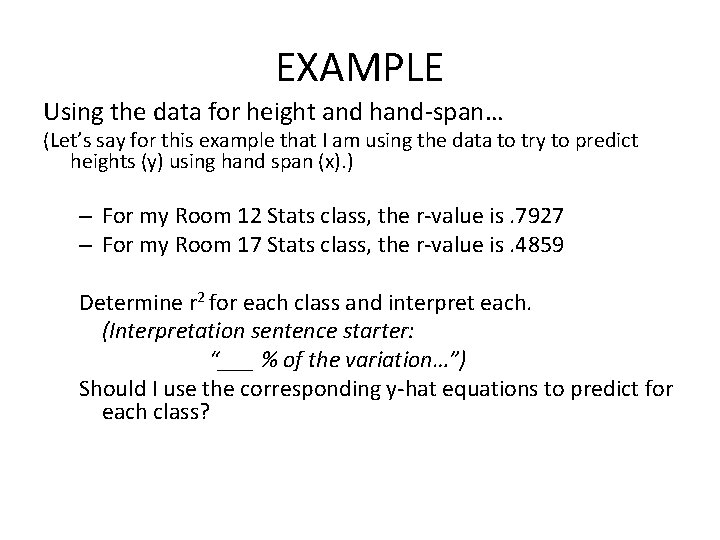
EXAMPLE Using the data for height and hand-span… (Let’s say for this example that I am using the data to try to predict heights (y) using hand span (x). ) – For my Room 12 Stats class, the r-value is. 7927 – For my Room 17 Stats class, the r-value is. 4859 Determine r 2 for each class and interpret each. (Interpretation sentence starter: “___ % of the variation…”) Should I use the corresponding y-hat equations to predict for each class?
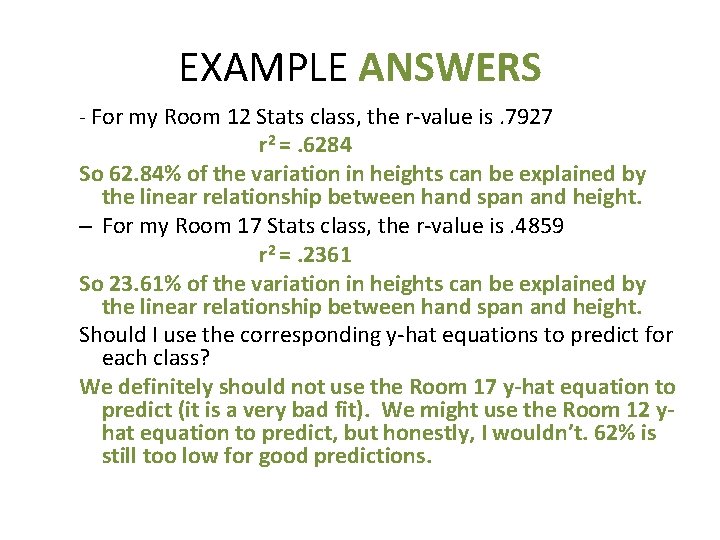
EXAMPLE ANSWERS - For my Room 12 Stats class, the r-value is. 7927 r 2 =. 6284 So 62. 84% of the variation in heights can be explained by the linear relationship between hand span and height. – For my Room 17 Stats class, the r-value is. 4859 r 2 =. 2361 So 23. 61% of the variation in heights can be explained by the linear relationship between hand span and height. Should I use the corresponding y-hat equations to predict for each class? We definitely should not use the Room 17 y-hat equation to predict (it is a very bad fit). We might use the Room 12 yhat equation to predict, but honestly, I wouldn’t. 62% is still too low for good predictions.