
Roving With Rosalind Introduction to Spectra Rw R
- Slides: 12
Roving With Rosalind Introduction to Spectra
Rw. R Programming There are lots of different languages you can learn to program with, we’re going to introduce you to Python is a free to use, open source software which makes it one of the best to get started with. Pseudo code. Intro to all the bits and pieces We are going to work with Pan. Cam like data to introduce programming in Python
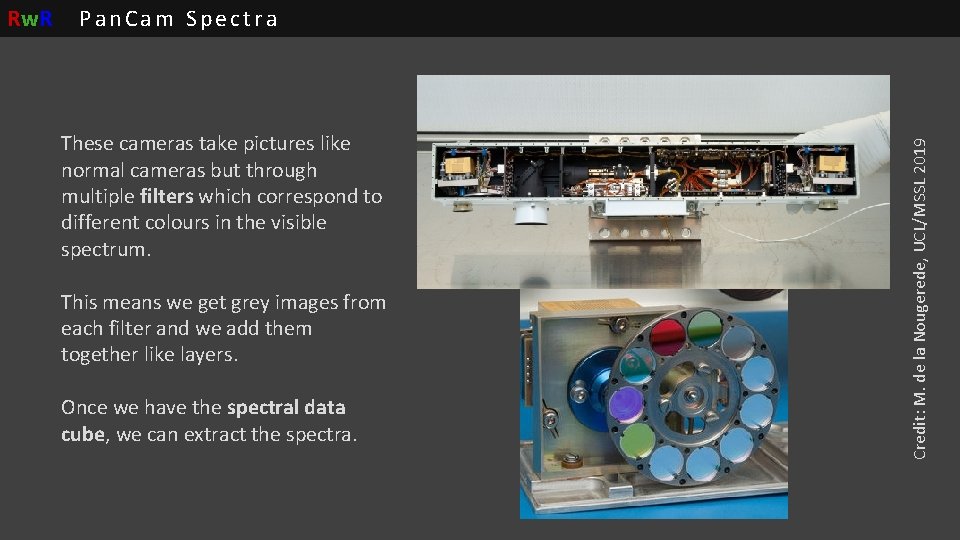
Pan. Cam Spectra These cameras take pictures like normal cameras but through multiple filters which correspond to different colours in the visible spectrum. This means we get grey images from each filter and we add them together like layers. Once we have the spectral data cube, we can extract the spectra. Credit: M. de la Nougerede, UCL/MSSL 2019 Rw. R
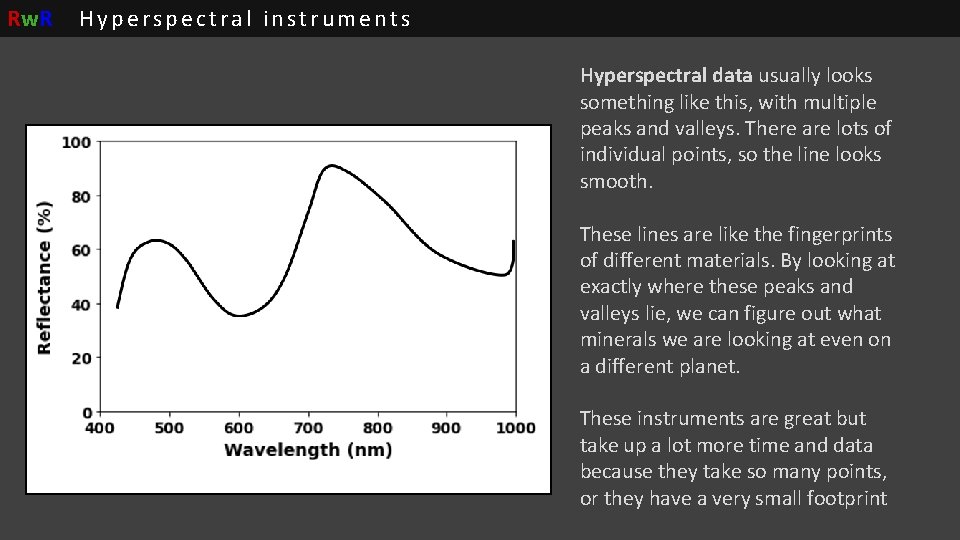
Rw. R Hyperspectral instruments Hyperspectral data usually looks something like this, with multiple peaks and valleys. There are lots of individual points, so the line looks smooth. These lines are like the fingerprints of different materials. By looking at exactly where these peaks and valleys lie, we can figure out what minerals we are looking at even on a different planet. These instruments are great but take up a lot more time and data because they take so many points, or they have a very small footprint
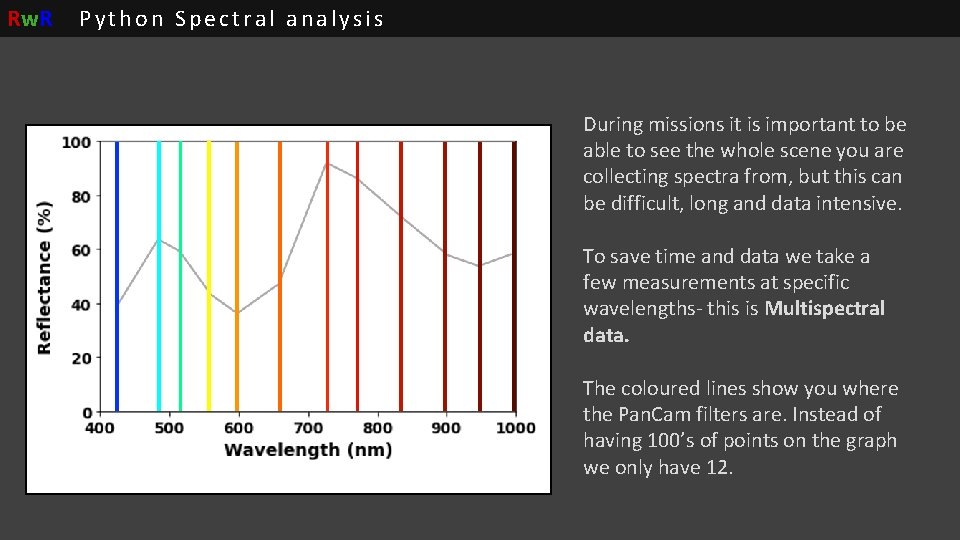
Rw. R Python Spectral analysis During missions it is important to be able to see the whole scene you are collecting spectra from, but this can be difficult, long and data intensive. To save time and data we take a few measurements at specific wavelengths- this is Multispectral data. The coloured lines show you where the Pan. Cam filters are. Instead of having 100’s of points on the graph we only have 12.
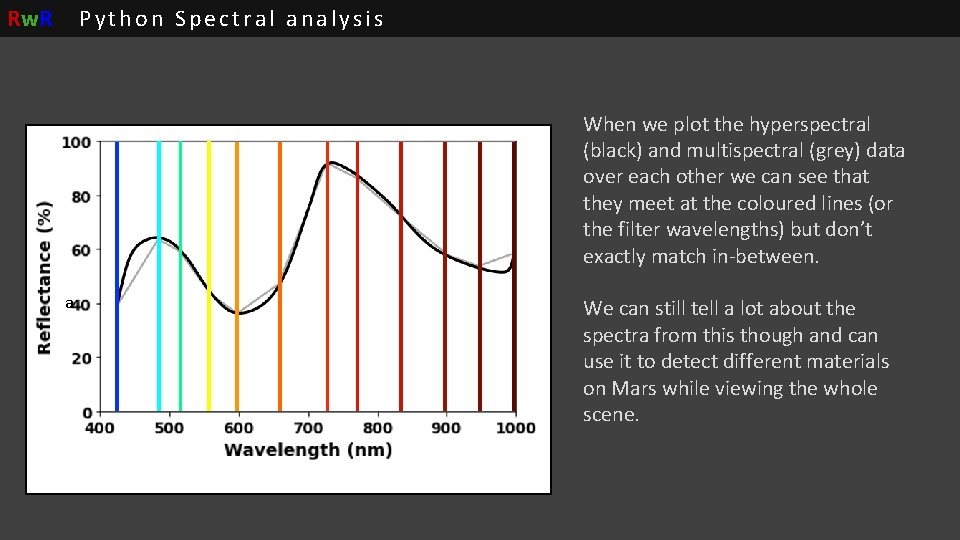
Rw. R Python Spectral analysis When we plot the hyperspectral (black) and multispectral (grey) data over each other we can see that they meet at the coloured lines (or the filter wavelengths) but don’t exactly match in-between. a We can still tell a lot about the spectra from this though and can use it to detect different materials on Mars while viewing the whole scene.
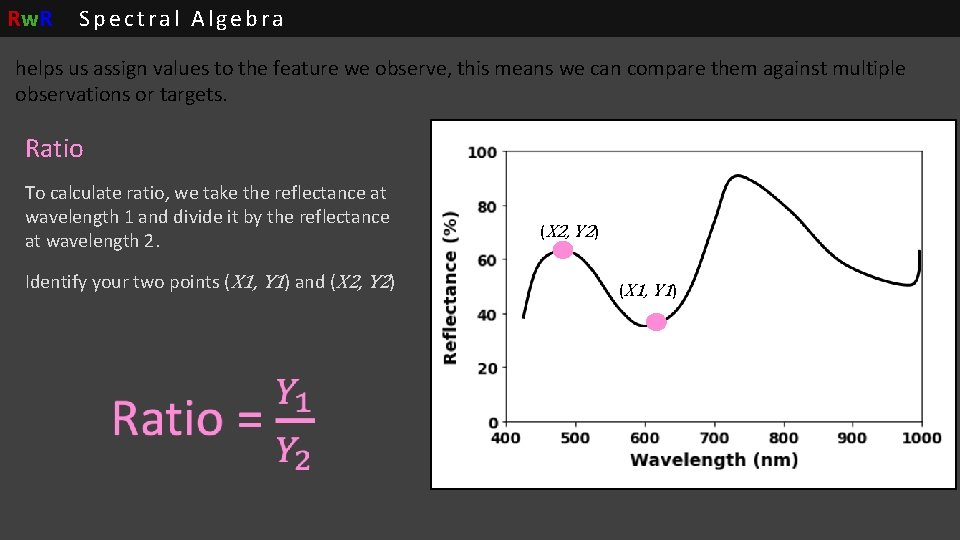
Rw. R Spectral Algebra helps us assign values to the feature we observe, this means we can compare them against multiple observations or targets. Ratio To calculate ratio, we take the reflectance at wavelength 1 and divide it by the reflectance at wavelength 2. Identify your two points (X 1, Y 1) and (X 2, Y 2) (X 1, Y 1)
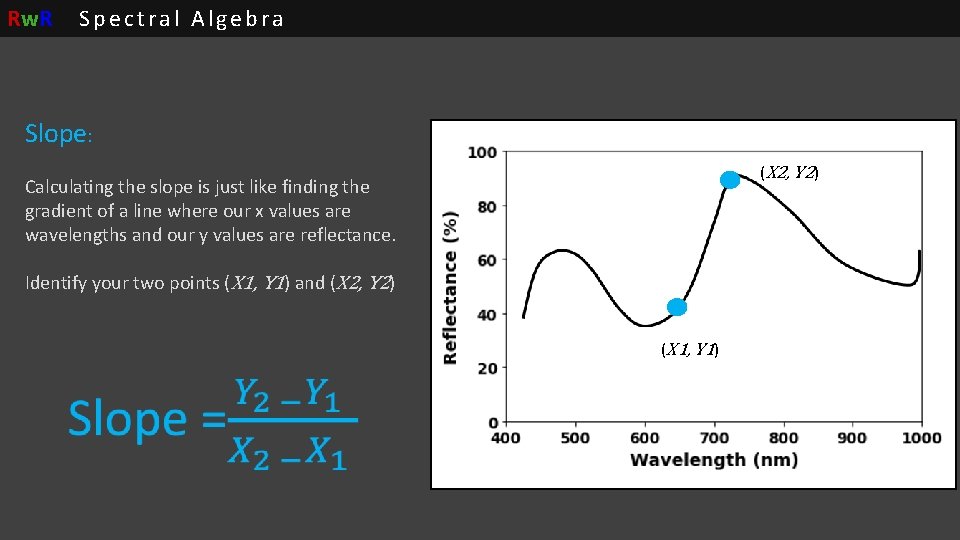
Rw. R Spectral Algebra Slope: (X 2, Y 2) Calculating the slope is just like finding the gradient of a line where our x values are wavelengths and our y values are reflectance. Identify your two points (X 1, Y 1) and (X 2, Y 2) (X 1, Y 1)
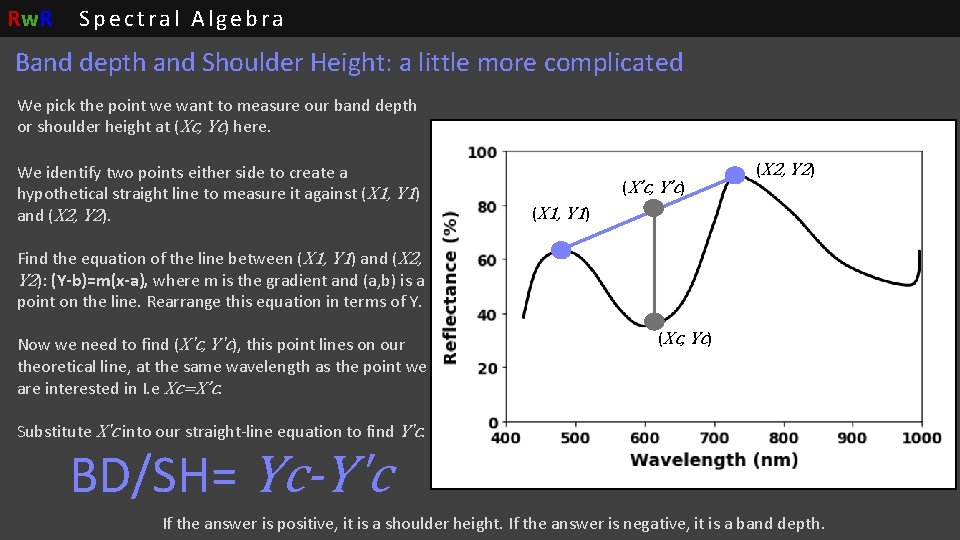
Rw. R Spectral Algebra Band depth and Shoulder Height: a little more complicated We pick the point we want to measure our band depth or shoulder height at (Xc, Yc) here. We identify two points either side to create a hypothetical straight line to measure it against (X 1, Y 1) and (X 2, Y 2). (X’c, Y’c) (X 2, Y 2) (X 1, Y 1) Find the equation of the line between (X 1, Y 1) and (X 2, Y 2): (Y-b)=m(x-a), where m is the gradient and (a, b) is a point on the line. Rearrange this equation in terms of Y. Now we need to find (X'c, Y'c), this point lines on our theoretical line, at the same wavelength as the point we are interested in I. e Xc=X’c. (Xc, Yc) Substitute X'c into our straight-line equation to find Y'c. BD/SH= Yc-Y'c If the answer is positive, it is a shoulder height. If the answer is negative, it is a band depth.
Rw. R Now try some coding for yourself! Set Up: We will be using a tool called Jupyter Notebooks in googles online programming environment Collaboratory, this means all of the work will be done on googles servers not your computers. Click the link for the activity below and it will take you to the programming page. You will need to sign in to or create a google drive account, you might need to connect the Collaboratory app to your google account. Create a folder on your drive called ‘Rw. R’ and save a copy of all the below file to this folder on your own drive so you can access and edit it. Part 1: Introduction to Python Part 2: Introduction to spectra Part 3: Mini Project Data
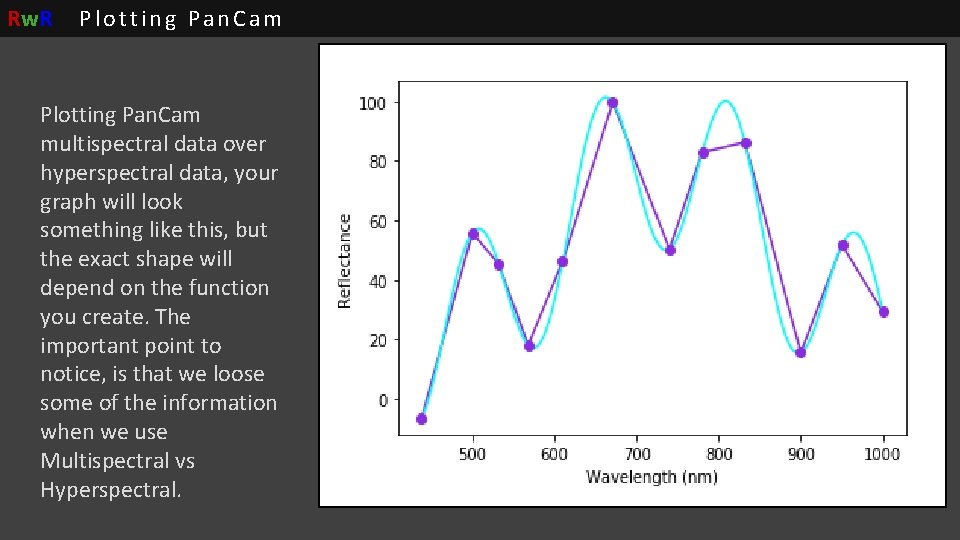
Rw. R Plotting Pan. Cam multispectral data over hyperspectral data, your graph will look something like this, but the exact shape will depend on the function you create. The important point to notice, is that we loose some of the information when we use Multispectral vs Hyperspectral.
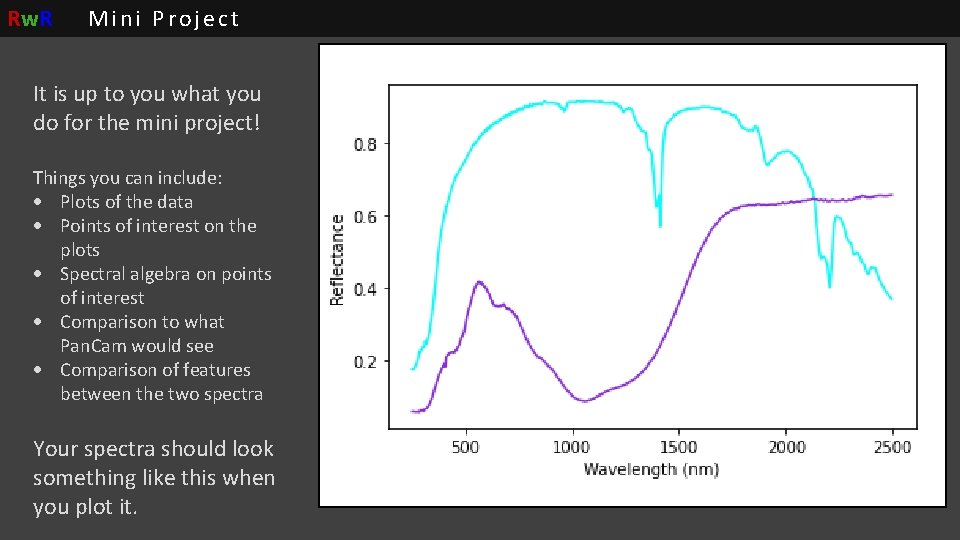
Rw. R Mini Project It is up to you what you do for the mini project! Things you can include: Plots of the data Points of interest on the plots Spectral algebra on points of interest Comparison to what Pan. Cam would see Comparison of features between the two spectra Your spectra should look something like this when you plot it.