
ROTATIONAL SPECTROSCOPY OF FLAVOR COMPOUNDS IN PEACH BRANDY
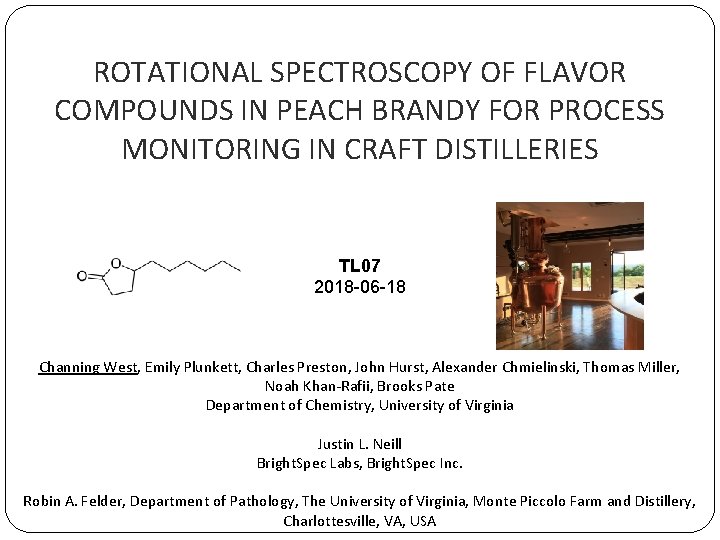
ROTATIONAL SPECTROSCOPY OF FLAVOR COMPOUNDS IN PEACH BRANDY FOR PROCESS MONITORING IN CRAFT DISTILLERIES TL 07 2018 -06 -18 Channing West, Emily Plunkett, Charles Preston, John Hurst, Alexander Chmielinski, Thomas Miller, Noah Khan-Rafii, Brooks Pate Department of Chemistry, University of Virginia Justin L. Neill Bright. Spec Labs, Bright. Spec Inc. Robin A. Felder, Department of Pathology, The University of Virginia, Monte Piccolo Farm and Distillery, Charlottesville, VA, USA
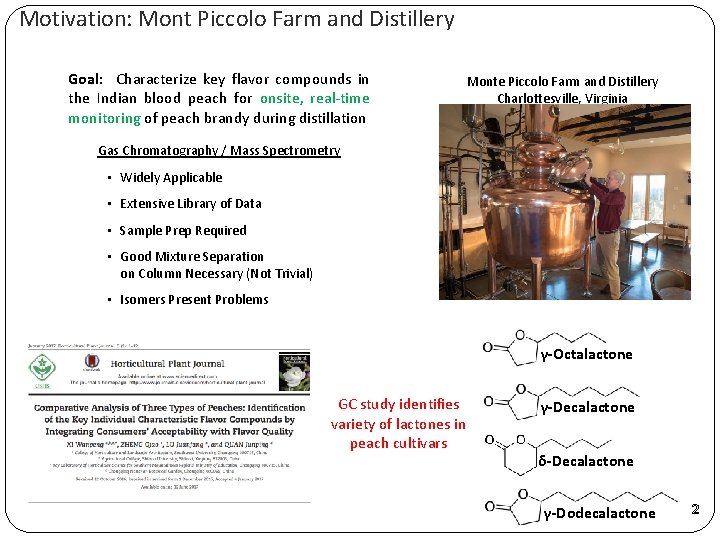
Motivation: Mont Piccolo Farm and Distillery Goal: Characterize key flavor compounds in the Indian blood peach for onsite, real-time monitoring of peach brandy during distillation Monte Piccolo Farm and Distillery Charlottesville, Virginia Gas Chromatography / Mass Spectrometry • Widely Applicable • Extensive Library of Data • Sample Prep Required • Good Mixture Separation on Column Necessary (Not Trivial) • Isomers Present Problems γ-Octalactone GC study identifies variety of lactones in peach cultivars γ-Decalactone δ-Decalactone γ-Dodecalactone 2
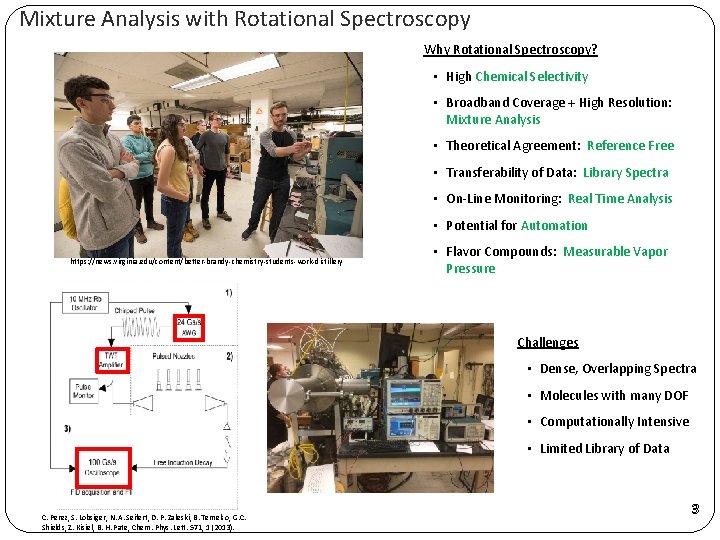
Mixture Analysis with Rotational Spectroscopy Why Rotational Spectroscopy? • High Chemical Selectivity • Broadband Coverage + High Resolution: Mixture Analysis • Theoretical Agreement: Reference Free • Transferability of Data: Library Spectra • On-Line Monitoring: Real Time Analysis • Potential for Automation https: //news. virginia. edu/content/better-brandy-chemistry-students-work-distillery • Flavor Compounds: Measurable Vapor Pressure Challenges • Dense, Overlapping Spectra • Molecules with many DOF • Computationally Intensive • Limited Library of Data C. Perez, S. Lobsiger, N. A. Seifert, D. P. Zaleski, B. Temelso, G. C. Shields, Z. Kisiel, B. H. Pate, Chem. Phys. Lett. 571, 1 (2013). 3

Library Spectra: Peach Lactones Lactone samples purchased and rotational spectra collected individually for future use. Experimental structure determination for 2 conformers of γ-octalactone, and 1 conformer of γ-decalactone Spectroscopic Constants for Peach Lactones A (MHz) B (MHz) C (MHz) ΔJ (k. Hz) ΔJK (k. Hz) ΔK (k. Hz) δj (k. Hz) δk (k. Hz) RMS (k. Hz) # conformers observed γ-Octalactone γ-Decalactone δ-Decalactone 3151. 0064 553. 93966 489. 5909 -0. 0351 0. 388 -4. 177 -0. 00782 -0. 183 2. 423 3957. 1999 243. 06478 234. 20235 -0. 00289 0. 0862 -5. 69 0 0 2. 965 2104. 91645 338. 10929 300. 21257 -0. 00723 0 -0. 729 -0. 001607 -0. 0851 4. 709 2412. 85119 146. 314678 140. 50741 0. 00214 0. 1764 10. 965 0. 000278 0 2. 939 2 2 1 1 γ-Dodecalactone 4
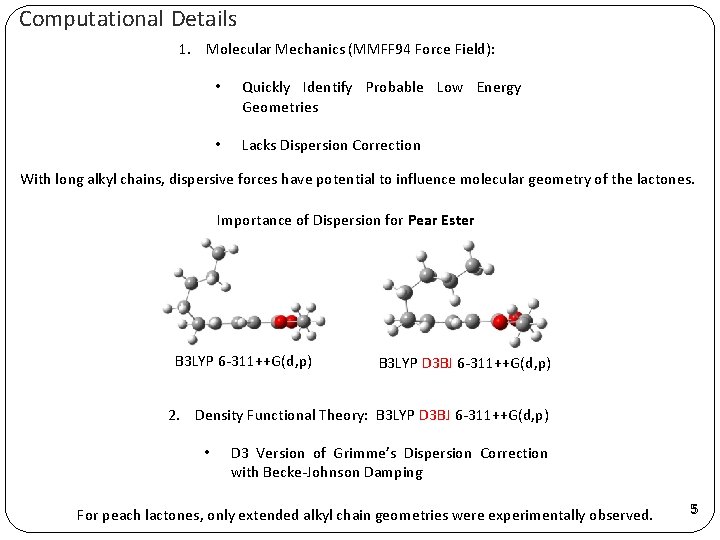
Computational Details 1. Molecular Mechanics (MMFF 94 Force Field): • Quickly Identify Probable Low Energy Geometries • Lacks Dispersion Correction With long alkyl chains, dispersive forces have potential to influence molecular geometry of the lactones. Importance of Dispersion for Pear Ester B 3 LYP 6 -311++G(d, p) B 3 LYP D 3 BJ 6 -311++G(d, p) 2. Density Functional Theory: B 3 LYP D 3 BJ 6 -311++G(d, p) • D 3 Version of Grimme’s Dispersion Correction with Becke-Johnson Damping For peach lactones, only extended alkyl chain geometries were experimentally observed. 5
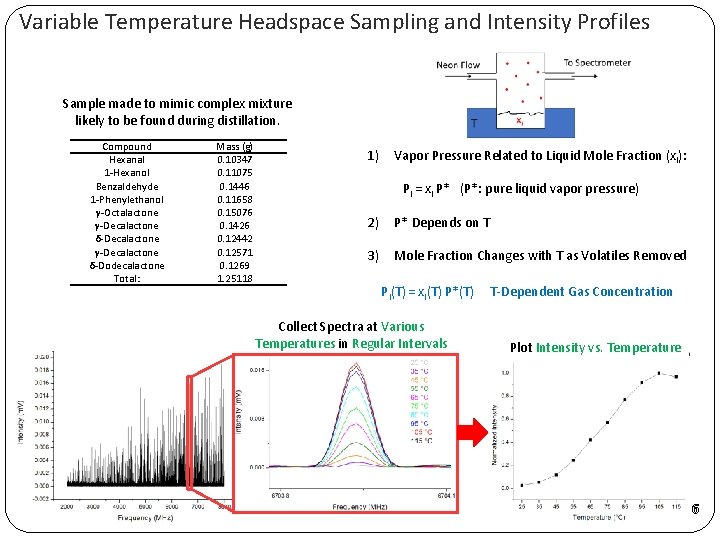
Variable Temperature Headspace Sampling and Intensity Profiles Sample made to mimic complex mixture likely to be found during distillation. Compound Hexanal 1 -Hexanol Benzaldehyde 1 -Phenylethanol γ-Octalactone γ-Decalactone δ-Decalactone γ-Decalactone δ-Dodecalactone Total: Mass (g) 0. 10347 0. 11075 0. 1446 0. 11658 0. 15076 0. 1426 0. 12442 0. 12571 0. 1269 1. 25118 1) Vapor Pressure Related to Liquid Mole Fraction (xi): Pi = xi P* (P*: pure liquid vapor pressure) 2) P* Depends on T 3) Mole Fraction Changes with T as Volatiles Removed Pi(T) = xi(T) P*(T) Collect Spectra at Various Temperatures in Regular Intervals T-Dependent Gas Concentration Plot Intensity vs. Temperature 6
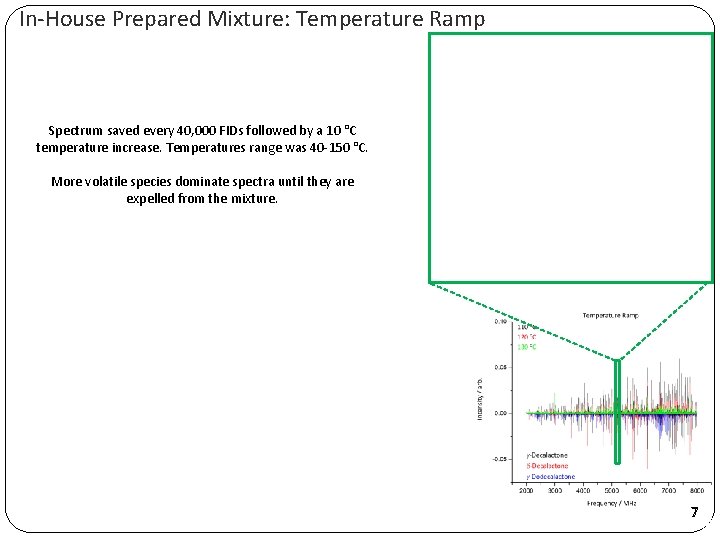
In-House Prepared Mixture: Temperature Ramp Spectrum saved every 40, 000 FIDs followed by a 10 °C temperature increase. Temperatures range was 40 -150 °C. More volatile species dominate spectra until they are expelled from the mixture. 7
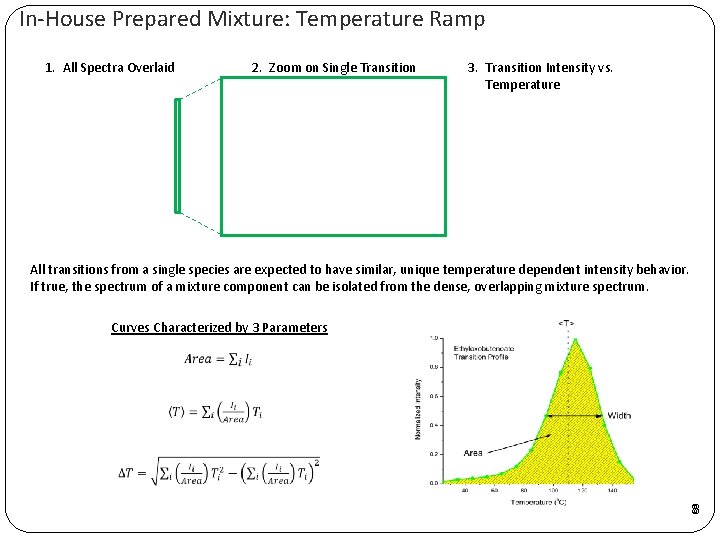
In-House Prepared Mixture: Temperature Ramp 1. All Spectra Overlaid 2. Zoom on Single Transition 3. Transition Intensity vs. Temperature All transitions from a single species are expected to have similar, unique temperature dependent intensity behavior. If true, the spectrum of a mixture component can be isolated from the dense, overlapping mixture spectrum. Curves Characterized by 3 Parameters 8
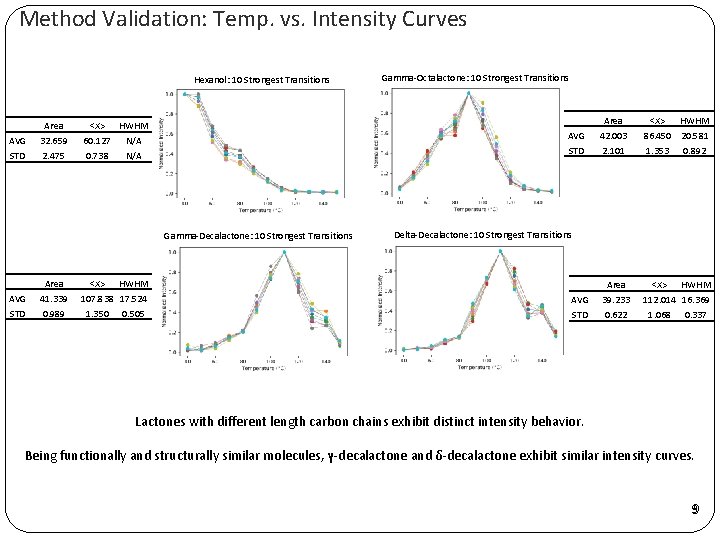
Method Validation: Temp. vs. Intensity Curves Hexanol: 10 Strongest Transitions AVG STD Area <X> HWHM 32. 659 2. 475 60. 127 0. 738 N/A AVG STD Gamma-Decalactone: 10 Strongest Transitions AVG STD Area 41. 339 0. 989 <X> HWHM 107. 838 17. 524 1. 350 0. 505 Gamma-Octalactone: 10 Strongest Transitions Area 42. 003 2. 101 <X> HWHM 86. 450 20. 581 1. 353 0. 892 Area 39. 233 0. 622 <X> HWHM 112. 014 16. 369 1. 068 0. 337 Delta-Decalactone: 10 Strongest Transitions AVG STD Lactones with different length carbon chains exhibit distinct intensity behavior. Being functionally and structurally similar molecules, γ-decalactone and δ-decalactone exhibit similar intensity curves. 9
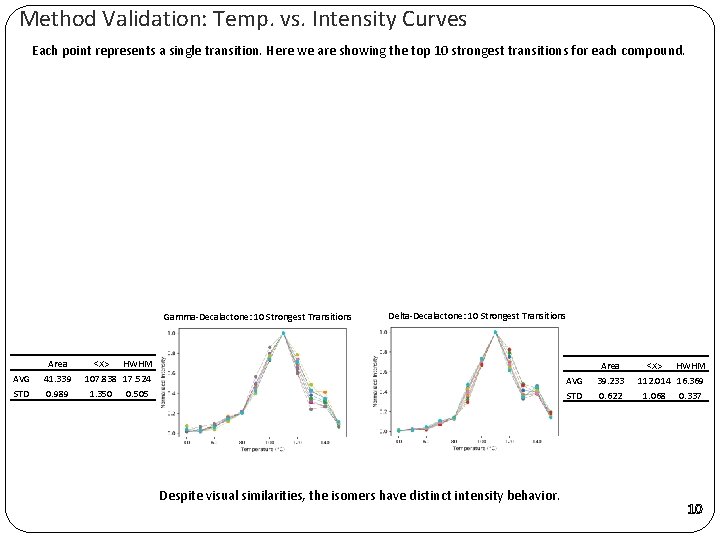
Method Validation: Temp. vs. Intensity Curves Each point represents a single transition. Here we are showing the top 10 strongest transitions for each compound. Gamma-Decalactone: 10 Strongest Transitions AVG STD Area 41. 339 0. 989 Delta-Decalactone: 10 Strongest Transitions <X> HWHM 107. 838 17. 524 1. 350 0. 505 AVG STD Despite visual similarities, the isomers have distinct intensity behavior. Area 39. 233 0. 622 <X> HWHM 112. 014 16. 369 1. 068 0. 337 10
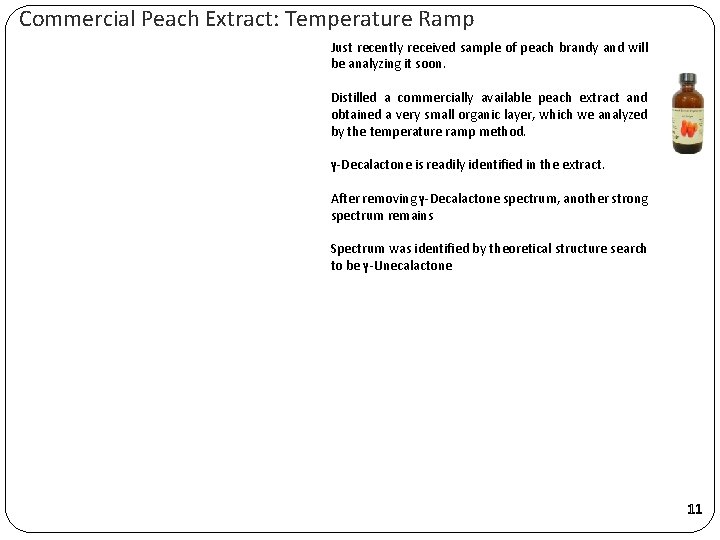
Commercial Peach Extract: Temperature Ramp Just recently received sample of peach brandy and will be analyzing it soon. Distilled a commercially available peach extract and obtained a very small organic layer, which we analyzed by the temperature ramp method. γ-Decalactone is readily identified in the extract. After removing γ-Decalactone spectrum, another strong spectrum remains Spectrum was identified by theoretical structure search to be γ-Unecalactone 11
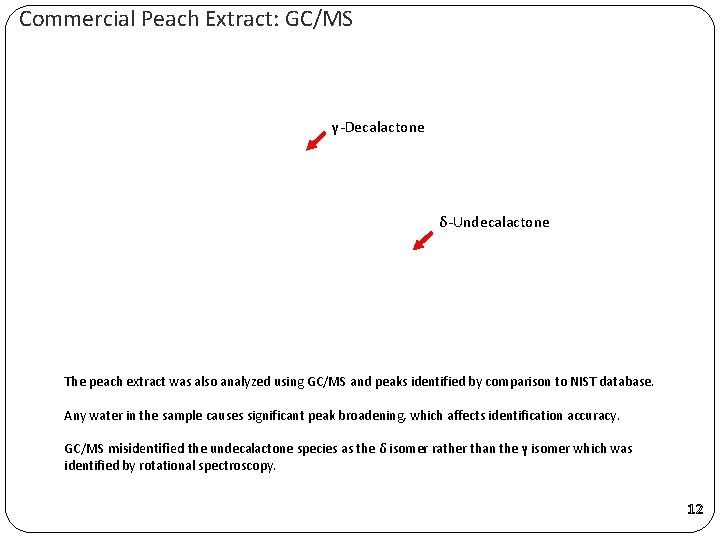
Commercial Peach Extract: GC/MS γ-Decalactone δ-Undecalactone The peach extract was also analyzed using GC/MS and peaks identified by comparison to NIST database. Any water in the sample causes significant peak broadening, which affects identification accuracy. GC/MS misidentified the undecalactone species as the δ isomer rather than the γ isomer which was identified by rotational spectroscopy. 12
Conclusions Rotational spectroscopy offers distinct advantages over other techniques used for mixture analysis. • Fingerprint spectra • Computational Agreement – Reference Free Capabilities • Automation and Real-Time Analysis Temperature ramp method has potential to simplify analysis of complex mixtures by breaking the spectrum down into the spectra of individual components. Future Tasks/Measurements Measure the Indian blood peach brandy to see if any unique compounds are responsible for the unique flavor of the brandy. Monitor compounds in commercially available cavity instrument from Bright. Spec. Acknowledgements Monte Piccolo Farm and Distillery UVA CHEM 3821 13
- Slides: 13